Bearing Capacity Evaluation of Footing on a Layered Soil using ABAQUS
Received: 22-Feb-2015 / Accepted Date: 26-Feb-2015 / Published Date: 06-Mar-2015 DOI: 10.4172/2157-7617.1000264
Abstract
In this paper, finite element method (FEM) is applied to calculate bearing capacity of a strip footing on one-layer and two-layer soil. Computations are carried out using commercial finite element software, ABAQUS to assess effect of various geotechnical and geometric parameters on soil failure mechanism under the footing. Soil profile contains two soil types including sand and clay. Soil behaviour is represented by the elasto-plastic Drucker-Prager model and footing material is assumed isotropic and linear elastic. For a homogenous soil profile, the effect of soil properties such as dilation angel and initial condition as well as footing roughness are assessed on soil failure mechanism under the footing. For this case, the bearing capacity is also obtained which has a good agreement with Terzaghi’s calculation. For a layered soil, soft-over-strong soil, the effect of layer thickness, soil shear strength and material property on bearing capacity value and failure mechanism is studied. It is concluded that the bearing capacity of footing decreases as the height of clayey soil increases whilst the displacement under footing increases. However, the stronger bottom layer does not affect ultimate bearing capacity value of footing and displacement of footing after some thickness of clayey soil on top.
Keywords: Bearing capacity; FEM; strip footing; one-layer soil; two-layer soil
8838Introduction
Geotechnical engineers often should solve problems in layered soil while the majority of existing studies have mostly focused on homogeneous continuum [1,2]. Predicting ultimate bearing capacity of footings on layered soil is very important as it is a requirement for any design and the failure mechanism of soil under footing and the bearing capacity value mainly depend on soil properties of each layer and layer thickness. Terzaghi and Peck for the first time in 1948 [1] analysed strip footing behaviour on sand overlaying clay which followed by many researchers and methods have been used are classified in four major approaches: limit equilibrium, limit analysis approach, semi empirical approach and finite element method. In recent years, Finite Element Method (FEM) have been widely using in geotechnical studies [3-6]. In practice, engineers are seeking less complicated solutions to simplify bearing capacity computations as experimental analysis is time consuming and commonly used solutions such as limit equilibrium are no longer applicable. Therefore, computer programs developed based on the finite element method have been receiving much attention over recent decades as the powerful tool for solving complex cases. Hence, bearing capacity evaluation of a footing on a clay-over-sand soil profile using powerful FEM software, ABAQUS, is objective of this study.
In the present paper after describing problem definition, first the bearing capacity analysis of a strip footing on one-layer soil will be presented. In addition, the effect of different parameters variations on soil failure mechanism and on bearing capacity value will be discussed. Then, bearing capacity analysis of a two-layer-soil system will be presented and their results will be compared with those for one-layer. Computations will be done using commercial finite element software ABAQUS, version 6.10 [7]. Also results obtained by this method will be compared with other published studies. Finally, the conclusions and final remarks will be presented in the last section of this study.
Materials and Methods
Model description
In the following section, problem definition is presented, as shown in Figure 1. Because of the long length of foundation compared to its width, problem can be modelled assuming plane strain conditions. Due to symmetry, the model can be analysed using a two dimensional finite element mesh and only half of system can be modelled, as shown in Figure 1.
Two different main cases are analysed in this paper. In the first case, it is assumed that foundation is resting on one-layer soil and in the second one there is a two-layer system. For the first case, it is assumed that the one- layer system is sandy soil and there is only Soil (2). Then, the bearing capacity of soil will be calculated and will be compared with Terzaghi calculation [1]. In addition, the effect of three different parameters will be considered for one-layer system in three different cases. The First case is considering the effect of footing type. For this comparison, once the concrete strip footing is modelled as a rigid rough footing with no horizontal movement of soil immediately under footing and once as a smooth one which implies horizontal soil movements at soil-footing interface. For the second case the effect of dilation angel ? on failure mechanism of soil is evaluated. And the third case is considering the effect of K0 or initial conditions on bearing capacity value of soil. In the second main case, soil is considered a twolayered system, while the clayey soil is resting on top of the sandy soil and the footing is sitting on top of clayey soil. Based on Figure 1, Soil (1) is clayey and Soil (2) is sandy. It should be pointed out that for this case the depth of clay layer, h1, has different thicknesses and h1/B has the value of 0.15, 0.5, 1 and 1.5. B is total width of footing. In this study, for one–layer model sandy soil is modelled as an isotropic ealsto-plastic material satisfying Drucker-Prager failure criterion. For this case, soil parameters are adapted from Helwany and are presented in Table 1 [8]. For comparing with Terzaghi’s equation for a one-layer sand , it is assumed that soil layer is replaced with the overburden of q= ϒ.D=9.60 kPa which is due to a 0.5-m-thick foundation. For top layer in the two layer system the soil parameters are adapted from work of Ziaei et al. [9] and are illustrated in Table 2.
It is worth noting that for plane strain considerations, the Mohr-Coulomb parameters and Drucker-Prager parameters were converted to each other based on existing formulations as follows [8]:
The parameters in the mentioned formulations are those presented in two previous tables. Based on the two-dimensional model presented in Figure 1, the width of footing equals B which is chosen 3 meter, here. As is illustrates in Figure 2, only half of the system is modelled due to symmetry. The length of the model is considered 40 m and its height is taken as 22.5 m, Figure 2b, which is large enough to keep the boundary conditions away from affecting soil behaviour incorrectly. It should be noted that in this study X-Y plane is the area on which soil is loaded by various loads, e.g. footing load, sur. The positive direction for Y is opposite direction of the weight. The mesh type selected is CPE8R or 8- node biquadratic, reduced integration. It should be noted that choosing size of element is an essential step which has to be taken into account to in any finite element analysis. Smaller elements near the footing, which are the main focused area, leads to more accurate answers. However, the smaller the elements are, the larger the computational time is needed. For this purpose and to achieve the reasonable number of meshes, mesh convergence study is worthy and essential. Thus, various models consisting of 150, 375, 625, 1250 and 1426 element numbers are created and are subjected to the same amount of displacement on top of the footing. In all these models, mesh is refined in areas near the footing with more stress concentration. Results of mesh convergence study are shown in Figure 2a illustrating the number of meshes versus Fy demonstrating maximum stress observed in centre of soil under the footing. It can be seen that the model with 1250 meshes is accurate enough for this study and the element adjacent to the footing has the width of w=0.13 m which is small enough according to Day and Potts 2000) [2,10]. For boundary conditions, as shown in Figure 2b, both vertical sides in the model are fixed in horizontal directions with vertical displacement. The bottom of the model is fixed in both vertical and horizontal direction and the model is assumed to be constructed on a rocky base. The model is created in three steps. In first step which is initial condition all boundary conditions have been defined. In the next step a geostatic step is applied to apply all initial stress to the model. In addition, during geostatic step gravity load and surcharge on top of the soil are applied to soil body. In the next step, to analyses collapse load of the footing a downward movement of δ/B=0.1 is applied on top of the soil under footing, where δ is vertical displacement and B is the width of footing. It should be noted that the duration for this load is 100 seconds to avoid sudden collapse of soil body. Moreover, it is assumed that relative movement between soil and footing is impossible.
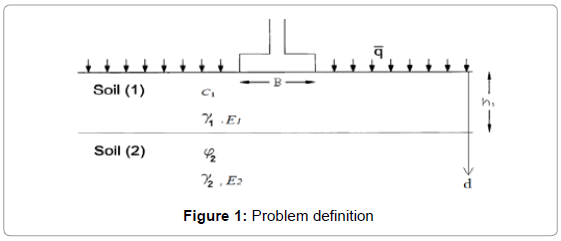
Figure 1: Problem definition

Figure 2: Finite element discretization and boundary condition selection of the model
During the generation of initial condition and stress prior to loading of footing, a lateral pressure coefficient of K0 is calculated based on following formulation for sand and clay. According to Jaky’s formula K0=1-sinФ for the sand and K0=0.95-sinФ for the clay [11]. So for this study K0 will be about 0.4 for the sand and 0.86 for the clay for 37.5° and 5° friction angel, respectively. It is worth stressing that these angels are based on Mohr-Coulomb parameters converted from Druker-Prager model based on mentioned formulations. A short –term stability of footing in particular is considered, so the sand is assumed to be fully drained and the clay is considered to be undrained.
Results
In the following sections the effect of different parameters on failure mechanism and development of plastic zone for two different cases will be analysed. Firstly, the bearing capacity assessment of one-layer soil will be presented and the effect of parameters variation on one-layer soil behaviour will be discussed and then in the following section for a two-layer soil, the effect of soil parameters and depth of top layer on bearing capacity value and on failure mechanism will be argued.
Evaluation of bearing capacity in an one-layer sandy soil
As discussed in problem definition section, the footing undergoes a downward movement of δ/B=0.01 in during 100 seconds while in the beginning of the analysis there is only gravity load and surcharge which is applied to the soil. This downward movement leads to an increase in pressure under the footing up to failure point. In this point, the failure surface develops by increasing settlement as shown in Figure 3. It can be easily noticed from Figure 3 that the existence of different areas in failure zone such as triangular zone under the footing, radial zone and a Rankin passive zone which has a good agreement with the failure mechanism and three plastic zones suggested by Terzaghi [1] exist.
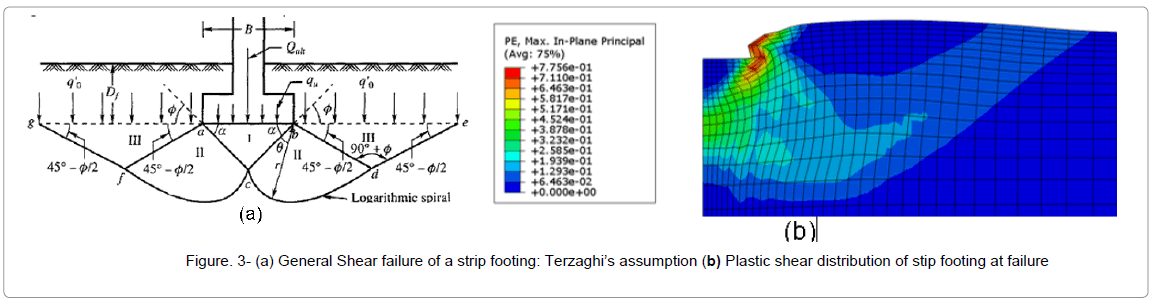
Figure 3: (a) General Shear failure of a strip footing: Terzaghi’s assumption (b) Plastic shear distribution of stip footing at failure
Figure 4 illustrates pressure–settlement curve under the footing for obtained using FEM analysis and Terzaghi. It should be noted that for FEM analysis the curves are based on the results using Drucker- Prager model once without considering dilation angel and once with considering that.
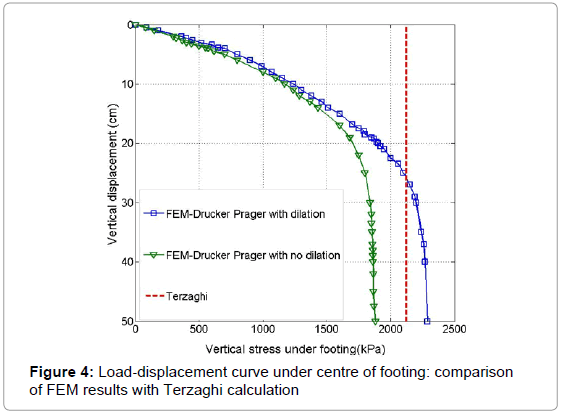
Figure 4: Load-displacement curve under centre of footing: comparison of FEM results with Terzaghi calculation
It can be seen that in FEM analysis with a higher dilation angel the bearing capacity value is 2200 kPa while in case of no dilation angel the predicted bearing capacity is 1900 kPa. In other words, the bearing capacity in FEM analysis with dilation angel is 13% higher than those with no dilation angel calculations. For reference, ultimate bearing capacity is calculated based on Terzaghi equations. It is shown in Figure 4 the bearing capacity based on Terzaghi equation is 2124 kPa which is slightly smaller than those obtained by FEM analysis with dilation angel and is bigger than those calculated by FEM analysis without dilation angel. It is worth noting that similar results were achieved by other researchers in the past and early similar results can be found in work of Borst et al. [12] and Zienkiewicz et al. [13]. In many theories it is assumed that soil behaviour is associated while in the nature soil dilation angel and friction angel most of the time do not have the same value and dilation angel is less than friction angel. So for this case the dilation angel is assumed to be 4° which is equal to ϕ-34° based on existing studies [14,15]. Note that bearing capacity with dilation angel is slightly bigger than those without dilation angle while the bearing capacity value based on Terzaghi calculation has the value between these two values. The main reason of this difference could have different assumptions in the approaches used here, e.g. in Terzaghi’s equation soil is assumed to be perfectly plastic while in current finite element analysis soil is an elasto-plastic material.
Effect of footing roughness on failure mechanism and soil settlement
To evaluate the effect of soil interface on soil failure mechanism, two analyses are carried out for one-layer sandy soil non-dilatants case. The results for smooth and rough interface of a rigid and flexible footing are compared. The vectors for the last increments of each case are shown in Figure 5. It can be seen that some horizontal movement occur at the soil interface immediately under the smooth footing, Figures 5a and 5c, while for the rough footing there is no horizontal movements occur due to boundary conditions, (Figure 5b). In addition, for flexible footing maximum settlement occurs at the edge of footing, 5-c, while for rigid footing it happens under footing. It is noted that red arrows show maximum displacement in all figures. It is clear that soil failure mechanism in rigid case for rough footing, Figure 5b, is deeper and wider than those for smooth one, 5-a, which are in agreement with those of Bolton et Lau. It should be noted that the effect of interaction variations between two parts is not taken into account here.
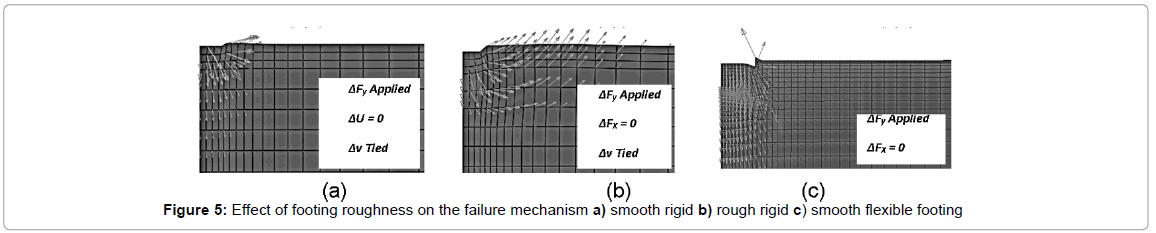
Figure 5: Effect of footing roughness on the failure mechanism a) smooth rigid b) rough rigid c) smooth flexible footing
Effect of dilation angel on failure mechanism
The vectors of incremental displacement at failure for smooth footing are shown in the Figure 6. The results show that for all the three dilation angels the failure mechanism is deeper and wider for bigger dilation angels. In addition, the bigger the dilation angel, the more the tangential angel we have. As showed in previous section in Figure 4, it was concluded that dilation angel has an important effect on bearing capacity value. These results have agreement with results showed in Potts et al. [16].

Figure 6: Effect of dilation on failure mechanism of a strip footing on cohesion-less soil
Effect of initial condition on failure mechanism
To investigate the effect of K0 (i.e. 1-sin ϕ') or initial condition, the analysis with rigid footing is repeated with K0 value of 1.0, and 10 for one layer sand case only with no dilation angel and smooth footing. The results of load- displacement curves are shown in Figure 7. It is evident that the value of K0 has an impact on load displacement curve prior to failure but not on ultimate bearing capacity value.
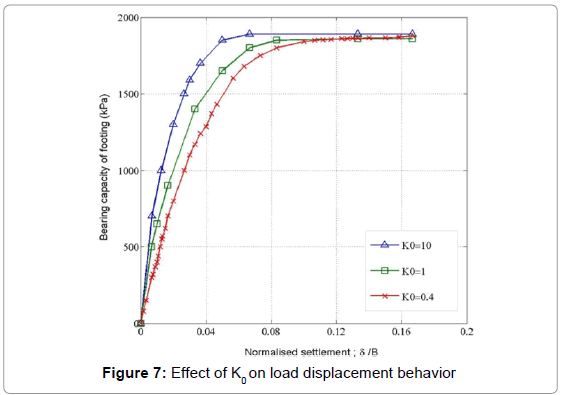
Figure 7: Effect of K0 on load displacement behavior
Evaluation of bearing capacity in a two-Layer soil
In the following section, ultimate bearing capacity prediction of a strip footing on two-layer soil is presented. Footing material is assumed to be linear-elastic, rigid, rough resting on a two-layer system in which top layer is clayey soil with soil parameters matches to Mohr-Coulomb plasticity presented in Table 2. It should be noted that the parameters of a Drucker-Prager and Mohr-Coulomb can be calculated and converted to each other based on existing formulation. For the top layer the Young modulus of clay is 5 MPa, unit weight is 1600 Kg/m3, and it has cohesion of 20 kPa with a small friction angel of 5°. For sand layer, Mohr-Coulomb parameters are cohesion of about zero and friction angel of 37.5°. The other elastic parameters are based on Tables 1 and 2.
| Type of soil | Term | Value |
|---|---|---|
| Soil (2) | Density, γ (kg/m3) | 1920 |
| Young’s Modulus, E’ (MPa) | 182 | |
| Poisson’s Ratio, ϑ | 0.3 | |
| Cohesive strength, d' (kPa) | <1 | |
| Friction angle, β ’ (plane strain), (deg) | 46° | |
| Dilation angle, ѱ (deg) | 4° | |
| Flow stress ratio, K | 1 |
Table 1: Material Properties of Sandy soil-Drucker-Prager.
| Type of soil | Term | Value |
|---|---|---|
| Soil (1) | Density, ϒ (kg/m3) | 1600 |
| Young’s Modulus, E’ (MPa) | 5 | |
| Poisson’s Ratio, ϑ | 0.3 | |
| Cohesive strength, C' (kPa) | 20 | |
| Dilation angle, ѱ' (deg) | 5° | |
| Dilation angle, ѱ,(deg) | 1° |
Table 2: Material Properties of clayey soil Mohr-Coulomb.
Depth effect on bearing capacity value
To investigate clay thickness effect on bearing capacity value, a parametric study is carried out. For this purpose, four ratios of h1/B are considered: 0.15, 0.5, 1, 1.5 and 2. Similarly, computations are performed using ABAQUS.
It can be seen in Figure 8a that there is a dramatic fall of 60% in bearing capacity of footing by adding even a thin layer of soil on top of the model. It means that bearing capacity drops from 1900 kPa to 700 kPa by adding 45 cm of clay layer. Figure 8b illustrates the effect of thickness variation in clayey material on bearing capacity value. It is obvious from Figure 9 that the bearing capacity varies by h1/B and decreases when h1/B increases. These falls are bigger in the beginning of graph and for small ratios of h1/B. After the ratio of h1/B=1.5, h1/B ratio has no effect on bearing capacity of footing anymore. In other words, the depth for which the bottom layer strength does not affect the bearing capacity value of the entire model is when h1 reaches 4.5 m or h1/B=1.5. Figure 8c illustrates the effect of clay thickness on soil displacement under the footing. For this purpose, 140 kpa of pressure has been applied on top of footing for different thickness of clay over sand, to analyse soil displacement behaviour under the same load pressure. This pressure has been selected due to weight of footing plus weight of any machinery on top of it. It can be seen that for the smaller clay depth there is less displacement under the footing. This displacement has its highest value at depth of 4.5 m or when h1/B=1.5 which reaches 21 cm of displacement. These results have a good agreement with other published studies [2,9,14]. The results obtained in this section and shown in Figures 9a-9c agree well with those obtained by Ziaei et al. [9]. The effect of various parameters on bearing capacity of footing is compared and amongst them, those most effective parameters have been chosen. Initial condition and depth of cohesive soil on bearing capacity of layered soil has been compared and results are shown in Figure 9. It can be seen that for h1/B of 0.15, bearing capacity varies between 1800 to 1920 kPa for different values of K0. However, this value varies between 150 to 1900 kPa for different values of h1/B. So, depth of clay layer has much more effective influence on bearing capacity of footing compared to the initial condition.
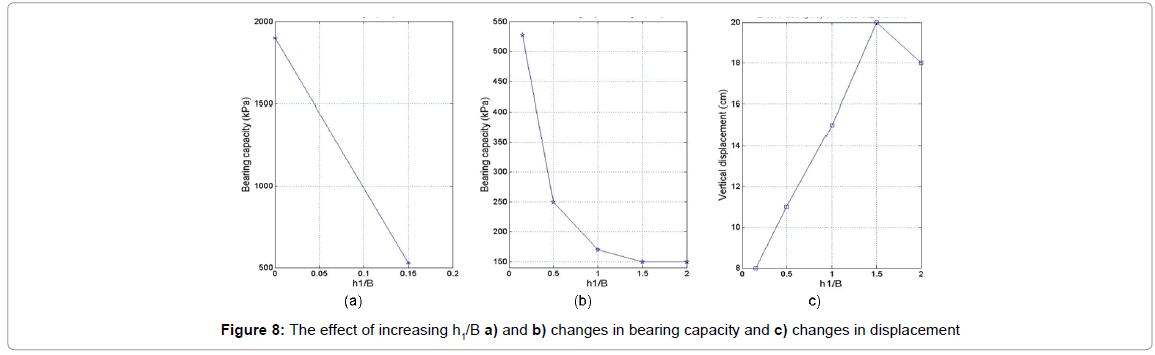
Figure 8: The effect of increasing h1/B a) and b) changes in bearing capacity and c) changes in displacement
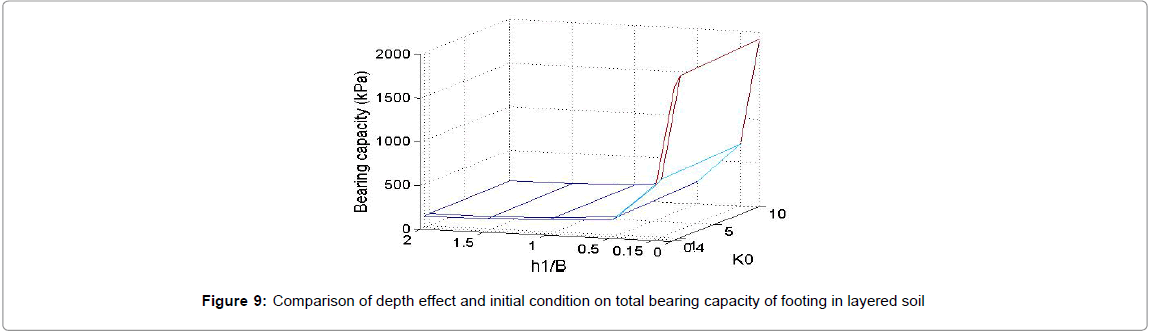
Figure 9: Comparison of depth effect and initial condition on total bearing capacity of footing in layered soil
Effect of soil layer parameters on vertical stress distribution
Figure 10 provides increase of vertical stress as a function of depth. Vertical stress distribution calculation is carried out for two cases based on FEM analysis and the results compared with those calculated from Boussinesq solutions [17]. For FEM analysis, the first case is a homogenous layer when E2/E1=1 and the second one is a two-layer soil when top layer is clayey soil with E2/E1=30 and has a depth of h1=0.45. It is noted that all soil properties for these two soils are based on those presented in Tables 1 and 2 and soil is assumed to be weightless. At top of the soil profile the load of q=12 KN/m2 or 12 kPa supposed based on weight of a 3-m- wide concrete footing. The increase in vertical stress under centre of footing is plotted and results are show in Figure 9. It can be seen that for a one-layer soil both diagrams; Boussinesq and FEM; have almost the same pattern especially for deeper depths (Z>2 m) although FEM solution has bigger values than Boussinesq solution. These differences can be because of different assumptions in two approaches here, e.g. in Boussinesq formulation the soil is assumed to be weightless, linear elastic isotropic while in nature and in this study soil is assumed to be elasto-plastic. For a layered system, E2/E1=30, when the surface layer is weaker then vertical stresses in upper layer exceeds the Boussinesq values. At the interface, the vertical stress fell to less that 4 kPa from almost 13 kPa or dropped to less than 70% of its origin value. In this case, first layer transfers less vertical stress to the second layer. In other words, the effect of the strength of bottom layer has less contribution to stress distribution when the upper soil becomes weaker compared to the bottom layer. In addition, for deeper values and near to depth of 8 m all graphs has value less than 4 kPa and tend to have the similar value.
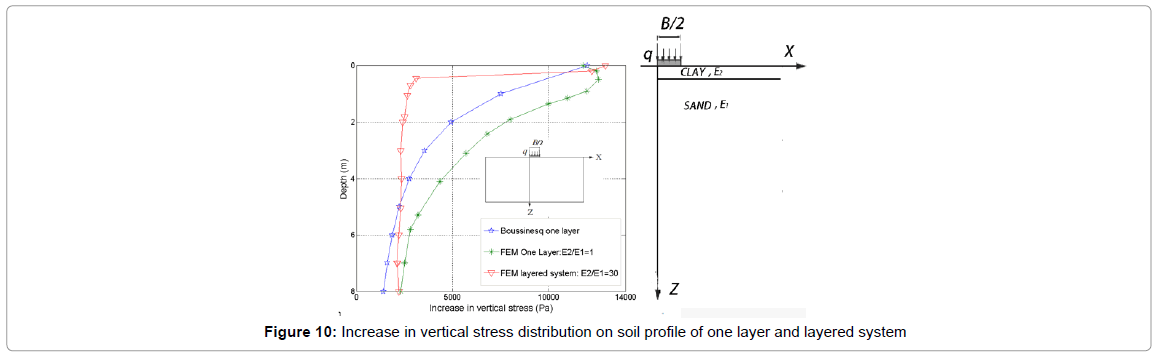
Figure 10: Increase in vertical stress distribution on soil profile of one layer and layered system
Figure 11 provides the effect of clay depth on stress distribution variation with depth. It can be seen that for smaller value of h1/B, e.g., for the value of 0.15 there is more stress in soil near earth surface while by increasing clay depth there is reduction in stress distribution close to earth. For example, vertical stress in depth of z=0.5 m are 500, 241,177 and 176 kPa, for different value of h1/B=0.15, 0.5, 1 and 1.5, respectively. For the depth of more than 6 metres there is no effect of h1/B value on vertical stress distribution and all graphs tend to have same values.
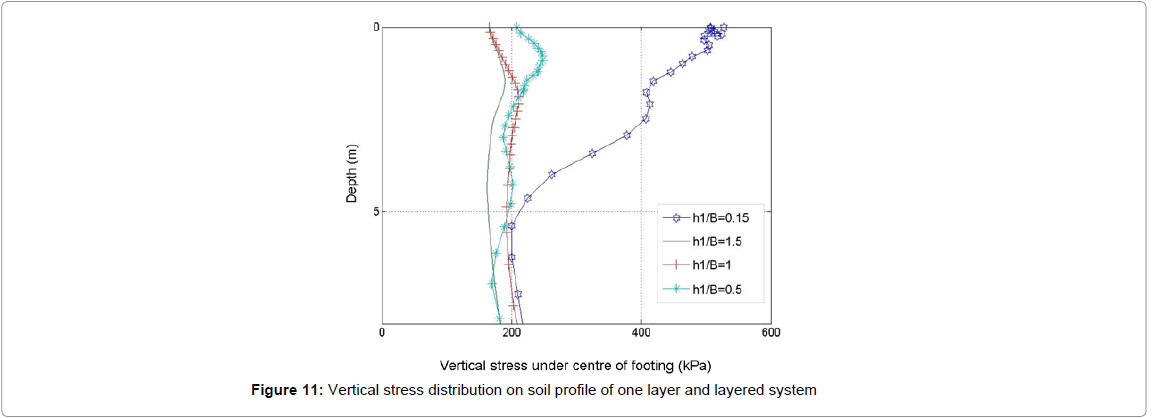
Figure 11: Vertical stress distribution on soil profile of one layer and layered system
Shear strength effect of clay on failure mechanism development
In Figure 12 plastic shear strain are plotted at failure point for smooth rigid footing for the case of clay-over- sand. The interface of two layers is shown with a dark line in each figure. As a quick review, it is obvious that failure mechanism is deeper when h1/B is bigger. It should be noted that in the present method it is assumed that soil with elasto-plastic behaviour deforms under load while footing as a rigid body does not. In addition, soil element yields progressively in soil body from any element to the next element and a shear surface can be obtained as shown in Figure 12. It can be seen from Figures 12a and 12b when h1 is smaller, the failure mechanism does not only shrink into the top layer. For the smaller value of h1/B plastic zone goes to bottom layer and does not stay only in top layer. By increasing h1, the plastic zone only stays in top layer and bottom layer’s strength has no effect on bearing capacity value after specific depth. In other words, the plastic zone tend to stay in top layer as the height of weak soil increase and does not go to the stronger layer which aggresses well with results obtained by Potts et al. [16] and Zhu [2].
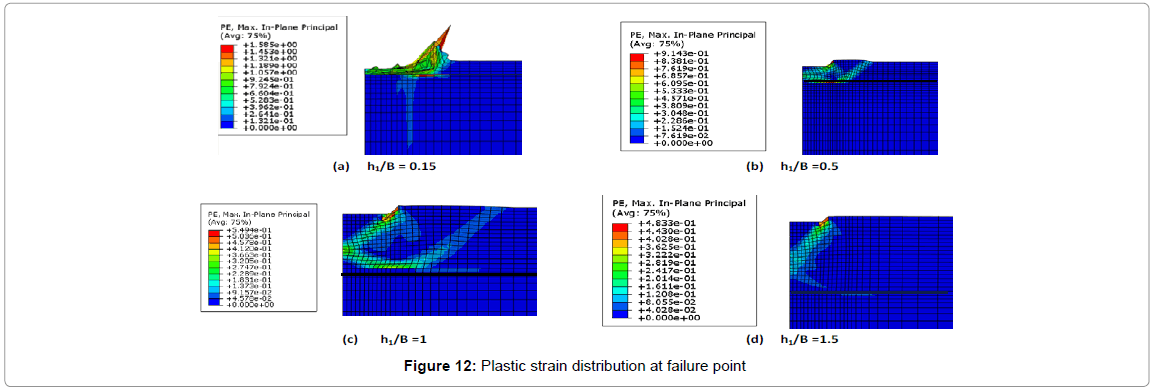
Figure 12: Plastic strain distribution at failure point
The overall and summary of clay depth effect on PEEQ variation is shown in Figure 13. It can be seen that for the smallest thickness of clay layer, h1=0.45 m or h1/B=0.1 maximum plastic shear strain is 1.58 while with increasing depth this value de creases to 0.9, 0.54 ,0.31 and 0.06 for h1/B=0.5, 1 , 1.5 and 2, respectively

Figure 13: Effect of clay depth on shear strain distribution value
Effect of material properties on magnitude and direction of displacement
The same magnitude downward displacement on both footings has been applied and displacement vectors at failure for clay-over-sand and sandy soil in the case of smooth rigid footing are shown in Figure 14. It can be seen that the displacement at top of the surface near the footing has a downward direction in sandy soil, shown in Figure 14a, while in clayey soil displacement vectors are about 45° to the horizontal axis, as shown in Figure 14b. These results have a good agreement with those obtained by Ziaei et al. [9] and Potts [6]. It should be noted that in both cases same displacement value has been applied on top of soil.
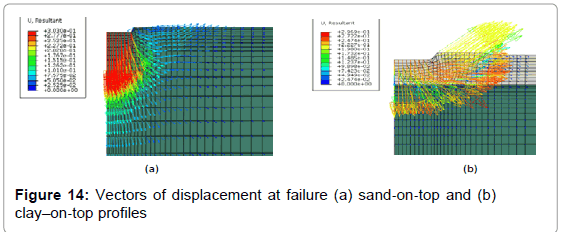
Figure 14: Vectors of displacement at failure (a) sand-on-top and (b) clay–on-top profiles
In addition, after applying the same pressure on top of soil, 140 kPa, displacement under both footings has been observed and the results have been illustrated in Figure 15. It can be seen that under same pressure, maximum displacement in clayey soil is almost 50 times bigger than those happen in sandy soil. In other words, in the case of h1/B=0.5 the displacement under footing has a value of 0.2 m for clayey soil, Figure 15b, while under same pressure only 0.004 m displacement occurs in sandy soil, Figure 15a.
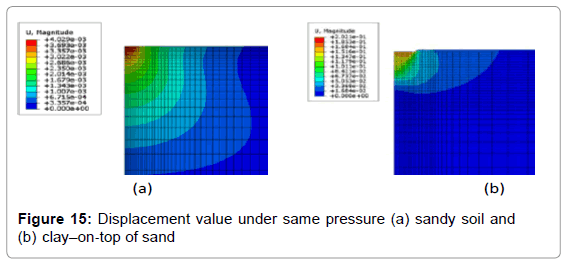
Figure 15: Displacement value under same pressure (a) sandy soil and (b) clay-on-op of sand
Conclusions
In this research, a numerical analysis was carried out to investigate the influence of different parameters on ultimate bearing capacity of layered soil and on soil failure mechanism. The soil was modelled as an elasto- plastic material and computation was done using FEM software, ABAQUS.
For homogenous soil profile, the effect of soil parameters such as dilation angel, footing roughness and initial condition has been studied on soil behaviour. It is found that with increasing dilation angel the wider and the deeper failure mechanism is accrued. In addition the failure mechanism for rough interaction is deeper and wider than those for smooth one. The initial condition, K0, has an effect on soil behaviour before failure but has no effect on bearing capacity value.
The bearing capacity value of one-layer sandy soil computed by ABAQUS was compared with those predicted by Terzaghi’s equation. It is concluded that for FEM analysis, the values for bearing capacity considering dilation angel is 13% bigger than those with no dilation angel which shows considering dilation angel effect of material is important in predicting bearing capacity of soil properly.
In two-layer-soil comparing to one-layer-soil, bearing capacity decreases dramatically to less than 60% of its value by adding a clayey soil with the thickness of h1/B=0.15. Increasing depth of clay leads to smaller values for bearing capacity showing that top layer mostly controls bearing capacity value.
According to Michalowski [18], a so-called critical depth in which strength of bottom layer has no influence on bearing capacity of whole model exists and this depth in this case is h1/B=1.5 or h1=4.5.
For smaller values of h1, the failure mechanism go further to the bottom layer while with increasing h1 or thickness of clay, the plastic zone only shrinks into top layer.
Direction and magnitude of displacement vectors are much smaller and more downward when the top layer is sandy soil.
In the presented study the approach applied is straightforward for a two-layer soil and is applicable for multi-layer soil profiles as well. However, in this research only a short–term stability of footing was considered, the study on long-term behaviour of material would be of interest. In addition, the effect of footing-soil interaction can be taken into consideration in analysis.
References
- Terzaghi K (1996) Soil Mechanics in Engineering Practice. John Wiley & Sons, New York, United States.
- Zhu M (2004) Bearing Capacity of Strip Footings on Two-layer Clay Soil by Finite ElementMethod. ABAQUS Users’ Conference, Boston.
- Burd H, Frydman S (1997) Bearing capacity of plane-strain footings on layered soils. Canadian Geotechnical Journal34: 241-253.
- Griffiths DV (1989) Computation of collapse loads in geomechanics by finite elements.Ingenieur-Archiv59: 237-244.
- Potts DM, Zdravkovic L (1999)Finite Element Analysis in Geotechnical Engineering: VolumeOne - Theory.Thomas Telford, UK.
- Ghazavi ME, Amir (20008) A Simple Limit Equilibrium Approach for Calculation of Ultimate BearingCapacity of Shallow Foundations on Two-Layered Granular Soils. Geotechnical and Geological Engineering 26: 535-542
- Helwany S (2007) Applied Soil Mechanics with ABAQUS Applications. John Wiley & Sons, New York, United States.
- ZiaieMoayed R, Rashidian V, Izadi E (2012) Evaluation on Bearing Capacity of RingFoundations on two Layered Soil. World Academy of Science, Engineering & Technology 61: 1108-1112.
- Day RA, Potts DM (2000) Discussion on ‘Observations on the computation of the Bearing Capacity Factor Nγ by Finite Elements’ by Woodward & Griffiths. Geotechnique 50:301-303.
- Jaky J (1944) The coefficient of earth pressure at rest.J SocHungarian Architects Eng 1944: 355-358.
- Borst RD, Vermeer PA (1984) Possibilites and Limitations of Finite Elements forLimit Analysis. Géotechnique 34: 199-210.
- Zienkiewicz OC, Humpheson C, Lewis RW (1975) Associated And Non-AssociatedVisco-Plasticity And Plasticity In Soil Mechanics Source.Géotechnique 25: 671-689
- Shiau JS, Lyamin AV, Sloan SW (2011) Bearing capacity of a sand layer on clay by finiteelement limit analysis. Canadian Geotechnical Journal 40: 900-915.
- Houlsby GT (1991) How the dilatancy of soils affects their behaviour.University of Oxford, Oxford, UK.
- Potts DM, Zdravkovic L, Zdravkovic L (2001) Finite Element Analysis in GeotechnicalEngineering: Application. Thomas Telford.
- Boussinesq J (1885) Application des potentiels à l'étude de l'équilibreet du mouvement des solidesélastiques. Gauthier Villars, Paris.
- Michalowski RL (2002) Collapse Loads over Two-layer Clay Foundation Soils. Soils and Foundations 42: 1-7.
Citation: Mosadegh A, Nikraz H (2015) Bearing Capacity Evaluation of Footing on a Layered-Soil using ABAQUS. J Earth Sci Clim Change 6: 264. DOI: 10.4172/2157-7617.1000264
Copyright: ©2015 Mosadegh A, et al. This is an open-access article distributed under the terms of the Creative Commons Attribution License, which permits unrestricted use, distribution, and reproduction in any medium, provided the original author and source are credited.
Select your language of interest to view the total content in your interested language
Share This Article
Recommended Journals
Open Access Journals
Article Tools
Article Usage
- Total views: 24175
- [From(publication date): 3-2015 - Aug 30, 2025]
- Breakdown by view type
- HTML page views: 18833
- PDF downloads: 5342