Carbon Stock Analysis along Slope and Slope Aspect Gradient in Gedo Forest: Implications for Climate Change Mitigation
Received: 31-Aug-2015 / Accepted Date: 21-Sep-2015 / Published Date: 30-Sep-2015 DOI: 10.4172/2157-7617.1000305
Abstract
Tropical forests have the largest potential to mitigate climate change amongst the world’s forests through conservation of existing carbon pools and expansion of carbon sinks . Ethiopia is one of tropical country which has significant forest resource but the studies on carbon stock variation along environmental variables have not been well studied. This study was done with the aim of assessing carbon stock amount variation along slope and slope aspect gradient in Gedo forest. Data was collected from 10 m × 20 m plot along transect in systematically stratified forest part. The largest total mean carbon stock (570.67 ± 40 ton ha-1) was found in lower slope class and the lowest total mean carbon stock (421.2 ± 56.2 ton ha-1) was found in higher slope class. The deadwood biomass was only found in lower slope class. The highest mean total carbon stock was calculated in east slope aspect (778.13 ± 75.93 ton ha-1) and the lowest mean total carbon stock was calculated in south west slope aspect (358.58 ± 73.45 ton ha-1). Slope has significant effect on leaf litter biomass carbon. Slope aspect has significant effect on aboveground biomass and below ground biomass carbon, soil organic carbon and total carbon density. Based on overall result it is concluded carbon stock in a forest ecosystem is determined by slope aspect and slope gradient.
Keywords: Biomass carbon; Climate change mitigation; Slope aspect; Slope gradient; Soil organic carbon
9016Introduction
Increasingly convincing evidences show that the Earth is getting warmer. Global warming could have serious effects on human being and in the future this situation become more serious [1]. Atmospheric concentration of CO2; primary and the best studied and effective greenhouse gas is continuously increased through time and changes the earth’s climate. This is true in Ethiopia, climate change affect human being including the surrounding environment. Ethiopia is one of the countries that have significant amount of forest resources. The forest and woody vegetation of Ethiopia play an important environmental role in sequestering anthropogenic atmospheric carbon. The largest C store is found in the woodlands (45.7%) and the shrub lands (34.4%) [2]. Different literature indicates the carbon estimation for Ethiopia such as Brown [3] reported a carbon density of 101 tons per ha for high forests in Ethiopia, 2.5 billion tons in 2005 reported by Sisay [4] and 867 million tons by Gibbs and Brown [5]. Carbon sequestration from atmosphere can be advantageous from both environmental and socioeconomic perspectives. The vegetation of tropical forest is a large and globally significant storage of carbon because tropical forest contains more carbon per unit area than any other land cover. According to Kumar [6] although changes in species composition and distribution, biodiversity and community structure along topographic gradients have been well documented in the past few decades but altitudinal patters of C storage in forest ecosystems remain poorly studied. This is true in Ethiopia there has been very limited forest carbon stock study by considering environmental factors that affect carbon stock. Gedo forest is one of Ethiopia’s forests which have tremendous role for stocking carbon within their biomass and soil. This contributes a lot to mitigate climate change but carbon stocking process could be influenced by different topographic features. There is no scientific study that shows topographic influence and variation on carbon stock amount. Therefore this study shows and proves scientifically the role of slope and slope aspect on the amount of forest carbon stock.
Materials and Methods
Description of study area
Gedo Forest is located in Cheliya District, West Shewa Zone of Oromia National Regional State. The district has altitudinal range of 1300-3060 m.a.s.l as cited in [7]. The study area lies approximately between latitudes 9°01` and 9° 09` North and longitudes 37°15` and 37°27` East (Figure 1). It is one of the national forest priority areas of Ethiopia. It covers the total area of above 10,000 hectare [8]. The Meteorological data obtained from Addis Ababa National Meteorology Service Agency indicated that Gedo area have mean annual temperature ranges from 11°C to 19°C with a mean of 15°C. According to Meteorological data obtained for Gedo area, annual rainfall in the forest area is between 500 mm and 1500 mm and has mean annual rainfall of 1054 mm. According to [9] study, in Gedo forest dominated by Olinia rochetiana, Olea europaea subsp. cuspidata, Prunus africana, Ekebergia capensis, Allophylus abyssinicus, Syzygium guineese subsp. Afromontanum, Ficus sur, Podocarpus falcatus species.
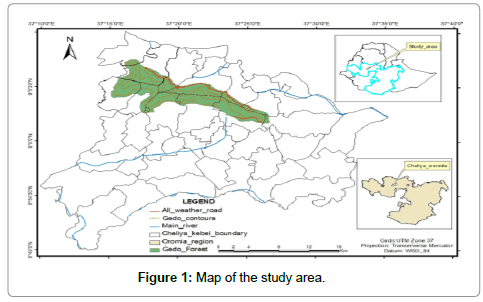
Figure 1: Map of the study area.
Methodology
Delineation and stratification of study area: According to Bhishma [10] the first step in forest carbon measurement is delineation of the study boundaries. The spatial boundaries of the study area were clearly defined and properly recognized to facilitate accurate measuring, accounting and verification. For this study GPS tracking were used for boundary delineation. The study area stratification was done base on slope classification as lower slope (0-10%), middle slope (11-23%) and higher slope (24%) and slope aspect was another topographic parameter considered in the study and classify into eight slope aspect as E (East), NE (North East), N (North), W (West), NW (North West) SE (South East), S (South) and SW (South West).
Sampling techniques and field carbon measurement: Systematic sampling method was used to take samples. Sample plots were laid along line transects based on lope variation of the study area. A systematically assigned sampling plot of 10 m × 20 m (200 m2) in each site was established. To reveal the tree composition and biomass, all live trees with a diameter ≥ 5 cm within the plot were measured by using diameter tape [10].
Field carbon stock measurement and estimation:
i. Aboveground tree biomass (AGB) carbon: The DBH (at 1.3 m) and height of individual trees greater than or equal to 5 cm DBH were measured in each rectangular plot, starting from the edge and working inwards.
The equation to be used to calculate the above ground biomass is given below:
Y= 34.4703 - 8.0671(DBH) + 0.6589(DBH2) (1)
Where, Y is above ground biomass in kg., DBH is diameter at breast height in cm. The carbon content in the biomass were estimated by multiplying 0.47 while multiplication factor 3.67 needs to be used to estimate CO2 equivalent [11].
ii. Belowground biomass (BGB) carbon: To measure BGB, It was used root-to-shoot ratio, which has become the standard method for estimating root biomass from the more easily measured shoot biomass. The equation developed by MacDicken [12] to estimate below-ground biomass was used.
The equation is given below:
BGB=AGB × 0.2 (2)
Where, BGB is below ground biomass, AGB is above ground biomass, 0.2 is conversion factor (or 20% of AGB).
iii. Leaf litter biomass carbon stock: At the center and each corner of each Rectangular plot, Five 1 square meter sub plot of in size were established. the leaf litter within the 1 m2 sub plots were collected and weighed. Hundred grams of evenly mixed sub-samples were brought to the laboratory placing in a sample plastic bag to determine moisture content, from which total dry mass and organic matter can then be calculated [10]. After laboratory work carbon stock at each plot in ton/ ha was calculated by using appropriate allometric equation.
According to Pearson [11], estimation of the amount of biomass in the leaf litter can be calculated by:
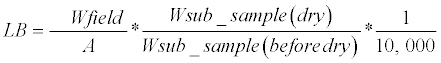 (3)
(3)
Where: LB=Litter (biomass of litter t ha-1);
Wfield=weight of wet field sample of litter sampled within an area of size (g);
A=size of the area in which litter were collected (ha);
W sub-sample, dry=weight of the oven-dry sub-sample, and
W sub-sample, before dry=weight of the fresh sub-sample of litter taken to the laboratory to determine moisture content (g).
Carbon stocks in dead litter biomass;
CL=LB × % C (4)
Where, CL is total carbon stocks in the dead litter in t ha-1, % C is carbon fraction determined in the laboratory [11].
iv. Dead wood biomass carbon: According to [11], for standing dead wood which have branches were measured similar to the biomass estimation allometric equation of above ground biomass. If it is less than 1.3 m tall, the diameter and height was measured as close as possible to the top and considered as logged trees. When standing dead wood have not leaves, there was a subtraction of 5-6 percent for softwood/conifer species and 2-3 percent of hardwood/broadleaved species for their branches [11]. Most of the existing species were conifer species, and hence 5-6 percent reduction from the total above ground biomass of each tree provided estimates of the deadwood carbon stock. The allometric equation confirmed in REDD methodology were used to estimate the amount of biomass in standing dead wood.
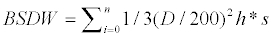 (5)
(5)
Where, biomass is expressed in kg, h=length (m), D=tree diameter (cm) and s=specific gravity (g cm-3) of wood. According to Hairiah [13] specific gravity (g cm-3) of wood is estimated as 0.5 g cm-3 as default value.
The total biomass of dead wood were obtained by adding the biomass of standing dead wood which have branch and standing biomass of wood which have no branch.
TBDW=SBDWB+ SBDWN (6)
Where: TBDW= Total Biomass Dead Wood
SBDWB=standing biomass dead wood branched
SBDWN=standing biomass dead wood non branched
Then the carbon content in dead wood is calculated by multiplying total biomass of dead wood with the [14] default carbon fraction of 0.47.
v. Soil organic carbon: Soil samples for soil carbon determination were collected at the same sampling sub-quadrats recommended for litter sampling. From the center and corner of each plot a pits of up to 30 cm in depth were dug to best represent forest. Hundred grams of composite sample were collected from one plot from three depths (0-10 cm, 10-20 cm and 20-30 cm) by digging the soil with the help of standardized metal soil sampling auger. The soil samples collected from plot were brought to the laboratory.
According to [11], soil organic carbon estimated by the formula:
SOC=BD * d * % C (7)
Where, SOC= soil organic carbon stock per unit area (t ha-1), BD=soil bulk density (g cm-3),
D=the total depth at which the sample was taken (30 cm), and
%C=Carbon concentration (%).
vi. Total carbon stock density: The carbon stock density is calculated by summing the carbon stock densities of the individual carbon pools using the [11] formula;
Carbon stock density of a study area:
C density=CAGB + CBGB + C Lit + CDWD +SOC (8)
Where: C density=Carbon stock density for all pools [t C ha-1]
C AGTB=Carbon in above -ground tree biomass [t C ha-1]
CBGB=Carbon in below-ground biomass [t C ha-1]
C Lit=Carbon in dead litter [t C ha-1]
CDWD=Carbon in dead wood biomass [t C ha-1]
SOC=Soil organic carbon [t C ha-1]
The total carbon stock is then converted to tons of CO2 equivalent by multiplying it by 44/12 or 3.67 [15].
Data analysis
The data obtained from DBH, Basal area, height, density and frequency of each species, fresh weight and dry weight of litter, dead wood and soil were analyzed by using Statistical Package for Social Science (SPSS) software version 20. The height and diameter data were arranged in classes for applying appropriate model of biomass estimation equation. Descriptive statistics were used for measured parameters. The significant of each measured parameter were tested by one way ANOVA and post-hoc test at αof 0.05 to perform pairwise comparison of means and yield significant results. Pearson correlation was used to test the relationship between forest carbon stock with topographic variables.
Results And Discussion
Results
Forest carbon stocks along slope gradient: It was observed that the higher AGB and BGB carbon was estimated in the lower slope class with mean total of 324.79 ± 32.59 ton ha-1 and 64.95 ± 6.51 ton ha-1, respectively. The lower AGB and BGB carbon was estimated in higher slope class with the mean of 187.49 ± 40.2 ton ha-1 and 37.49 ± 8.04 ton ha-1 carbon, respectively. On the other hand, the higher carbon in litter biomass was estimated in the middle slope class with the mean total of 0.41 ± 0.05 ton ha-1 and the lower litter biomass carbon was computed in higher slope class. The deadwood biomass carbon only observed and calculated in the lower slope class with the mean total of 5.088 ± 2.81 ton ha-1. The higher SOC estimated in lower slope class with the mean total of 195.87 ± 12.80 ton ha-1 and the lower was estimated in the higher slope class with the mean total of 175.42 ± 7.83 ton ha-1 (Table 1). Based on the total carbon stocks the ranks was ordered as lower slope > middle slope > higher slope.
| Slope class | No of plot | C.AGB | C.BGB | C.LB | C.DWDB | C.OS | Total C. |
|---|---|---|---|---|---|---|---|
| Lower | 35 | 324.79 ± 32.59 | 64.95 ± 6.51 | 0.4 ± 0.008 | 5.088 ± 2.8 | 195.87 ± 12.8 | 570.67 ± 40 |
| Middle | 24 | 279.4 ± 45.9 | 55.88 ± 9.19 | 0.41 ± 0.05 | 0 | 187.62 ± 13 | 523.34 ± 56. |
| Higher | 16 | 187.49 ± 40.2 | 37.49 ± 8.04 | 0.37 ± 0.037 | 0 | 175.42 ± 7.8 | 421.2 ± 56.2 |
Table 1: Estimated carbon stock (ton ha-1) along slope variation at each carbon pool.
Based on one way ANOVA analysis, Slope has significant difference on leaf litter biomass carbon (F=7.942; P=0.000). And post hoc test indicates that the mean comparison difference was significant at α of 0.05. On the other hand, in the other carbon pools there was no significant effect (Table 2).
| Parameter | Carbon pools | F- Value | P-Value |
|---|---|---|---|
| Slope Gradient | C.AGB | 2.645 | .078 |
| C.BGB | 2.645 | .078 | |
| C.LB | 7.942 | .000 | |
| C.DWDB | 1.843 | .166 | |
| C.OS | .894 | .413 |
Table 2: Summary of significant values of slope gradient carbon stock at each pool. Bold value is significant at the p
Forest carbon stocks along slope aspects variation: As shown in Table 3 below, the higher AGB and BGB carbon was computed in NE facing with total mean of 353.74 ± 44.7 ton ha-1 and 70.74 ± 8.94 ton ha-1 , respectively. The lower total means of AGB carbon (141.84 ± 33.93 ton ha-1 ) and BGB carbon (28.36 ± 6.78 ton ha-1 ) was estimated in SW facing. Even if they have a slight difference in leaf litter biomass carbon stock, the higher mean value was calculated in E and NE facing. On the other hand, the lower litter biomass carbon stock observed in S facing. The deadwood biomass carbon computed in S, E and NW direction and out of this the highest deadwood carbon stocks observed on S aspect with means of 14.64 ± 13.94 ton ha-1 . The lowest value observed on E aspect with means of 2.76 ± 2.38 ton ha-1 . The highest SOC stocks calculated in the E aspect with mean total of 240.66 ± 10.5 ton ha-1 . The lowest SOC stock calculated in SE aspect with the total means of 120.33 ± 7.83 ton ha-1 . The highest total carbon stock was calculated in E aspect with the mean total of 778.13 ± 75.93 ton ha-1 and the lower was calculated as SW aspect with means of 358.58±73.45 ton ha-1 . The total carbon stocks at each aspect ranks as follow: E > NE > N> W > NW > SE > S > SW. One way ANOVA table shows that aspect slope has significant effect on AGB and BGB carbon (F=3.157; P=.006). It also has significant effect on SOC pool (F=6.438; P=.000) and total carbon density (F=6.438; P=.000). And post hoc test was indicated that there was significant mean difference at α of 0.05. But in other carbon pool it does not show significant values (Table 4).
| Slope Aspect | plot | C.AGB | C.BGB | C.LB | C.DWDB | C.OS | Total Carbon |
|---|---|---|---|---|---|---|---|
| SW | 6 | 141.84 ± 33.9 | 28.36 ± 6.78 | 0.4 ± 0.09 | 0 | 127 ± 5.69 | 358.58 ± 73.45 |
| S | 5 | 192.03 ± 62.2 | 38.40 ± 212.4 | 0.33 ± 0.56 | 14.64 ± 13 | 176.2 ± 20.46 | 361.57 ± 49.62 |
| SE | 6 | 250.2 ± 74.39 | 50.03 ± 14.87 | 0.41 ± 0.05 | 0 | 120.33 ± 7.83 | 420.98 ± 89.74 |
| W | 11 | 203.34 ± 64.3 | 40.66 ± 12.86 | 0.39 ± 0.06 | 2.76 ± 2.38 | 182.81 ± 19.1 | 429.96 ± 74.46 |
| NW | 11 | 192.64 ± 63.7 | 38.53 ± 12.75 | 0.4 ± 0.006 | 6.76 ± 6.16 | 184.18 ± 12.9 | 421.64 ± 85.62 |
| N | 10 | 223.65 ± 67.3 | 44.73 ± 13.47 | 0.36 ± 0.05 | 0 | 198.7 ± 17.82 | 467.42 ± 78.38 |
| NE | 14 | 353.74 ± 44.7 | 70.74 ± 8.94 | 0.42 ± 0.007 | 0 | 178.57 ± 8.66 | 603.49 ± 50.71 |
| E | 12 | 224.78 ± 64.8 | 89.50 ± 12.97 | 0.43 ± 0.005 | 0 | 240.66 ± 10.5 | 778.13 ± 75.93 |
Table 3: Estimated carbon stock (ton ha-1) with different aspect at each carbon pools.
| Parameter | Carbon pools | F-Value | P-Value |
|---|---|---|---|
| Slope Aspect | C.AGB | 3.157 | .006 |
| C.BGB | 3.157 | .006 | |
| C.LB | 1.914 | .081 | |
| C.DWDB | 1.363 | .236 | |
| C.OS | 6.438 | .000 | |
| Total C. | 4.386 | .000 |
Table 4: Summary of significant value of slope aspect at different carbon pools. Bold value is significant at the p
Correlation of carbon stock with slope and slope aspect
i. Correlation of carbon stock with slope: As Table 5 shown below, It was observed that Slope shows inverse weak relationship with AGB and BGB carbon (R=-.292; P=.011) at α of 0.05. And similarly has weak inverse relation with deadwood biomass carbon pool (R=- 0.257; P=0 .026), litter biomass carbon (R=-232; P=0.04) and total carbon density (R=-.258; P=.0.26) at α of 0.05. And there was no significant correlation with SOC stock.
| Parameter | Carbon pools | R- Value | P-Value |
|---|---|---|---|
| Slope Gradient | C.AGB | -.292* | .011 |
| C.BGB | -.292* | .011 | |
| C.LB | -.232 | .04* | |
| C.DWDB | -.257* | .026 | |
| C.OS | -.167 | .153 | |
| Total C. | -.258* | .026 |
Table 5: correlation of each carbon pools with slope gradient. *. Correlation is significant at the 0.05 level (2-tailed).
ii. Correlation of carbon stock with slope aspect: It was observed that slope aspect shows significant positive correlation with AGB and BGB carbon (R=.340; P=.003) also with SOC pool (R=0.501; P=.000) and total carbon density (R=.427; P= .000) at α of 0.01. On the other hand, slope aspect does not show significant correlation with leaf litter biomass carbon pools and deadwood biomass carbon pool (Table 6).
| Parameter | Carbon pools | R- Value | P-Value |
|---|---|---|---|
| Slope Aspect Gradient | C.AGB | .340** | .003 |
| C.BGB | .340** | .003 | |
| C.LB | .127 | .276 | |
| C.DWDB | -.150 | .199 | |
| C.OS | .501** | .000 | |
| Total C. | .427** | .000 |
Table 6: correlation of each carbon pools with slope gradient.**. Correlation is significant at the 0.01 level (2-tailed).
Discussion
Carbon stock amount along environmental gradients: The present study revealed distinct pattern of variation of carbon stock in each pools although the variation has not significant difference except in litter biomass carbon. It has weak inverse relation with AGB, BGB, LB, DWD carbon and total carbon density of the forest. AGB carbon, BGB carbon and total carbon density trend shows decrease as slope class increases. Similar result was found by Adugna [16] study on Egdu forest. According to Maggi [17] Very steep slope areas contain little vegetation cover compared to low slope areas. On the other hand, study on Chilimo forest reported by Getu [18] revealed that AGB and BGB carbon tends to increase with slope. In this study, SOC also decreases as slope increases. Similar result was reported [16,19]. According to Barthes [20] Steep slope increase potential of material to move down and cause erosion, this idea also supported by Castillo-Santiago [21] soils that are found in steep slope are more vulnerable to erosion. Hancock [22] study on tropics forest of Australia found that vegetative biomass was a strong contributor to soil organic carbon concentrations. Therefore, the present study high SOC in lower slope class might be due to tree species diversity and canopy, litter fall accumulation and less erosion rate.
Litter biomass carbon show no smooth pattern, more in the middle slope and lower in the higher slope. The trend of leaf litter biomass carbon might be related with less accumulation of litter fall in steep slope due to canopy cover and slope character. High litter biomass carbon in the middle slope might be due to position of stand; middle slope area found just below undisturbed stand, which has good canopy cover. Thus, the litter fall from this stand goes down and accumulated at the bottom location. Slope aspect another topographic factors that induced microclimatic differences which could be an important factor for the significant variations in carbon stock of the forest. Aspect can have a strong influence on temperature. This is because aspect affects the angle of the sun rays. Due to the position of sun radiation, the seasonal cycle of climate differs between N and S facing slopes and between steep and gentle slopes [23,24]. In the present study, all carbon pools revealed various distributions within different slope aspect and it has significant effect and positive correlation with AGB and BGB carbon, SOC and total carbon density. Studies reported [24-28] reported that higher values of tree biomass and carbon stocks on N aspect and mostly S aspect is hotter and dryer. N facing slope has less sunlight and in turn has increased moisture levels and greater tree vegetation growth and cover resulting in more organic matter. On the other hand [18] reported that high AGB and BGB carbon found in E facing and the lowest was found in the N facing. In the present study, the highest AGB and BGB carbon observed on NE aspect and the lowest was on SW and S. This might be related to temperature, moisture availability and unequal solar radiation distribution in N and S aspect and as well as might be due to the presence of large biomass trees in north aspect because of favorable climatic condition and most of the north aspect was gentle and slightly sloppy area than south aspect. The deadwood biomass carbon shows high total mean in south aspect and lower in east aspect. This is may be due to the presence of more human disturbance in S slope aspect. Although Getu [18] found that higher litter fall in N aspect and lower in E aspect. The higher litter fall in S aspect and lower in N aspect was found [16,26]. The present study found that high litter fall biomass carbon found in E and NW aspect and lower amount was found in S facing. This might be related to the presence of tree species that produce more leaf foliage, favorable temperature and precipitation and low disturbances. Aspect has significant influence on SOC [27- 31]. This was similar to the present study which aspect show highly significant effect on SOC. Higher SOC was found E aspect which was similar of litter fall carbon pool and total carbon density and lowest SOC was found in SE and SW aspect. W and S facing slopes are generally warmer and E and N facing slope has lower temperature [32,33]. This could have an effect on organic matter turnover, photosynthesis and species composition. Since decomposition depends on temperature and moisture it results in variation of SOC stock. The probability for high soil carbon stock in E aspect might be due to climatic condition, litter fall accumulation, rate of decomposition and density of stems. Low SOC in S aspect mainly due to dry soil surface, hence less soil moisture and nutrient. This result has some similarity with Olsson [34] reported that low SOC in S aspect. Likewise it was also found high SOC in N aspect [16,26,28,32,35]. On contrary Misir [31] found more SOC in S aspect and lower in N aspect.
Conclusion
This study concludes that different environmental variables has tremendous role for the variation of carbon stock amount in the forest. Each carbon pool shows variation along these environmental gradients (slope and slope aspect). Slope aspect plays a key role in both aboveground and belowground carbon pool account. This is related with the distribution of productive stem density within the forest. Slope also has its own role especially in leaf litter biomass carbon storage. In general, Mountain forest mostly affects by environmental variables due to change in species structure and composition.
References
- IPCC(2007) Synthesis Report. 52 p. Fourth Assessment Report. Both of these IPCC publications synthesize information from all Working Groups: WG I--The Physical Science Basis; WG II--Impacts, Adaptation, and Vulnerability; WG III-- Mitigation of Climate Change.
- Yitebitu M, Zewdu E, Sisay N(2010) A review on Ethiopian Forest Resources: current status and future management options in view of access to carbon finances. Preparedfor the Ethiopian climate research and networking and the United Nations development programmer (UNDP). Addis Ababa, Ethiopia.
- Brown S (1997) Estimating biomass and biomass change of tropical forests:A primer Rome, Italy, Food and Agriculture Organization of the United Nations (FAO).
- Sisay N, Menale K, Mungatana E(2009)Forestry Resource Accounting: The Experience of Ethiopia. In Proceedings ofthe National Workshop on Sustainable Land Management and Poverty Alleviation. Addis Ababa: Ethiopia.
- Gibbs HK, Brown S(2007) Geographical distribution of woody biomass carbon stocks in tropical Africa: an updated database for 2000.
- Kumar S, Kumar M, Sheikh AM(2012) Carbon Stock Variation of PinusroxburghiiSarg. Forest along Altitudes of Garhwal Himalaya, India. Russian J Ecol 44: 131-136.
- EndalewAmenu (2007) Use and management of medicinal plants by indigenous people of Ejajiarea (CheliyaWoreda) West Shoa, Ethiopia: an ethnobotanical approach. Unpublished M.Sc. Thesis, Addis Ababa University, Addis Ababa.
- Young SS, Wang CY(2001) Land-cover change analysis of China using global-scale Pathfinder AVHRR Landcover (PAL) data, 1982-92. IntJ Remote Sensing 22: 1457-1477.
- Birhanu K(2010) Case study on Floristic Composition and Structural Analysis of Gedo Dry Evergreen Montane Forest, West Shewa Zone of Oromia National Regional State, Central Ethiopia. Unpblished MSc. thesis, Addis Ababa University.
- BhishmaPS, Shiva SP, AjayP, EakBR, Sanjeeb B (2010) Forest Carbon Stock Measurement: Guidelines for measuring carbon stocks in community-managed forests. Funded by Norwegian Agency for Development Cooperation (NORAD). Asia Network for Sustainable Agriculture and Bioresources (ANSAB) publishing, Kathmandu, Nepal pp:17-43.
- Pearson TR, Walker S, Brown S(2005) Sourcebook for land-use, land-use change and forestry projects. Winrock International and the Bio-carbon fund of the World Bank. Arlington, USA pp: 19-35.
- MacDicken KG(1997) A Guide to Monitoring Carbon Storage in Forestry and Agro-forestry Projects. In Forest Carbon Monitoring Program. Winrock International Institute for Agricultural Development, Arlington, Virginia.
- Hairiah K, Sitompul SM, Noordwijk M, Palm C(2001) Methods for sampling carbon stocks above and below ground. International Centre for Research in Agroforestry. Southeast Asian Regional Research Programme, Bogor, Indonesiapp: 10-15.
- IPCC (Intergovernmental Panel for Climate Change) (2006) Good practice guidelines for National Greenhouse gas inventories. Switzerland: Intergovernmental panel on climate change. Unpublished document.
- Pearson TR, Brown SL, Birdsey RA(2007) Measurement guidelines for the sequestration of forest carbon. Northern research Station, Department of Agriculture, Washington, D.Cpp: 6-15.
- Adugna F, Teshome S, Mekuria A (2013)Forest Carbon Stocks and Variations along Altitudinal Gradients in Egdu Forest: Implications of Managing Forests for Climate Change Mitigation.J STAR2: 40-46.
- Maggi O, Persiani MA, Casado MA, Pineda FD(2005) Effects of elevation, slope position and livestock exclusion on microfungi isolated from soils of Mediterranean grasslands. The Mycological Soc America, Lawrence. Mycologia 97: 984-995.
- Getu S (2012) Carbon stocks in different pools in natural and plantation forests of Chilimo, central highland of Ethiopia. Unpublished M.Sc thesis, Addis Ababa University. Addis Ababa.
- Güner ST, Çömez A, Özkan K (2012) Predicting soil and forest floor carbon stocks in Western Anatolian Scots pine stands, Turkey. African J Agri Res 7: 4075-4083.
- Barthes B, RooseE(2002) Aggregate stability as an indicator of soil susceptibility to runoff and erosion, validation at several levels. J Catena 47: 133-149.
- Castillo-Santiago MA, Hellier A, Tipper R, De Jong BHJ (2003)Carbon emissions from land-use change: an analysis of causal factors in chiapas, Mexico. Mitigation and Adaptation Strategies for Global Change 12: 1-30.
- Hancock GR, Murphy D, Evans KG (2010)Hillslope and catchment scale soil organic carbon concentration: An assessment of the role of geomorphology and soil erosion in an undisturbed environment. J Geoderma 155:36-45.
- ByramGM, JbmisonGM(1943) Solar Radiation and Forest fuel moisture. J Agri Res 67: 149-170.
- Bayat AT(2011) Carbon stock in an Apennine Beach forest. Msc. Thesis, Geo-information science and earth observation, University of Twente. Enschede, Netherlands.
- Beatty SW(1993) Study of soil properties along a hillslope in parson's parcel bouldeb, co. Department of Geography University of Colorado Boulder.
- Shrestha BP(2009) Carbon Sequestration in Schima-Castanopsis Forest: A Case Study from Palpa District. J Environ Biodiversity 7:34-40.
- Griffiths RP, Madritch MD, Swanson AK(2009) The effects of topography on forest soil characteristics in the Oregon Cascade Mountains (USA): Implications for the effects of climate change on soil properties. J Forest Ecology and Management 257: 1-7.
- Sharma CM, Gairola S, Baduni NP, Ghildiyal SK, Suyal S(2011) Variation in carbon stocks on different slope aspects in seven major forest types of temperate region of Garhwal Himalaya, India. J Biosci 36: 701-708.
- Garcia-Pausas J, Casals P,Camarero L(2007) Soil organic carbon storage in mountain grasslands of the Pyrenees: Effects of climate and topography. J Biogeochemistry 82: 279-289.
- Fantaw Y (2007) Soil Properties in Relation to Topographic Aspects, Vegetation Communities and Land Use in the South-eastern Highlands of Ethiopia. Doctoral thesis. Swedish University of Agricultural Sciences: Uppsala.
- Misir M, Misir N (2013) Root biomass and carbon storage for FagusorientalisLipsky. (Northeastern Anatolia). Int J Education Res 1: 1-8.
- Branch O(2010) Assessing Soil Carbon Stocks in the Mae Sa Noi Sub-watershed. Msc. thesis. Matriculation number: 458652, University of Hohenheim.
- Davis VB, Rathfon JA, Zipper R, Miller CE (2012) Selecting tree species for reforestation of appalachian mined land. Forest Reclamation Advisory No.
- Olsson MT, Erlandsson E, Lundin L, Nilsson T, Nilsson A (2009) Organic Carbon Stocks in Swedish Podzol Soils in Relation to Soil Hydrology and Other Site Characteristics. Silva Fennica research articles 43: 209-222.
- Kane ES, Kasischke ES, Valentine DW, Turetsky MR, McGuire AD(2007) Topographic influences on wildfire consumption of soil organic carbon in interior Alaska: Implications for black carbon accumulation. J geophysical Res112: 1-11.
Citation: Yohannes H, Soromessa T, Argaw M (2015) Carbon Stock Analysis along Slope and Slope Aspect Gradient in Gedo Forest: Implications for Climate Change Mitigation. J Earth Sci Clim Change. 6: 305. DOI: 10.4172/2157-7617.1000305
Copyright: © 2015 Yohannes H, et al. This is an open-access article distributed under the terms of the Creative Commons Attribution License, which permits unrestricted use, distribution, and reproduction in any medium, provided the original author and source are credited.
Select your language of interest to view the total content in your interested language
Share This Article
Recommended Journals
Open Access Journals
Article Tools
Article Usage
- Total views: 14766
- [From(publication date): 11-2015 - Aug 29, 2025]
- Breakdown by view type
- HTML page views: 13595
- PDF downloads: 1171