Dynamics of Costs, Returns and Prices of Paddy in Assam, India
Received: 02-May-2019 / Accepted Date: 30-Jun-2019 / Published Date: 08-Jul-2019
Abstract
Assam, an easternmost state of India has an agrarian economy with paddy as the principal crop occupying 60.87% of the cropped area. Paddy is mostly grown as rainfed crop in the state having only 15% paddy area under irrigation. Though some micro level study shows positive net return for paddy production, however, macro level data observation depicts negative net return for paddy. Still, farmers continue to cultivate paddy as it is the staple crop for the state. As no concrete analysis had been done on cost of production of paddy at the state level, an attempt has been made in this paper to understand the status and level of inputs used, costs and return from cultivation of paddy, its price in Assam based on data published by Directorate of Economics and Statistics, Government of India. The study found that the growth rate of yield per annum was low compared to cost of production and cost of cultivation. The yield could be enhanced by increasing the use of various strategic inputs up to the recommended level. Amongst all the inputs, human labour contributes higher percentage to cost of cultivation. Farmers were selling their paddy at a much lower rate than that offered by government through minimum support price (MSP) which might be due to distressed sale in the state. The study suggests replacing bullock labour by machine labour to reduce cost of cultivation at the state level. Recommended technology should be followed by the paddy growers to increase the yield that would result in higher gross and net return. Further, it could be suggested that government procurement agencies such as Food Corporation of India should buy the paddy from the farmers at MSP so that farmers’ net return become positive.
Keywords: Cost of cultivation; Net returns; Minimum support price; Paddy; Food Corporation of India; Assam
Introduction
Assam is the easternmost state of India having agriculture as the primary sector with 75% of population of the state depending directly or indirectly on agriculture. Agriculture sector provides employment to more than 50% of its total workforce. Paddy occupies the major portion in the cropping pattern with 60.87% and 87.90% share to gross cropped area and net sown area of the state [1]. There are broadly, three types of paddy based on their harvesting season in Assam namely autumn, winter and summer paddy. Winter paddy is the main paddy crop in the state with 76.02% share to the total paddy area. The yield of total paddy was lower (2061.67 kg/ha) than the national average of 2823.50 kg/ha during 2016-17 [2] which is mainly attributed to partial adoption of the recommended package of practice. The farmers are growing paddy despite of gradual increase in the input price considering it to be the staple crop. Information on cost of cultivation is essential for efficient allocation of farmer’s scarce resources and in determining their cropping pattern [3]. The data on cost of cultivation is essential for making production decisions and can help in planning of future production. Moreover, these data are used by the states and central government to fix floor support prices and minimum support price for agricultural commodities. Minimum support price protects both producer and consumer with the assurance that prices of their commodities would not be allowed to fall below the level fixed by the government even in the case of bumper production [4]. In Assam, some micro level study showed paddy to be remunerative crop in the state however, no macro level study had been carried out in details on the input use pattern and cost of production of paddy so far. Therefore, the present paper attempted to study the status and level of inputs used, cost and return from cultivation of paddy in Assam.
Materials and Methods
The study has been carried out using the time series secondary data which were collected from Directorate of Economics and Statistics, Government of India and other published sources. The data cover state level area, production, productivity, cost of cultivation and cost of production of total paddy for the period of one decade i.e. 2006-07 to 2015-16. As paddy is grown mostly as rainfed crop, the data do not have information on irrigation used. Different analytical tools used in the study are discussed below.
Dynamics of cost of cultivation
Relative Change={(Current Year-Base Year)/Base Year} × 100
Where, Base Year=Triennial average of area, production, productivity, cost and profitability of crops considered from year 2006- 2007 to 2008-2009
Current Year=Triennial average of area, production, productivity, cost and profitability of crops considered from year 2013-2014 to 2015- 2016
Measurement of trend
Y=(ab)t
Where, Y=Time series data of area, production, yield, cost and profitability of crops considered
t=time period (year 2006-2007 to 2015-2016)
a=intercept
b=regression coefficient (slope)
Compound Growth Rate (CGR)
CGR=(Antilog of b-1) × 100 [5]
Measurement of variability
Coefficient of Variation=(Standard deviation/Mean) × 100
Degree of relationship
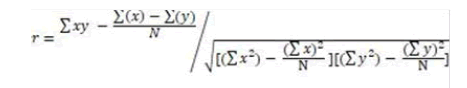
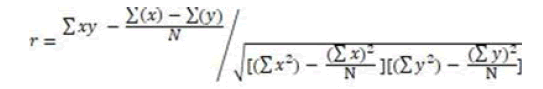
Relationship between variables was measured by correlation coefficient (r) where,
Cost concepts: Various cost concepts such as Cost A1, Cost A2, Cost B1, Cost B2, Cost C1, Cost C2, and Cost C3 were used as defined by Commission for Agricultural Costs and Prices (Annexure I).
Income measures
Gross income=(Yield of paddy × Price)+(By product × Price)
Net Income=Gross Income–Cost C3
Results and Discussion
Area, production and productivity of paddy in Assam (Annexure II) for the period considered (Figure 1) along with trend is represented in Table 1. The compound growth rate for area was found to be positive (0.29) but not significant depicting that there has been a gradual increase in area under paddy. The coefficient of variation value (2.64) also reflects that there was not much variation in area under the crop. However, for both production and yield, the compound growth rates were found to be positive and highly significant depicting that both yield and production of paddy during the decade has increased rapidly. Sharma and Sharma [6] have reported improvement in area, production and productivity of summer rice over Sali and Ahu rice. The yield increase might be contribute to adoption of high yielding and hybrid varieties of rice of late coupled with increased use of fertilizer and irrigation water. Further, the government initiatives such as National Food Security Mission [7], Bringing Green Revolution to Eastern India, etc. focused mainly in increasing the productivity of rice. Pathok et al. [8] observed that Bringing Green Revolution to Eastern India programme showed direct positive impact on cropping intensity, productivity, production and income of the paddy farmers of Assam. Both production and yield showed medium level of variability.

Figure 1: Trends in area, production and productivity in Assam (2006-2007 to 2015-2016).
| Particulars | Area (ha) | Production (tonnes) | Yield (kg/ha) |
|---|---|---|---|
| Relative Change (%) | 2.48 | 24.25 | 22.2 |
| CGR (%) | 0.29 | 4.38** | 4.15*** |
| Coefficient of Variation (%) | 2.64 | 14.21 | 13.04 |
| *Significant at 10%, **Significant at 5%, ***Significant at 1% PL | |||
Table 1: Trends in area, production and yield in Assam (2006-2007 to 2015-2016). Source: Author’s calculation based on data of Directorate of Economics and Statistics, Government of India.
Table 2 shows the quantity of various input used in paddy cultivation in physical terms. It was observed that the quantity of seeds used over the years was below the recommended dose for Assam i.e. 100 kg/ha for broadcasting and 75 kg/ha for line sowing. Though the use of fertilizer and manure (21.76 kg/ha and 5.45 quintal/ha during 2015-2016) has been increasing over the years, but it was still below than the recommended dose (i.e. 93 kg/ha fertilizers and 100-150 quintal/ha manure) for the state. The highest compound growth rate of inputs used per hectare was found in fertilizer (10.41 per cent) followed by manure (2.54 per cent), whereas the use of seeds (-1.16 per cent), human labour (-0.67 per cent) and bullock labour (-5.27 per cent) showed a negative growth over the years. Uses of modern technological inputs and implements have recorded a very slow pace [9]. For fertilizer and manure, there was gradual increase in the amount use that reflected a higher growth. However, for seed the use has further
| Year | Seed (Kg/ha) | Fertilizers (Kg/ha) | Manure (Quintal/ha) | Human labour (MD/ha) | Bullock labour (Pair Days/ha) |
|---|---|---|---|---|---|
| 2006-2007 | 67.16 | 10.17 | 4.72 | 86.04 | 30.58 |
| 2007-2008 | 64.14 | 10.75 | 5.71 | 88.21 | 31.35 |
| 2008-2009 | 63.22 | 8.95 | 3.55 | 89.35 | 27.33 |
| 2009-2010 | 64.62 | 12.61 | 3.67 | 84.78 | 25.63 |
| 2010-2011 | 62.2 | 15.67 | 4.59 | 86.63 | 25.06 |
| 2011-2012 | 60.98 | 16.6 | 5.53 | 83.79 | 23.14 |
| 2012-2013 | 58.43 | 16.04 | 6.03 | 84.42 | 23.33 |
| 2013-2014 | 58.02 | 16.66 | 5.17 | 82.32 | 21.04 |
| 2014-2015 | 61.8 | 23.96 | 5.16 | 85.19 | 20.22 |
| 2015-2016 | 60.62 | 21.76 | 5.45 | 82.18 | 19.18 |
| Relative Change (%) | -7.24 | 108.83 | 12.88 | -5.28 | -32.29 |
| CGR (%) | -1.16** | 10.41*** | 2.54 | -0.67* | -5.27*** |
| CVariation (%) | 4.52 | 31.95 | 16.74 | 2.74 | 16.81 |
| *Significant at 10%, **Significant at 5%, ***Significant at 1% PL | |||||
Table 2: Trends in quantity of inputs used for per hectare. Source: Author’s calculation based on data of Directorate of Economics and Statistics, Government of India.

Figure 2: Value of inputs used (INR/ha) during 2006-2007 to 2015-2016.
decreased as the paddy farmers might have reduced the seed rate due to rising seed price. With gradual increase of machine labour, both human labor and bullock labour use has started to decline over the decade. The coefficient of variation (CV%) was found to be the highest in fertilizer use which is attributed to increase use over the years.
The value of inputs used (INR/ha, Annexure III) is represented in Figure 2 and their trend is presented in Table 3. During the period from 2006-2007 to 2015-2016, the value of seeds, human labour and bullock labour had increased due to increase in prices per unit over the years. The value of fertilizers and manures increased due to increase in both the quantity and price per unit. The value of machine labour also increased over the years during the decade due to increase in price per unit. Over the years, the human labour cost shared the highest portion to the total cost. Devi and Ponnarasi [10] also reported that human labour cost has the highest share in rice cultivation. The compound growth rate of machine labour (41.88%) was highest among all the inputs used and seed (7.35%) showed the lowest compound growth rate. The highest fluctuation was observed in machine labour (82.22%) and the least for seeds (22.36%). High fluctuation might be attributed to replacement of bullock labour in successive years by machines.
| Particulars | Seed | Fertilizer | Manure | Human labour | Bullock labour | Machine labour |
|---|---|---|---|---|---|---|
| Relative Change (%) | 65.51 | 284.37 | 166.56 | 172.52 | 153.4 | 731.57 |
| CGR (%) | 7.35*** | 20.64*** | 16.22*** | 15.54*** | 13.85*** | 41.88* |
| CV (%) | 22.36 | 55.5 | 47.9 | 42.18 | 42.68 | 82.22 |
| *Significant at 10%, **Significant at 5%, ***Significant at 1% PL | ||||||
Table 3: Trend of inputs used in (INR/ha). Source: Author’s calculation based on data of Directorate of Economics and Statistics, Government of India.
Cost of cultivation, cost of production, yield and gross income per hectare of paddy in Assam is given in Table 4. The cost of cultivation and cost of production had increased over the years due to higher cost of inputs which is common rather than exception. Yield and gross income also increased over the years. Increase in yield might be attributed to increase use of manures and fertilizers and hence, there was increase in gross income coupled with increase in price level. But the increase in yield (41.07%) and gross income (126.39%) were less as compared to increase in cost of production (82.68%) and cost of cultivation (167.25%) for the decade. It is obvious that the growth of both cost of cultivation per hectare and cost of production per quintal of paddy had shown significant growth over the years due to rise in prices of the strategic inputs used. However, the growth in cost of cultivation was higher (15.06%) than that of cost of production (8.59%) as there was significant growth in the yield of paddy (5.70%) over the years. The positive significant growth in yield of paddy in the state could be attributed to use of high yielding and hybrid variety supported by different schemes of both central and state government. Further, increased use of fertilizer and manure also contributed to enhanced yield. There is gradual increase of irrigated paddy area in the state, which could be another factor contributing to increased yield. Bhowmick et al. [11] reported that introduction of new technology contributed towards the increase in paddy yield in Assam.
| Year | Cost of cultivation (INR/ha) |
Cost of production (INR/Quintal) |
Yield (Quintal/ha) |
Gross income (INR/ha) |
Net income (INR/ha) |
||
|---|---|---|---|---|---|---|---|
| Cost A2 | Cost C3 | Cost A2 | Cost C3 | ||||
| 2006-2007 | 6539.43 | 16675.15 | 373.21 | 938.04 | 16.71 | 11675.31 | -4999.84 |
| 2007-2008 | 7388.27 | 18778.6 | 273.87 | 696.69 | 25.38 | 17441.56 | -1337.04 |
| 2008-2009 | 8890.14 | 22784.3 | 313.62 | 804.55 | 26.75 | 20537.76 | -2246.54 |
| 2009-2010 | 9792.43 | 25049.23 | 354.94 | 910.35 | 25.83 | 21752.7 | -3296.53 |
| 2010-2011 | 11621.46 | 28630.12 | 367.85 | 911.69 | 29.58 | 26465.59 | -2164.53 |
| 2011-2012 | 12543.51 | 31873.95 | 430.31 | 1099.74 | 26.51 | 19261.68 | -12612.3 |
| 2012-2013 | 14399.05 | 38174.55 | 423.74 | 1121.59 | 31.41 | 25577.62 | -12596.9 |
| 2013-2014 | 17650.74 | 44736.27 | 516.8 | 1310 | 31.84 | 38284.42 | -6451.85 |
| 2014-2015 | 21774.96 | 55329.79 | 625.82 | 1583.79 | 32.45 | 36819 | -18510.8 |
| 2015-2016 | 21652.82 | 55577.94 | 608.78 | 1562.2 | 32.82 | 37309.8 | -18268.1 |
| Relative Change (%) | 167.68 | 167.25 | 82.3 | 82.68 | 41.07 | 126.39 | 403.65 |
| CGR (%) | 14.96*** | 15.06*** | 8.44*** | 8.59*** | 5.70** | 12.18*** | 1111.04** |
| CV (%) | 41.98 | 42.16 | 27.86 | 27.92 | 17.49 | 36.15 | -81.1 |
| *Significant at 10%, **Significant at 5%, ***Significant at 1% PL | |||||||
Table 4: Cost of cultivation, cost of production, yield, gross income and net income in Assam (per hectare). Source: Author’s calculation based on data of Directorate of Economics and Statistics, Government of India.
Though there was positive significant compound growth in gross income (12.18), it was lower than the growth in cost of cultivation (15.06), showing that farmers are getting less than what they are spending for paddy cultivation. The net income was recorded to be negative throughout the year 2006-2007 to 2015-2016 revealing that paddy cultivation is non-remunerative to the paddy growers of the state. Further the net income was found to vary at a high rate (81.10) with very high growth rate showing an alarming negative net return.
| Year | Net selling price (INR/Quintal) | Cost of production (A2+FL) (INR/Quintal) | MSP (INR/Quintal) | Difference between net selling price and cost of production | Difference between net selling price and MSP | Difference between MSP and cost of production |
|---|---|---|---|---|---|---|
| 2006-2007 | 656 | 664.8 | 580 | -ve | +ve | -ve |
| 2007-2008 | 647 | 474.59 | 850 | +ve | -ve | +ve |
| 2008-2009 | 725 | 531.85 | 850 | +ve | -ve | +ve |
| 2009-2010 | 792 | 609.69 | 950 | +ve | -ve | +ve |
| 2010-2011 | 844 | 616.19 | 1000 | +ve | -ve | +ve |
| 2011-2012 | 665 | 801.42 | 1080 | -ve | -ve | +ve |
| 2012-2013 | 752 | 818.56 | 1250 | -ve | -ve | +ve |
| 2013-2014 | 1004 | 935.56 | 1310 | +ve | -ve | +ve |
| 2014-2015 | 1054 | 1107.78 | 1360 | -ve | -ve | +ve |
| 2015-2016 | 1049 | 1089.51 | 1410 | -ve | -ve | +ve |
Table 5: Differences between cost of production and MS price in Assam (2006-2007 to 2015-2016). Source: Author’s calculation based on data of Directorate of Economics and Statistics, Government of India.
Table 5 indicates comparison between net selling price, cost of production, and MSP of paddy in Assam (2006-2007 to 2015-2016). As MSP is based on cost A2 plus family labour, for the comparison analysis, cost A2 plus family labour was considered. It was observed that there was irregular trend in the difference between net selling price and cost of production per quintal of paddy in the state. Net selling price was able to cover the cost of production for the year 2007-2008 to 2010-2011 and 2013-2014 showing that farmers were able to get some profit for paddy production. However for the years, 2006-2007, 2011- 2012, 2012-2013, 2014-2015 and 2015-2016 the farmers had to face loss from production of paddy. A comparison between net selling price and MSP showed that the farmers were selling their paddy at a much lower rate than offered by government through MSP which might be due to distressed sale in the state. Except the beginning year of the decade (2006-2007), Minimum Support Price was found to cover the cost of production comfortably which shows that government has declared the right MSP for paddy in the state that was able to safe guard the paddy growers. However, some spurious middlemen might have taken advantage of the poor economic condition of the paddy cultivators and bought their paddy at a much lower rate than that of MSP.
| Parameters | Cost of production (C2+FL) (INR/ha) |
Net income (INR/ha) |
MSP (INR/Quintal) |
|---|---|---|---|
| Yield (Quintal/hectare) | 0.63** | -0.54 | 0.93*** |
| Cost of production (C2+FL) (INR/Quintal) |
- | -0.91*** | 0.84*** |
| Net income (INR/ha) | - | - | -0.76*** |
| **Significance at 5%, ***Significance at 1% PL | |||
Table 6: Relation between yield, cost of production, net income and MSP of paddy in Assam (2006-2007 to 2015-2016). Source: Author’s calculation based on data of Directorate of Economics and Statistics, Government of India.
Table 6 shows relation between yield, cost of production, net income and MSP of paddy in Assam during 2006-2007 to 2015-2016. Value of correlation coefficient between yield and cost of production indicates average correlation (0.63) revealing that with increase in cost of production yield increases and vice versa. The value of correlation coefficient between yield and net income was found to be -0.54 which was due to increase in cost of cultivation. The relation between yield and MSP was found to be highly positive i.e. 0.93. Cost of production and net income had negative relation which is common phenomena revealing inverse relationship between cost and return. The net income and MSP was found to have negative correlation (-0.76) showing that, the paddy growers had not received the MSP declared by the government.
The correlation between yield obtained and input used per hectare of paddy cultivation is given in Annexure IV. It was observed that for the present level of yield obtained seed, bullock labour and human labour were more than required whereas there was ample scope to increase the level of fertilizer and manure used.
Conclusion
It was observed that for the present level of yield obtained seed, bullock labour and human labour used were more than required whereas there was ample scope to increase the level of fertilizer and manure used. At the state level, the scarce inputs were not used optimally and efficiently. The study concludes that the inputs like seeds, fertilizers, manures, etc should be used as per recommended package of practices to obtain optimum yield which will ensure the farmers a positive net income. As human labour cost accounted for the major portion of the total cost, effort should be made to replace human labour by machine labour that would reduce the labour cost. Custom hiring of farm machineries such as tractors and power tillers might help in this regard. The area under high yielding and hybrid variety of paddy might help to increase the yield level. Similarly, more paddy area should be brought under irrigation with use of proper dose of fertilizer. The paddy growers could be encouraged to form some growers’ societies so that their products could be bought by government agencies in bulk at MSP. The paddy growers have to be motivated and aware about the schemes meant for paddy development in the state. Government should ensure proper adequate and timely supply of crucial inputs especially seeds, fertilizers, manures, etc.
References
- Directorate of Economics and Statistics, Department of Agriculture Cooperation and Farmers Welfare, Ministry of Agriculture and Farmers Welfare, Government of India.
- John J (2016) Area changes to cost of cultivation of selected crops in Kerela. Int J Econ Comm Res 6: 1-6.
- Kumbhar VM (2011) Impact of MSP on Area under cultivation and level of production: A study of selected crops in India. SSRN Electronic J 1: 35-43.
- Dandekar VM (1980) Introduction to seminar on data base methodology for the study of growth rates in agriculture. Indian J Agri Econ 35: 1-12.
- Sharma BK, Sharma HK (2015) Status of Rice Production in Assam, India. J Rice Res 3:e121.
- Savapandit R, Kakaty G (2015) Impact of National Food Security Mission (NFSM) on input use, production, productivity and income in Assam. Report of Agro Economic Research Centre (AERC) for North East India, Assam, pp 1-94.
- Pathok P, Gogoi PB, Hazarika JP, Deka N (2018) Impact Assessment of BGREI Programme on Cropping Intensity, Production, Productivity and Income of Farmers in Assam. Indian J Econ Dev 14: 559-563.
- De UK, Bodosa K (2014) Crop Diversification in Assam and Use of Modern Inputs under Changing Climatic Condition. J Climatol Weather Forecast 2: 1-14.
- Devi SK, Ponnarasi T (2009) An economic analysis of modern rice production technology and its adoption behaviour in Tamil Nadu. Agri Econ Res Rev 22: 341-347.
- Barah BC, Betne R, Bhowmick BC (2001) Status of rice production system in Assam: A research perspective. Paper presented at the Fourth Workshop of the NATP Project RRPS2 Socio-Economic Dynamics of Rice in eastern India†at the Central Rice Research Institute Cuttack, India.
Citation: Pathok P, Deka N (2019) Dynamics of Costs, Returns and Prices of Paddy in Assam, India. J Rice Res 7: 211.
Copyright: © 2019 Pathok P, et al. This is an open-access article distributed under the terms of the Creative Commons Attribution License, which permits unrestricted use, distribution, and reproduction in any medium, provided the original author and source are credited.
Select your language of interest to view the total content in your interested language
Share This Article
Recommended Journals
Open Access Journals
Article Usage
- Total views: 6782
- [From(publication date): 0-2019 - Dec 20, 2025]
- Breakdown by view type
- HTML page views: 5759
- PDF downloads: 1023