Research Article Open Access
Economic Valuation of Recreation Use Value of Kilimanjaro National Park, Tanzania
Zella Adili Y1* and Ngunyali Robert H2
1Department of Economic Studies, The Mwalimu Nyerere Memorial Academy (MNMA), Zanzibar, Tanzania
2Selous Game Reserve, Wildlife Division, The Ministry of Natural Resources and Tourism, Dar es Salaam, Tanzania
- *Corresponding Author:
- Zella Adili Y
Department of Economic Studies
The Mwalimu Nyerere Memorial Academy (MNMA)
Zanzibar, Tanzania
Tel: 5242250315
E-mail: zellahadil@gmail.com
Received Date: November 08, 2016 Accepted Date: December 13, 2016 Published Date: December 23, 2016
Citation: Zella Adili Y, Ngunyali Robert H (2016) Economic Valuation of Recreation Use Value of Kilimanjaro National Park, Tanzania. J Ecosys Ecograph 6: 220. doi:10.4172/2157-7625.1000220
Copyright: © 2016 Zella Adili Y, et al. This is an open-access article distributed under the terms of the Creative Commons Attribution License, which permits unrestricted use, distribution, and reproduction in any medium, provided the original author and source are credited.
Visit for more related articles at Journal of Ecosystem & Ecography
Abstract
Tanzanian authorities managing environmental resources/service have made an effort to set the fees to access their resources but still there is scanty information on the pricing strategy that consider both the value of the resource and the consumer perception on quality of services which results to the management failure to predict the future impact of price/fees changes to the number of tourists visitors’ per year, visitation rate and the total recreation value of their resources. This study focused on using Travel Cost Method to value recreation in KINAPA. Data were collected using questionnaire survey, key informants interviews and secondary materials. The questionnaire used for survey was designed to capture socio - demographic variables about visitors, travel cost component variable and data on visitors perception on the quality of services provided during a visit to KINAPA. With the sample size of 384, the count data that were generated from survey was modeled with Poisson model. Based on this econometric results Consumer Surplus per day of stay in the park was 925 182 TZS (USD 571.10), the mean visitor Willingness to Pay was per one day of a visit is 837 280.80 TZS (USD 516.84), the total recreation value of the park was estimated to be 314 165 955 200 TZS (USD 193 929 602) per one calendar year and the revenue maximizing entry fee for the park was estimated to be 90 396 TZS (USD 55.8). Moreover the finding indicates that variables such as travel costs, available recreation income, age, employment status and the quality perception were significant and have an influence on the number of days a visitor stay in the park. More economic valuation research on recreation use value is recommended to other National Parks since clear understanding of the value of existing natural resource trigger the proper management and allocation of resource.
Keywords
Environmental resources; Recreational use value; Consumer surplus
Introduction
Background information: Tanzania is among the East African countries gifted with numerous ecological protected areas grouped into six categories that vary according to the degree of protection offered to the land and wildlife. These categories, in order of greatest to least protection are: National Parks (NP), Game Reserves (GR), the Ngorongoro Conservation Area (CA), Game Controlled Areas (GCA), Partial Game Reserves (PGR) and Forest Reserves (FR). Three of these areas have been designated as Biosphere Reserves and six are World Heritage Sites, indicating that these sites have unique ecosystems important not only to Tanzania, but to the world [1].
These recreation sites provide wide range of opportunities for recreation activities such as hunting, hiking, canoeing, wildlife viewing, bird watching; mountain hiking, camping, walking safari’s associated with photographic tourism. Tanzania is famous for many beautiful National Parks, the special natural ecosystems set aside by the nation as a place where visitors are allowed into for recreation activities, research and education purpose. It has dedicated more than 42,000 square kilometers to 16 national parks including Kilimanjaro National Park (KINAPA). The areas have been set aside to preserve the country’s rich natural heritage, to provide secure breeding grounds where its fauna and flora can thrive, safe from the conflicting interests of a growing human population [2] and they are protected as an economic asset for future generation.
National parks beside from its primary role of conservation they provides valuable revenue used to support wildlife research, education, livelihood of local communities nearby the parks and helps to generate international awareness of conservation issues [3]. Gregg reported that from 1989, the Tanzanian government cut all subsidies to TANAPA, requiring this parastatal organization to develop its own sources of funding to cover the annual costs of managing the national parks system. This circumstance made the primary source of TANAPA’s funding to be user fees, including gate receipts and overnight accommodation charges. Therefore to ensure independent and sustainable management of these national parks, its value have to be quantified, and satisfactory user fees (conservation fees) have to be set so that the park annual revenue increase at the same time management being confident of maintain reasonable visitation rate.
Economic valuation of environmental goods or services is an important tool for public policy making and has become an important source of information which helps to provides estimate of the recreation use value of a national park and plays a crucial role in many areas of marketing management like pricing decisions [4,5]. Economic valuation methods frequently involve two approaches based on individual preference in valuation of environmental good or services. The approaches are specifically revealed preference and stated preference.
Travel cost method is one among of the revealed preference techniques. OECD and Lusambo [6,7] reported that travel cost method is an important technique of evaluating demand for recreation facilities and it have improved considerably since the earliest studies were carried out both from an empirical and theoretical point of view. The method is likely to work best when applied to the valuation of a single site and it is limited use for valuing anything other than recreation sites and fascinating species that provoke travel behavior. Thus the most credible application to date has involved local and international travel behaviour of visiting recreation sites such as national park [6].
Problem statement: Thorough literature search reveal that in Africa particularly Tanzania, the authority managing environmental resources/service have made an effort to set the fees to access their resource but still there is scanty information on the pricing strategy that consider both the value of the resource and reflective understanding of consumer behavior specifically the consumer perception on quality of services which results to the management failure to predict the future impact of price/fees changes to the number of tourists visitor’s per year, visitation rate (number of days spent by a visitor per trip) and the total recreation value of their resources. This is underpinned by a number of studies: Breidert [5] emphasize that the established price for good or service may not reflect the real value of the resource and mostly happen as an outcome of making pricing decisions without a profound consideration of the likely response of potential consumers to alternative prices. As a result of missing adequate knowledge of the customer’s willingness to pay (WTP) for their products (in this case environmental resources), the organization fail to pursue a pricing strategy that is suitably customized to their marketing environment and thus also risk ignoring valuable sources for increasing profitability of the service offered; Marn [8] enlighten that different practical studies have shown that minor variations of prices and the corresponding consumer behavior can have notable effect on revenues and profit.
Furthermore some of studies still reveal the existence of setback in pricing strategy. Krug [9] argued that most studies of nature tourism in Africa identify large enraptured values in the form of consumer surplus (foreign tourists consumer surplus exceeds local consumer surplus significantly) mostly due low park fees for foreign tourists relative to their average income and because foreign tourists outweigh domestic visitors in numbers. On the other hand Honey and Fitzpatrick [10,11] clarify that travel in East Africa is considerably more expensive than Asia, India or South America where Tanzania is generally considered as the most expensive country in the region for travel especially around the northern circuit parks.
Therefore this study was carried out to estimate recreation use value of KINAPA, examine the consequence of change in access fee structure on demand of visitors to the park and reveal visitors’ perception on the quality of the services provided by Kilimanjaro National Park so as to fill the existing gap. The findings of this study will serve as environmental management tool for: raising awareness among general public, policy and decision makers regarding unrecognized recreation use value of KINAPA; providing information that can directly inform park management the effect of regulation of park fees to visitor’s demand for recreation; improvement of park services that would rise the quality of the park and ensure more visitors for recreation activities.
Objectives of the study
Main objective: The main objective of this study is to estimate recreation use value for KINAPA per trip so as to enable effective pricing strategy.
Specific objectives: The specific objectives are to:
• Estimate recreational demand function and consumer surplus of visitors to Kilimanjaro National Park.
• Examine the consequence of change in access fee structure on demand of visitors to the park.
• Examine visitor’s perception on the quality of the services provided by Kilimanjaro National Park.
Methodology
Description of the study area: Kilimanjaro National Park is located in Tanzania’s popular northern tourist circuit of the National Parks. The park was established in 1973 but was officially opened for visitation in 1977. In 1987, the World Heritage Convention declared KINAPA a world heritage site. KINAPA covers 1831.81 kilometer square. The area includes Mt. Kilimanjaro, the highest mountain in Africa and one of the world’s largest free standing mountains located 330 kilometers south of the equator on the northern boundary of Tanzania. It is composed of one extinct volcano namely Shira (3962 meters above sea level, m.a.s.l) and two dormant volcanoes namely Mawenzi (5149 m.a.s.l) and Kibo (m.a.s.l). The park is rich in flora and fauna resources including elephant, buffalo, leopard, and an endangered abbot duiker wide variety of birds.
The area has three zones namely high use hiking zone that covers 8.34% of the park area and includes Marangu, Mweka and Machame routes, low use hiking zone which include Londorosi, Umbwe, and Rongai routes and Kibo circuit and covers 8.73% of the entire park. Lastly it is Wilderness zone that covers 82.93% of the entire park which has restricted access (Figure 1).

Figure 1: A map showing the study site (Kilimanjaro National Park).
Research design: Data for this study were collected by using survey research design. Mitchell et al. [12] reported that surveys are valuable since it is a fast and inexpensive way to collect a lot of information about sample’s attitudes, beliefs and self-reported behaviors. Cross sectional approach in collection of data was employed where data were collected at a single point in time without repetition from a sample selected to represent some large population.
Sampling procedure and sample size determination
Sampling procedure: Population of this study consists of both resident and nonresident visitors of the park (KINAPA). Sampling frame for visitors was prepared from the entry points of the park where visitors are registered and then random selection of respondents was employed. As the study require the visitor who have already experience the nature of the park, by assistance from tour guides selected visitors were interviewed after put into practice the recreation activity.
Sample size determination: Population of this study is infinite because the nature of visitation to KINAPA is continuous and made establishment of exact number of visitors to be difficult. The desired sample size was then calculated following Godden formula for determining sample on infinite population. The formula specified as:
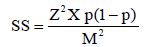
Where:
SS=Sample Size for infinite population, Z=Z value (1.96 for 95% confidence level), P=population proportion assumed to be 0.5 (50%) since this would provide the required sample size) and M=Margin of Error at 5% (0.05). Therefore this gives out the sample size of 384 respondents.
Data collection: Both primary and secondary data were collected for this study.
Primary data: The primary data were collected through interviews using a survey questionnaire which is the main tool in acquiring the data from visitors. A checklist also was used for key informants from the park management.
Questionnaire: The questionnaire for this study was designed as semi-structured. The questions in the questionnaire were designed in a way that permits acquisition of both qualitative and quantitative information. This data collection tool, however, designed to have an introductory part and other three parts. The first part was concerning the acquisition of the socio-demographic information such as gender, age, education level, employment status, income, nationality of visitors. The second part designed to obtain the important travel cost information such as visitors departing city/region, means of transport and cost involved to visit KINAPA. Third part was focusing to get information on visitors’ perception on the quality of services provided during a visit to KINAPA.
Checklist for key informants: Checklist was employed to key informants to capture all the data relating to this study. Informants were the Chief Park Warden, Tourism warden and Park Ecologist.
Secondary data: Secondary data were collected from journals, research papers, books, report and other relevant materials. Also key informants from the park management were interviewed and consulted to gather secondary information necessary for the study.
Data analysis: Both qualitative and quantitative collected data were analyzed. Quantitative data were analyzed using R software (a system for statistical computation and graphics) and descriptive statistics involved in presentation of data inform of charts, frequency tables and graphs. Ms-excel were employed for data entry for variable concerned so that the responsible variables analyzed by R software and thus ensure quantification recreation use value derived from KINAPA. However, the component of verbal discussion (qualitative data) was analyzed using content analysis method.
Estimation of recreation demand function and consumer surplus of the visitors to KINAPA: Individual travel cost method empirical approach following Mendes [13] were employed to capture the recreation use value of KINAPA by estimating recreation demand function and consumer surplus and willingness to pay for the visitors of the park.
Estimation of recreation demand function: The general specification of the TCM is:
Y=f (travel/recreation costs, income, individual characteristics, β, ε) (1)
Where travel/recreation costs, available recreation income, and individual characteristics are independent variables, β is the vector of parameters, and ε is a random disturbance that is independent from the disturbances of other individuals.
The recreation demand modeled as the number of days one visitor stays in the park, per trip (Y) instead of the number of trips or visits so as to avoid the problem of non-homogeneity of dependent variable and thereby calculate an average marginal consumer surplus (CS) associated with the recreation benefit of one day of stay in the site.
The recreation demand equation is specified as:
Y=β0+β1X1+β2X2+…+βNXN+εi (2)
Since the dependent variable data are count data, Poisson multiple regression models were used for estimation of coefficients.
Y=λ=β0+β1X1+β2X2+…+βNXN+εi (3)
Where X’s are explanatory variables and β’s is the unknown coefficient to be estimated. Explanatory variables includes travel cost (X1), per capita available recreation income (X2), Gender of respondents (X3), age of respondents (X4), level of education (X5), employment status (X6), and the perception degree the visitor has on the natural characteristics of the park (X7).
The travel/recreation cost was calculated according to the formula:
Xi=(RTCi/NDSi)+CoSi+CTvi+OCi+PEF (4)
Where RTCi=round travel cost, NDSi =number of days spent; CoSi=is the cost in US dollar of each day of stay including accommodation/camping visitors fee and other expenses; CTvi and OCi=opportunity cost of travel and on-site time per visitor per day; PEF=the park’s fee charged per day of use.
Opportunity cost of travel and onsite time (CTvi and OCi) were quantified using one-third of per capita available recreation income [13] and it was assumed that a recreation day is equal to 16 h following the definition of one typical recreation day of Walsh.
The following formula employed to estimate the opportunity cost of travel time per visitor per day.
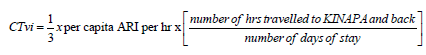 (5)
(5)
Where ARI=Available recreation income.
Furthermore the opportunity cost of time on site per visitor per day was calculated according to the following formula:
OCi=1/3×per capita available recreation income per h 16 h (6)
To ensure the best fit of the data in this study the recreation demand function was then specified and regressed in three functional forms namely multiple linear regression models, log-log model and semi log independent (log-lin). The choice of functional form is important as it has a significant consequence on the size of the consumer surplus (CS) estimates [14,15]. Additionally according to Hanley et al. [16], and Rolfe et al. [15] there is no clear preferred choice as to which functional
form used to estimate the recreation demand curve. Therefore this procedure was inevitable.
Selection of the best fit model: Russel et al. [17] elucidate that Akaike Information Criterion (AIC) is a measure of the relative goodness of fit of a statistical model which describe the tradeoff between the bias and variance between the accuracy and complexity of the model. Furthermore Ishigiro [18], Hilbe [19] and Demidenko [20] clarify that AIC is now one of the most, if not the most commonly used fit statistical criterion that characterize the information property of a statistical model and it is comparative in nature, with lower values indicating a better fitted model. Regarding this study selection of the best fit model was selected based on AIC of three models.
Model 1=Y=β0+β1X1+β2X2+β3X3+β4X4+β5X5+β6X6+β7X7+εi
Model 2=lnY=β0+β1 ln X1+β2 lnX2+β3 lnX3+β4 lnX4+β5 lnX5+β6 lnX6+β7 lnX7+εi
Model 3=lnY=β0+β1X1+β2X2+β3X3+β4X4+β5X5+β6X6+β7X7+εi
Therefore Table 1 specifies that the third model is the best as it have lowest AIC compared to other two models.
| Model | Residual Standard error | AIC |
|---|---|---|
| 1 | 0.4641 | 547.8158 |
| 2 | 0.4640631 | 1587.288 |
| 3 | 0.05759579 | -1175.6918 |
Table 1: Selection of the best fit model.
Estimation of consumer surplus: The appropriate functional model which is the semi log independent (log-lin) model was then used to obtain coefficient of estimates employed to calculate measures of welfare (consumer surplus and WTP). The representative visitor’s consumer surplus (CS) per each average day of stay visit was measured following Bocksteal et al. as follows:
 (7)
(7)
Mean visitor WTP per one day of a visit was calculated following Okojie et al. [21] as
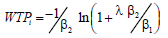 (8)
(8)
Where β1=estimated parameter of travel/recreation cost of the recreation demand function; β2=estimated per capita available recreation income parameter; λ=mean number of days stay in the park.
The total recreation value for sampled visitors (TRVs) obtained by multiplying mean visitor willingness to pay per one day of a visit (WTPi) by a mean number of days stay in the park and total number of visitors in the sample (n) given as;
TRVs=WTPi x λ x n (9)
Furthermore total recreation value of the park (TRVp) for a calendar year was estimated by the following formula;
TRVp =WTPix λ x n (10)
Where WTPi=mean visitor willingness to pay per one day of a visit, λ=mean number of days stay in the park and N=Park estimated number of visitor per year.
Examining the consequence of change in access fee structure on the demand of visitors to the park: The recreation demand function was used to study how different user fees influence the consumer surplus and the visitation rate (number of days visitor stay/trip) in the park. This was done by changing access fees in the recreation demand function where the estimated number of visitation rate corresponding to different access fees were obtained and demand curve generated. Furthermore the analyses were enabling to obtain the access fee that maximizes the revenue at the middle point of the demand curve as it was pointed out by Bharali et al. [22].
Examining visitor’s perception on the quality of the services provided by Kilimanjaro National Park: Visitor’s perception on the quality of services provided by KINAPA were examined by using six attributes namely management of the park, guiding and interpretation, water supply and sanitation system, friendliness of the guide, quality of accommodation facilities and attractiveness of the park. These attributes were analyzed using a likert scale in R software with five options range from very poor to very good as revealed. Furthermore there were questions to visitors on their opinion upon improvement needed to make the park more attractive and quality of services, intention to revisit the park and if they will recommend their friend, loved one or relative to visit the park, these were analyzed using content analysis method.
Results and Discussion
Socio-demographic characteristics of respondents: Regarding the purpose of serving the visitors better an organization have to recognize socio-demographic profile of visitors which is very useful key for marketing of product or services given by an organization. Specifically, understanding the socio-demographic profiles of visitors simplify the process of identifying and anticipate visitor’s necessities which will then enable developing and implementing appropriate market mix plan that meet visitor requirements. Sapari [23] clarify that by understanding the visitor profiles and characteristics it would help in creating niche market in the sector. Therefore, information on the visitors’ profile is one of the key elements to market the products in the tourism industry.
Age of respondents: Age was grouped into decades from 16 years old as shown in Table 2. The results shows that the recreation activities in Mt. Kilimanjaro National Park is dominated by respondents aged from 26-35 years, followed by 36-45, 46-55 and 16-25 corresponding to 35.6%, 20.1%, 17.4% and 15.0%. However few respondents with age 56-65 years and above 65 years were observed having 10.9% and 1% respectively. This pattern corresponds with the relative popularity of physical recreation for different age group that is, middle aged and younger groups participate much in recreation activity compared to older. Jenkins et al. [24] and Grebner [25] reported that age is an important factor that influences participation in recreation activities that is, participation in recreation pursuits tend to decline progressively with age and emphasize that as people become older they slow down and become less physically active.
| Grouped age of respondents | ||
|---|---|---|
| Age categories | Frequency | Percent |
| 16-25 | 57 | 15 |
| 26-35 | 136 | 35.6 |
| 36-45 | 76 | 20.1 |
| 46-55 | 69 | 17.4 |
| 56-65 | 42 | 10.9 |
| >65 | 4 | 1 |
| Total | 384 | 100 |
Table 2: Age of respondents.
Sex of respondents: Results in term of gender reveals that 57.6% of respondents were male where 42.4% of respondents were female. This indicate that there is little gap in participation between male and female in recreation activity at Kilimanjaro National Park. This is in line with the results of Harrison et al. [26] who specify that number of males and female will continue to be relatively equally represented in several outdoor recreation although in many cases female population out number male population.
Respondent’s education level: Education status was categorized into six levels as summarized clearly on Table 3. The results reveal that recreation activities in KINAPA is highly dominated with respondents having university education status, that is Masters and undergraduate level of education which correspond to 44.3% and 40.0%. However the former is followed with respondents having secondary and PHD level of education corresponding to 9.0% and 6.1%. Furthermore very few respondents were having Diploma and Secondary level of education. This means that most of the respondents have a university level educational background therefore most of visitors in KINAPA are well educated. Furthermore results indicate that the type and level of education people have undertaken has a profound effect on recreation participation. Torkildsen [27] reported that education and recreation share in the same concern for development of the person-body, mind and spirit through different approaches.
| Sex of respondents | ||
|---|---|---|
| Gender | Frequency | Percent |
| Male | 221 | 57.6 |
| Female | 163 | 42.4 |
| Total | 384 | 100 |
| Respondents education level | ||
| Level | Frequency | Percent |
| Primary | 1 | 0.2 |
| Secondary | 34 | 9 |
| Diploma | 2 | 0.5 |
| Undergraduate | 152 | 40 |
| Masters | 170 | 44.3 |
| PHD | 25 | 6.1 |
| Total | 384 | 100 |
| Respondents employment status | ||
| Status | Frequency | Percent |
| Employed | 316 | 82.3 |
| Unemployed | 4 | 1.2 |
| Students | 44 | 11.4 |
| Retired | 17 | 4.4 |
| Others | 3 | 0.7 |
| Total | 384 | 100 |
Table 3: Sex, education level and employment status of respondents.
Respondent’s employment status: Five options were employed to capture the employment status of respondents/ participants of recreation activities at KINAPA as shown on Table 3. The results reveal that 82.3% of respondents were employed followed by 11.4% of respondents who were students, then 4.4% of respondents were retired, 1.2% of respondents were unemployed and lastly was 0.7% of respondents were on the others option which includes respondents such as housewife. This pattern of employment status of visitors of KINAPA implies that large number of participants in recreation activities is employed.
Income status of respondents: Table 4 summarizes the annual income status of respondents participating in recreation activities at KINAPA. The results from this study reveal that 45% of respondents dominate by having income ranging from 35001 to 60000USD per annum, followed by 23% of respondents having annual income ranging from 10001 to 35000 USD and 19.4% were respondents with annual income ranging from 60001 to 85,000USD this indicate that majority of the tourists are in the middle income level of the workforce from the distribution by age. Moreover the study shows that income status is among the factor that influence participation on recreation activities and middle income earners are the one participating much in recreation activities at KINAPA. Torkildsen [27] clarify that recreation activity which require investment reflects a direct relationship between the level of income and amount of participation, such recreation includes camping, hunting and hiking. Additionally Sapari et al. [23] make clear that in general, as income increases, the purchasing power becomes higher which enables individuals to participate in more recreational activities; also people may shift their choice to better destinations. Thus having such this information helps the management of park to identify the ability of visitors to pay for recreational fees that could be used for maintenance and conservation purpose.
| Respondents annual income | ||
|---|---|---|
| Respondents annual income | Frequency | Percent |
| <10000 | 6 | 1.5 |
| 10001-35000 | 88 | 23 |
| 35001-60000 | 172 | 45 |
| 60001-85000 | 75 | 19.4 |
| 85001-110000 | 26 | 6.8 |
| 110001-135000 | 12 | 3.1 |
| 135001-160000 | 3 | 0.7 |
| >160000 | 2 | 0.48 |
| Total | 384 | 100 |
Table 4: Income status of respondents.
Nationality of respondents: Concerning the nationality of visitors recreating at KINAPA and on the basis of sampled visitors the study indicates that visitors are from over 39 countries from different continents. Most of the visitors were from USA, United Kingdom, Canada, Australia, German and France respectively are the ones leading on visiting the site compared to visitors from countries such as Lithuania, Chile, Wealsh, Singapore as clearly shown on Figure 2. This result show that KINAPA is a popular destination since visitors were from different region of the world and also this finding suggests the need for much strategically advertisement of KINAPA to different continents this will ensure more visitors to the site.

Figure 2: The bar chart showing frequency and nationality of visitors’ at KINAPA.
Recreation demand function, consumer surplus of the visitors and Total Recreation Value of KINAPA
Recreation demand function: Semi log independent model was then used to obtain coefficients of estimates as shown on Table 5. Coefficients were employed to calculate measures of welfare (consumer surplus and WTP).
| Residuals | ||||
|---|---|---|---|---|
| Min | 1Q | Median | 3Q | Max |
| -0.31869 | -0.03369 | 0.00012 | 0.03176 | 0.2145 |
| Coefficients | ||||
| Variables | Estimate ß | Standard Error | t - value | Pr(>|t|<) |
| (Intercept) | 1.86E + 00 | 2.27E-02 | 81.725 | < 2e-16*** |
| TrRCi | -1.75E-03 | 4.15E-05 | -42.206 | < 2e-16*** |
| AREC_INCOME | 3.80E-04 | 8.06E-06 | 47.177 | < 2e-16*** |
| GENDER | 2.44E-04 | 5.84E-03 | 0.042 | 0.9668 |
| AGE | 4.26E-03 | 2.41E-03 | -1.77 | 0.0775 . |
| EDU_LEVEL | -4.20E-03 | 3.22E-03 | -1.306 | 0.1923 |
| EMPL_STATUS | -1.87E-02 | 7.28E-03 | -2.563 | 0.0107 * |
| QUAL_PERCPTION | 4.45E-02 | 7.47E-03 | 5.957 | 5.59e-09*** |
Residual standard error: 0.0576 on 377 degree of freedom
Multiple R-squared: 0.8931, Adjusted R-squared: 0.8912
F-statistic: 483.2 on 7 and 377 DF, p-value: 2.2e-16
AIC: -1175.6918
Significance codes: 0 ‘***’ 0.001 ‘**’ 0.01 ‘*’ 0.05 ‘.’ 0.1 ‘ ’ 1
Table 5: Semi log independent regression results.
With regard to above results as revealed by Table 5, the coefficients of five variables among nine variables in demand recreation function are significantly different from zero to 1%, 5% and10% signifying that the variables strongly contribute to explanation of the variation of number of days a visitor stay in the park. On the other hand there was an exception made by two variable specifically gender and education whose coefficients are not significant different from zero.
Travel per recreation costs of visiting KINAPA: The estimated coefficient of travel per recreation cost (TrRCi) is negative for the sampled visitors and good enough it is statistically different from zero at 1% level. This is clearly suggesting that the number of days made by a visitor to KINAPA decreases as travel per recreation costs increases. Conversely this result is consistent with the theory of TCM which suggests that as travel costs increases, the number of days a visitor stay at the site decreases and vice versa. This finding is in line with several studies including that of Hesseln et al. [28].
Available Recreation Income for visitors at KINAPA: Looking at the results from Table 5 it can be seen that the parameter of estimates of available recreation income is statistically significantly different from zero at 1% level. This shows that the variable has strong influence on visitor’s decision on whether to increase or reduce number of days for staying and recreating at the park. Furthermore the results reveal that the ARCi variable is positive, this explains that the variable is positively correlated with the response variable that as visitor have less income probably the number of staying in the park decrease and vice versa is certain. The results is comparable to that of Khan [29] who reported that if the income level of the visitors increases the recreational demand to visit the site also increase. Also Carr [30] clarify that participation in most recreational activities depends on the amount of disposable income available to an individual.
Gender of visitors at KINAPA: Concerning this explanatory variable the results indicate that the variable is positive and it is not significant different from zero as shown on Table 5 above. Possible the results explain that gender has less influence on visitation at KINAPA and for that reason both male and female express relatively equal chance of visiting the park.
Age of visitors at KINAPA: The influence of age to number of days a visitor stay in the park was found to be positive and significant at 10% significance level as revealed on Table 5. The interpretation for this result is that the age of the visitor is an essential determinant of demand for park visitation and it is positively correlated with the response variable indicating that older visitors spent more days for recreation at KINAPA compared to middle aged and younger visitors.
Education level of visitors at KINAPA: With reference to Table 5 the results illustrate that education level has no influence to number of days a visitor stays at KINAPA as the variable is not significantly different from zero. This is an indication that large number of visitors recreating at Kilimanjaro are educated with greater awareness as compared very few with less education whose their effect to a whole sample taken is negligible. Carr [30] confirms that education level affects individual awareness and appreciation of what is offered by recreational site. Moreover it might be due to the fact that sample dimension was not sufficiently high to include the variable to be significant to explain the response variable as suggested by Anderson [31].
Employment status of visitors at KINAPA: Regarding employment status the result as shown on Table 5 reveal that the variable is significantly different from zero and it is negatively correlated with number of days a visitor stay in the park. The implication of this finding is that firstly paid occupation influence visitation to a recreation site and secondly employed visitors appear to have an understanding of outdoor nature-based recreation activities more than visitors with nonemployment status. This finding is also supported by Kyle et al. [32] testifying that salaried occupation generally influence participation in recreation activities and thus visitation rate whereas under unemployment situation recreation experience may be diminished and so the number of participants may be reduced.
Quality perception by visitors at KINAPA: From Table 5 it can be seen that the estimated coefficient of quality perception reveal positive relationship with response variable and more interestingly it is statistically different from zero at 1% confidence level. This finding suggests that a park of better quality may attract visitors more often than the park with poor quality. Specifically it point out that the environmental quality and service quality provided KINAPA to large extent satisfy visitors and indicate that there is a small existing gap created as a results of their expectation before and after visiting the site.
Hsieh [33] provide evidence that although the tourist attraction is the important driving force behind the tourism system but the quality of activities, service and value of the product at the site have an impact on the future willingness to revisit or recommendation of the site to others. Furthermore Atilgan et al. [34] reported that the competitiveness and performance of the tourism industry and its attractions sector has been linked with its ability to meet visitor expectations through the provision of quality services.
Goodness of fit: The goodness of fit values also has been pointed out with reference to Table 5. The results express that multiple R squared is 89.3% whereas the adjusted R squared is 89.1%. Statistically this finding implies that about 89.3% of the total variation in the response variable is explained by the selected model and express the strength of the model. Ho [35] pointed out that a measure of strength of the computed equation or function is R- squared, sometimes called the coefficient of determination and it is simply the square of the multiple correlation coefficients representing the proportion of variance accounted for in the dependent variable by the predictor variable. Additionally Woodhouse [36] enlighten that adjusted R-squared is a modified R-squared and improved measure of the overall fit of a multiple regression relationship.
Consumer surplus and Total Recreation Value of KINAPA: The consumer surplus is 925 182 TZS (USD 571.10) per day of stay in the park for a representative tourist while the mean visitor WTP per one day of a visit is 837 280.80 TZS (USD 516.84). The total recreation value for all sampled visitors for one average length day of stay in the park as represented by equation 9 is 344 959 689 6 TZS (USD 212 938.08). Since the mean length of stay for a visitor per trip is 6.927 (calculated directly from data’s sample) therefore the total recreation value for sampled visitors per trip is 2 389 535 770 TZS (USD 1,475,022.08). Additionally, based on KINAPA projection on visitors’ statistics of 54 168 visitors for 2013/2014 the total recreation value of the park for one calendar year as shown by equation 10 is projected to be 314 165 955 200 TZS (USD 193,929,602).
Consequence of change in access fee structure on the demand of visitors to the park: Among the objective of this study was to examine how different user fees influence the consumer surplus and the visitation rate at KINAPA. By using recreational demand function, different entry fees with equal range were introduced into the function resulting in changes on travel per recreation costs. The simulation resulting into sets of estimated number of visitation rate corresponding to different entry fees as clearly shown in the Table 6 and Figure 3 with assumption that the park authority has not introduced any entry fee for visiting the site. Figure 3 also as a recreation demand curve experience the feature of any other demand curve for other goods or services, that is, it reveal the inverse relationship between visitation rate and entry fees.

Figure 3: Recreation demand curve showing estimation of revenue maximization entry fee for KINAPA.
| Average number of days of stay at the park | Entrance fee(In USD) |
|---|---|
| 9.58 | 10 |
| 9.39 | 20 |
| 9.3 | 30 |
| 9.12 | 40 |
| 8.94 | 50 |
| 8.76 | 60 |
| 8.67 | 70 |
| 8.5 | 80 |
| 8.33 | 90 |
| 8.17 | 100 |
Table 6: Estimation of revenue maximization entry fee for KINAPA.
However at the middle point of recreation demand curve the entry fee that will maximize the revenue collection and thus the value of the park was estimated to be 90 396 TZS (USD 55.8) corresponding to visitation rate of 8.85 and a consumer surplus of 1 411 149.6 TZS (USD 871.08). Moreover by using above estimated entry fee the total recreation value of the park for one calendar year rise from 314 165 955 200 TZS (USD 193 929 602) to 477 933 539 300 TZS (USD 295 020 703.3).
Management of the park: Visitors included in this sample express high degree of satisfaction with how the park is managed as revealed on Table 7 above. 51.9% and 20.3% of visitors responds to good and very good options. These results suggests that park management have meet visitors expectation such as provision of best service for them, well conserved natural environment of Mt. Kilimanjaro and the whole scenery offered by the Kilimanjaro National Park. This finding is in line with the findings of Bushel et al. [37] who reported that Park visitors are satisfied and increase the use of the park as management better serves their need. Kaltenborn et al. [38] give explanation that it appears that visitors to National park perceive the area as a well-managed with good opportunities for encountering magnificent wildlife, landscape and an area with environment capable of producing high quality nature tourism experiences. Furthermore Woodside et al. [39] clarify that when visitors satisfied it usually indicates the measure of the fit between what is wanted by visitors and what is provided by management, thus representing the leading criterion for determining the quality that is actually delivered to the visitor through the products/services available at the area.
| Aspects | Very poor | Poor | Fair | Good | Very good |
|---|---|---|---|---|---|
| Management of the park | 0 (0%) | 13 (-3.50%) | 94 (-24.30%) | 199 (-51.90%) | 78 (-20.30%) |
| Guiding and interpretation | 4 (-1.00%) | 2 (-0.50%) | 63 (-16.30%) | 143 (-37.40%) | 172 (-44.80%) |
| Water supply and sanitation system | 26 (-6.80%) | 147 (-38.30%) | 99 (-25.80%) | 53 (-13.60%) | 59 (-15.50%) |
| Quantity and quality of the park facilities | 6 (-1.50%) | 50 (-13.30%) | 137 (-35.90%) | 105 (-27.50%) | 83 (-21.80%) |
| Attractiveness of the park | 4 (-1.00%) | 0 (0%) | 23 (-6.00%) | 121 (-31.60%) | 236 (-61.40%) |
Table 7: Response on visitors' perception on the quality of the services provided by KINAPA.
Guiding and interpretation capacity: Mak [40] pointed out that from tourism perception tour guide are the pathfinders, animators, tour leaders, and mentors. Ap et al. [41] and Heung [42] also make it clear that tour guide as employees of tour operators, they are representative characterizing the image and reputation of the company, reconcile between the host community and its visitors, interpreters of destination culture and heritage and the salespersons who sell the next tour.
Table 7 also present the results of the perception of visitors on the aspect of guiding capacity and interpretation of tour guide where a total of 82.2% of visitors rank the aspect as good and very good. This means that the tour guides as employee of tour operators and tour agencies that have got a license to conduct recreation activities at Mt. Kilimanjaro execute their responsibility with an outstanding attitude toward visitors, for example interpretation of attraction, management of visitors activities and behavior following park regulations, giving information on local facilities, eagerness to assist and understanding the specific needs of visitors. This finding is supported by Rabotic [43] who make clear that successful management of visitors’ dynamics represent the guarantee for achieving certain degree of satisfaction among the tour participants.
However 17.8% of visitors rank the aspect of guiding and interpretation capacity of tour guide on three options as fair, poor and very poor. According to visitors several weakness upon tour guide have been identified including; insufficient practical guiding skills, poor presentation and communication skills and less interpretive knowledge of the geography, history and resources present at the area.
Water supply and sanitation system: With regards to water supply and sanitation system, the attribute were dominated by 45.1% of visitors who were dissatisfied as they responds on poor (6.8%) and very poor (38.3%) choice. 29.1% of visitors show that they were satisfied and they reply to good (13.6%) and very good (15.5%) choice whereas 25.8% of visitors responds on fair choice. This result suggests that infrastructure system specifically on water and sanitation system requires special consideration particular on improvement so as to meet International standards and thus visitor’s satisfaction.
Quantity and quality of park facilities: Adequate park facilities permit visitors to get pleasure from the protected areas system in a well, safe and environmentally sensitive way. These park facilities concerned in this study includes; linking roads, toilets and shower services, huts, camping sites and entry gates. Concerning the above attribute, 49.3% of visitors included in the sample were satisfied with the quantity and quality of the service provided by the park. This is revealed in Table 7 as they responds on good (27.5) and very good (21.8).
However perception of other visitors towards the attribute is different, 50.7% of visitors show less satisfaction with the condition of current quantity and quality of facilities of the park. Based on visitors recommendation on improvement of the quality of service provided by KINAPA, majority suggest on the following weaknesses; inadequate toilet facilities at the campsites, inadequate information signs for example history and geography of the area, littering along the trails and around high traffic areas of the park such as Kibo peak, inadequate landscaping works to camping areas, less trash bins for litter collection on campsite areas and less information on flora and fauna present at different zones. Other visitors point out that some of existing facilities for example toilets are outdated and of low quality in such a way that do not meet the international standards (Figure 4).

Figure 4: A picture showing outdated type of toilet (temporary toilet).
When conducting interview with officials at KINAPA specifically in the department of tourism, argue that management of the park has already stating taken care of the situation for example the already written proposal on construction of infrastructure based on the following reasons: Existing facilities are outdated and not sufficient to cater the number of increasing visitors that might not comply with international standard and that made KINAPA to face difficulties in the tourism market competition; the number of tourists visiting the park is increasing. This necessitates increased number of service providers to carry mobile facilities including mess tents where it’s scattering all around at the camps, implying environmental degradation.
Additionally the park has already build few toilet facilities to some of the areas along the current usable routes although still there is demand of other toilet facilities up the mountain as clearly shown on Table 8, (Figures 5 and 6).

Figure 5: A picture showing improved type of toilet (UCLAS TYPE).

Figure 6: A graph showing visitors’ trend for seven financial years at KINAPA.
| Existing | Required | |||||
|---|---|---|---|---|---|---|
| Temporary | Permanent | All Permanent | ||||
| Timber wall & floor | Uclas type | Gable roof type | Single roof type | Uclas type | Gable roof type | Total |
| 128 | 7 | 24 | 28 | 15 | 130 | 332 |
| 187 | 145 | 332 | ||||
Table 8: Existing and demanded toilet facilities at KINAPA.
Attractiveness of the park: Lamelin et al. [44] reported that most of protected areas around the world were established with the intent of perpetually protecting highly valued individual species and their habitat with the primary goal of ensuring that there is clearly defined direction for the maintenance of ecological integrity and appropriate use of the resources. Pertaining to attractiveness of the park based on naturalness of the physical resources, the results on Table 6 shows that 93% of visitors respond on good (31.6%) and very good (61.4%) choice whereas only 1.0% of visitors reveal dissatisfaction with the attribute. This result explain that majority of visitors were satisfied towards a well conserved natural environment of KINAPA.
Although Aziz et al. [45] reported that a visitor who is satisfied with the performance or services offered by the park is more likely to revisit the park but this study reveal that majority of visitors deny to revisit as they the trip as a lifetime experience but they insist on recommending KINAPA as a place to visit to their friends, love one and relatives. This is also confirmed by Cam [46] and Mohamed [47] that concluded positive tourism destination image will reflect the tourist satisfaction and thus made satisfied visitor as word of mouth advertizing agent who is willing to speak positive and recommend the destination to others [48-50].
Conclusions
This study revealed that participation in recreation activities is closely and positively related to social status and the status of one’s occupation. The middle classes are not only more active racially and academically, but also travel more and participate more compared to old ones. Also there is an existence of closely relationship between income levels, education level and employment status upon recreation selection where a visitor with inadequate income tends to limit participation while the one with adequate income have a greater range of opportunities for participation in recreational activities.
Regarding the consumer surplus that indicates the welfare gained derived by a visitor for one day length of stay in the park, the willingness to pay estimated by Hickisian welfare measure for one day one day length of stay by visitor, the total recreation value for a sampled visitors and a calendar year 2013/2014 was estimated and were significant.
Concerning the satisfactory user fee that will maximize the park revenue as well as the total recreation value, the study estimate it to be 90 396 TZS (USD 55.8) corresponding to visitation rate of 8.85 days.
Furthermore the findings suggest that the perceived quality of visitors, which takes into consideration park management, guiding and interpretation, water supply and sanitation system, quantity and quality of facilities and attractiveness of the park play a greater role and significant predictors of visitors’ satisfaction.
Recommendations
Based on these findings, this study recommends the following:
(i) The park authority has to allocate adequate budget for KINAPA management and prioritize on conservation of natural resources in the park, improvement and regular maintenance of recreational infrastructure and facilities in KINAPA with the primary target of meeting international standards. Increased improvement in such facility will enhance the welfare measure and the use value tourists derive from the park, more visitors will visit the park and thus increasing the profit margin of the park and increase self-employment opportunities and thus national development.
(ii) Regarding the improvement of the quality of services KINAPA provides to visitors the park authority have to strengthen the performance to all of the aforementioned attributes to enhance visitors’ satisfaction which will then ensure enormous visitation rate and great performance on tourism sector will be attained.
(iii) TANAPA management have to make sure the tour operators and travel agencies understand tour guides should be trained regularly to enhance their experience and motivated because they are one of important stakeholders in tourism development.
(iv) More research based on economic valuation of recreation use value is recommended to other National Parks since clear understanding of the value of the existing natural resource always trigger the proper management and allocation of resource.
Acknowledgements
Our frank appreciation to Dr. L. P. Lusambo, whose precious guidance, constructive critics and challenges has made the completion of this study possible. Special thanks are also extended to the management of Tanzania National Parks, Kilimanjaro National Park and staffs specifically Tourism warden, park ecologist,F park rangers at both Marangu and Mweka gates for their kindly acceptance and positive cooperation they provided during data acquisition.
References
- Gregg G (2005) The Legal System and Wildlife Conservation: History and the Law’s Effect on Indigenous People and Community Conservation in Tanzania. Georgetown International Environmental Law Review 17: 481-516.
- Heale J, Wong W (2009) Culture of the World: Tanzania. Benchmark Books (NY).
- Tanzania National Park (2004) General Management Plan for Kilimanjaro National Park.
- Champ PA, Boyle Kevin J, Brown Thomas C (2003) A primer on nonmarket valuation: The economics of nonmarket goods and resources. Kluwer Academic Publishers, Netherlands.
- Breidert C, Hahsler M, Reutterrer T (2006) A review of methods for measuring willingness to pay. Innotive marketing 2.
- OECD (2002) Handbook of Biodiversity Valuation: A Guide for Policy Makers.
- Lusambo LP (2009) Economics of household energy in Miombo woodlands of Eastern and South Tanzania. University of Bangor, UK
- Marn MV, Roegner EV, Zawada CC (2003) Pricing new products. The McKinsey Quaterly 3: 40-48.
- Krug W, Suich H, Haimbodi N (2002) Park Pricing and Economic Efficiency in Namibia. DEA Research Discussion Paper 45: 36.
- Honey M (2008) Ecotourism and Sustainable Development: Who Owns Paradise? Second Edition, Island Press.
- Fitzpatrick M (2009) East Africa: Lonely Planet Multi-country Guides. 8th Revised Edition. Lonely planet publication.
- Mitchell ML, Jolley JM (2012) Research Design Explained. 8th edn, John-David Hague.
- Mendes I (1997) The Recreation Value of Protected Areas: An Application to the Peneda-Gerês National Park. Institute of Economics and Business Administration (ISEG), Technical University of Lisbon.
- Beal DJ (1995) A Travel Cost Analysis of the Value of Carnarvon Gorge National Park for Recreational Use. Rev Marketing Agr Econ 63: 292�303.
- Rolfe J, Prayaga P (2007) Estimating values for recreational fishing at freshwater dams in Queensland. Aust J Agr Resour Ec 51: 157-174.
- Hanley N, Spash CL (1993) Cost�Benefit Analysis and the Environment. Edward Elgar Publishing Limited, England.
- Russell J, Cohn R (2013) Akaike Information Criterion. Book on demand Ltd.
- Ishiguro M, Sakamoto Y, Kitagawa G (1997) Bootstrapping log likelihood and EIC, an extension of AIC. Annals of the Institute of Statistical Mathematics 49: 411-434.
- Hilbe JM (2011) Negative Binomial Regression. Revised 2nd edn, Cambridge University Press.
- Demidenko E (2013) Mixed Models: Theory and Application with R, 2nd edn. John Wiley and Sons, Inc., Hoboken, New Jersey.
- Okojie LO, Orisajimi OS (2011) Valuation of the recreational benefits of Old Oyo National Park, Nigeria: A Travel Cost Method Analysis. J Food Agric Environ 9: 521-525.
- Bharali A, Mazumder R (2012) Application of Travel Cost Method to Assess the Pricing Policy of Public Parks: The Case of Kaziranga National Park. Journal of Regional Development and Planning 1: 41-50.
- Sapari MS, Shuib A, Ramachandran S, Afandi SHM (2013) Visitors’ Satisfaction towards Service and Facilities in Kilim Karst Geoforest Park, Langkawi. J Appl Econom Bus 1: 25-42
- Jenkins JM, Pigram JJ (2007) Outdoor Recreation Management. 2nd edn, Routledge, USA.
- Grebner DL, Bettinger P, Siry JP (2012) Introduction to Forestry and Natural Resources. Academic Press.
- Harrison G, Erpelding M (2012) Outdoor Program Administration: Principles and Practices. 1st Edition, Active Interest Media, Inc.
- Torkildsen G (2012) Leisure and Recreation Management. 5th edn, Tailor and Francis e-library.
- Hesseln H, Loomis JB, Gonzalez-Caban A, Susan A (2003) Wildfire effects on hiking and biking demand in New Mexico: A Travel Cost Study. Journal of Environmental Management 69: 359-368.
- Khan H (2006) Willingness to Pay for Margalla Hills National Park: Evidence from the Travel Cost Method. The Lahore Journal of Economics 11: 43-70.
- Carr M (1997) New Patterns: Process and Change in Human Geography. Nelson Thornes p: 525.
- Anderson DM (2010) Estimating the economic value of ice climbing in Hyalite Canyon: An application of travel cost count data models that account for excess zeros. J Environ Manage 91: 1012-1020.
- Kyle G, Graefe A, Manning R, Bacon J (2003) An Examination of the Relationship between Leisure Activity Involvement and Place Attachment among Hikers along the Appalachian Trail. J Leisure Res 35: 249-273.
- Hsieh W (2012) A study of Tourists on Attraction, Service quality, Perceived Value and Behavioral Intention in the Penghu Ocean Firework Festival. The Journal of International Management Studies 2: 1993-1034.
- Atilgan E, Akinci S, Aksoy S (2003) Mapping service quality in tourism industry. Managing Service Quality 13: 412-422.
- Hanley N, Shogren J, White B (2007) Enviromental Economics in Theory and Practice. 2nd edn, Mac Millan India Limited.
- Woodhouse R (2003) Statistical Regression Line-fitting in the Oil and Gas Industry. Penn Well Books.
- Bushell R, Eagles PFJ (2007) Tourism and Protected Areas: Benefit beyond boundaries. CAB International.
- Kaltenborn BP, Marte Q, Christian N (2011) Local governance of national parks: the perception of tourism operators in DovreSunndalsfjella National Park, Norway, Norwegian. J Geogr 65: 83-92.
- Woodside, Martin (2008) Tourism Management: Analysis, Behaviour and Strategy. CAB International.
- Mak AHN, Wong KKF, Chang RCY (2010) Factors affecting the service quality of the tour guiding profession in Macau. Int J Tour Res 12: 205-218.
- Ap J, Wong KKF (2001) Case study on tour guiding: Professionalism, issues and Problems. Tourism Manage 22: 551-563.
- Heung VCS (2008) Effects of tour leader's service quality on agency's reputation and customers' word of mouth. J Vacat Mark 14: 305-315.
- Rabotic B (2011) American tourists' perceptions of tourist guides in Belgrade. UTMS Journal of Economics 2: 151-161.
- Lamelin H, Dawson J, Stewart EJ (2013) Last Chance Tourism: Opportunities in a Changing World. Routledge.
- Aziz NA, Arrifin AAM, Omar NA, Evin C (2012) Examining the Impact of Visitors’ Emotions and Perceived Quality towards Satisfaction and Revisit Intention to Theme Parks. J Manag 35: 97-109
- Cam TTA (2011) Explaining tourists’ satisfaction and intention to revisit Nha Thang, Vietnam.
- Mohamad MA, Abdullah AR, Mokhlis S (2012) Tourists’ evaluation of destination image and future behavioral intention: The case of Malaysia. J Manage Sustain 2.
- Fleming CM, Cook A (2008) The recreational value of Lake McKenzie, Fraser Island: An Application of the Travel Cost Method. Tourism Manage 29: 1197-1205.
- Gürlük S, Rehber E (2008) A travel cost study to estimate recreational value for a bird refuge at Lake Manyas, Turkey. J Environ Manage 88: 1350â�?1360.
- Ho R (2006) Handbook of Univariate and Multivariate Data Analysis and Interpretation with SPSS. CRC Press pp: 424.
Relevant Topics
- Aquatic Ecosystems
- Biodiversity
- Conservation Biology
- Coral Reef Ecology
- Distribution Aggregation
- Ecology and Migration of Animal
- Ecosystem Service
- Ecosystem-Level Measuring
- Endangered Species
- Environmental Tourism
- Forest Biome
- Lake Circulation
- Leaf Morphology
- Marine Conservation
- Marine Ecosystems
- Phytoplankton Abundance
- Population Dyanamics
- Semiarid Ecosystem Soil Properties
- Spatial Distribution
- Species Composition
- Species Rarity
- Sustainability Dynamics
- Sustainable Forest Management
- Tropical Aquaculture
- Tropical Ecosystems
Recommended Journals
Article Tools
Article Usage
- Total views: 7855
- [From(publication date):
December-2016 - Aug 07, 2025] - Breakdown by view type
- HTML page views : 6576
- PDF downloads : 1279