Effects of Land Use Changes on Soil Erosion and Sedimentation of Dams in Semi-Arid Regions: Example of N’Fis Watershed in Western High Atlas, Morocco
Received: 24-Feb-2019 / Accepted Date: 19-Mar-2019 / Published Date: 26-Mar-2019
Abstract
In Morocco, water resources management has become a challenging request due to the arid climate of the region and the growing population, the water reservoir studied in this work is an example of solutions proposed by the Moroccan government to face this issue. However, the Lalla Takerkoust reservoir is subject to the sedimentation problematic related to soil c classified as severe in the corresponding watershed.
We have applied the RUSLE and the SEDD model over two periods to understand the impact of land use change on potential c erosion as well as the suspended sediment yield SSY. Results show a decrease in the the potential soil erosion risk (42.87 t/ha/yr in 1987 to 36.59 t/ha/yr in 2009) and suspended sediment yield SSY (6.52 t/ha/year 1987 to 4.03 t/ha/year in 2009), allowing us to conclude that the green policies adopted by the Moroccan government; especially the one concerning the vegetation cover, have a direct influence on reducing erosion phenomenon, thus, sedimentation of dames. Those results were confirmed by the observed sedimentation obtained from a series of bathymetric campaigns (from 6.52 t/yr in 1987 to 4.03 t/yr in 2009) leading us to conclude that the use of alternative datasets in GIS-based models can give valuable estimations enabling the understanding of the relation of spatial distribution of vegetation-soil erosion-sedimentation in dams, even for a region characterized by lack of data. This study proves also, that rational green strategy of water and vegetation can have a long-term positive effect on dams’ lives.
Keywords: Soil erosion risk; Sedimentation of reservoirs; Land use change; GIS-Remote sensing; Semi-arid climate
Introduction
In arid and semi-arid regions, the future availability of water to match crops water requirements will be particularly critical for agricultural production [1-3]. Thus, different strategies have been developed by these countries to mitigate water scarcity. Among these strategies, a global boom in dam construction is currently underway, and consequently, dams demand scholarly attention overall [4]. However, the silting of dams is a very complex natural phenomenon reducing the dam's storage capacity, as the sediments accumulate in the reservoir; the dam gradually loses its ability to store water for the purposes for which it was built [5]. Among the factors controlling siltation of dams, seems to be the most important factor. The siltation of dams seems to become more complex especially with the fact that soil erosion is likely to worsen in the future; this is especially true in the northern Mediterranean basins where studies have emphasized the importance of soil erosion [6-9]. The study led by suggests that soil erosion, in general, threatens the possibility of North African countries to adapt to climatic changes and future land use is decisive for erosion rates [10,11].
Classified as a semi-arid country in development, Morocco has engaged since the 1960s, in a successful political mobilization of surface water through the building of large dams in order to face decreasing of rainfalls and the increasing number of floods due to climate change. However, almost 75% of arable lands in Morocco are affected by erosion [12], each year, siltation reduces the total capacity of national water infrastructures, these capacity losses are actually estimated at 60 million m3 and will attend 150 million m3 in 2030, resuming a decrease of water storage of 0.5% per year and causing an economic loss estimated at 1 billion dollars per year in upstream-downstream of all Moroccan dams [13]. In this regard, the Moroccan government began a policy aiming the strengthening of hydraulic and agricultural infrastructures of the territory [14]. This program was starting with the creation of ORMVAH (Regional Office of Agricultural Development of Haouz), followed by the national water strategy of building dams in 1967, and ending with the plan of the Green Morocco “Plan Maroc Vert” in 2008 [15]. Besides the objective of promoting “aggressively” the productivity of the agriculture [16], the Moroccan government aims to make the agricultural sector the main level of economic growth of the country for the next years as well as to deal with socio-economic, climate issue and alleviation of poverty [12].
One of the strategic reservoirs experiencing a serious problem of siltation is the dam of Lalla Takerkoust located at the outlet side of N'fis Basin (Western High Atlas). Build in 1935, the dam of Lalla Takerkoust provide a source of water for the vast alluvial plain of the Haouz of Marrakech (3420 km2); it assures an additional production of electric energy and drinking water supply for Marrakech city [17]. The dam was raised to 9 m between 1978 and 1980 in objective to increase the hydroelectric power from 10 to 15 million kWh, to satisfy water supply of the extension of irrigated areas that progress from 5000 to become 9800 hectares and to overcame the critical siltation problem. Over the years the dam has known some serious problems related to sedimentation with 20% of loss during the past 20 years [17], also with the improvement of livings standards of the population and the progress of technology, the need for water has undergone a significant increase since 2005 while natural water demand is constant and cannot be controlled to move in the same direction and even reduced due to siltation. For that reason, the integrated development master plan for water resources in the concerned area decided to implant a new dam, Ouirgane downstream of the river N'fis and upstream of the dam Lalla Takerkoust (20 Km) in order to improve water storage capacity of the dam Takerkoust.
Unfortunately to deal with naturally occurring process, the Moroccan experience is very poor [18] especially with the fact of lacking and non-homogeneity of data necessary for modeling (e.g., river water discharges, bed load and suspended sediment yields, accurate soil maps, sub-hourly rainfall, high-resolution digital elevation models) [19,20]. Thus, the purpose of this study is part of this objective; it relates to i) Improve methods-solution to solve the data problem ii) Improving the ability of the RUSLE model (Revised Universal Soil Loss Equation) to give significant results relative to siltation, and iii) to evaluate quantitatively the impact of the Moroccan strategy of land cover change on the soil losses and on sedimentation of the dam.
Study Area
The N’Fis Watershed situated in the central Western High Atlas of Morocco (Figure 1), lies between 7°55′W and 8°40’W longitude and 30°52′ N and 31°25′ N latitude and cover approximately 1702 km2. It is traversed by N’Fis River and the elevations range from 641 m to 4080 m at the lowest point, with a mean elevation of 1860m.

Figure 1: Relief and location map of N’Fis drainage basin in Western High Atlas, Morocco.
The N’Fis watershed is characterized by arid to a semi-arid climate with an annual average temperature around 18.6°C, with an absolute maximum of 47.5°C observed in July and an absolute minimum of -7.5°C observed in January. The annual precipitation averages 375 mm yr-1. Within the watershed, precipitation is notably higher in the South-east and South-west areas where observed the highest elevations. High monthly rainfall is registered in March and April, while minimum values are measured during July and August. Regarding the geological setting, the extreme south is dominated by the Cretaceous carbonate’s formations (dolomitic limestones, marly limestones and calcareous marl), the greater part of the basin, and more particularly the mountainous part, consists mainly of schists and limestones of Primary age. This part is dotted by small Permo-Triassic formations characterized by the dominance of sandstone and clay, in the North, the downstream sector of the watershed; dominate softer rocks from Plio- Quaternary, Concerning the soil cover, the study area is characterized by two major type of soils, the Calcic Xerosoils dominating the low slopes in North (25%), and the Lithosols founded in steep slopes in South (75%). The majority of the study area is considered as bare areas, these lands are cultivated in rainy periods to create a resource feeding for livestock after rainy periods, the beds of tributaries characterized by moist and fertile soils are largely exploited to create irrigated arable land. The eucalyptus trees occupy an important area in the centre of the catchment, forming a forest which is permanently restored because of forest fires affecting it periodically and constantly.
Research Methodology
The approach is oriented toward the temporal analysis of lands use changes in land, their impact on soil erosion, and therefore their impact on reservoirs sedimentation. The methods used in the evaluation and the cartography of erosion vary on the one hand according to the objectives, the means implemented, the scales of work and other shares of the area and its characteristics [21]. In our case, we selected two different prediction models, the first, the Revised Universal Soil Loss Equation RUSLE, used to assess mean annual water erosion, and the second, the Sediment Delivery Distributed SEDD model, adapted to determine sediment transport to perennial streams [22,23]. The spatial pattern of annual soil erosion and sediment yield was obtained by integrating RUSLE, SEDD in a GIS environment.
The RUSLE and SEDD models have been proved to be an effective method for predicting the magnitude and spatial distribution of erosion, the combined application of these models can give a useful input to better distinguish between the variation vegetation-soil erosion and then soil erosion-sedimentation [24]. For soil erosion modelling, we consider the years 1987 and 2009 as a reference because of the availability of the data of bathymetric surveys of the Lalla Takerkoust reservoir. The required model input parameters i.e., land use, rainfall, soil maps and relief map (Digital Elevation Model) was generated. Finally, model validation was performed using the sediment yield predictions, the methodologies applied is summarized in Figure 2.

Figure 2: Summary of the adopted process.

Figure 3: The methodology used to estimate the cover management factor.
Variation of land cover
To perform this analysis, we chose a two mosaiced Landsat 5 images of 23 November 1987 and another two mosaiced Landsat 7 images dated 11 Jun 09. All images are taken in the dry season to avoid comparing images from different seasons, which could result in non-comparable results. The images used in this analysis were acquired through the Earth Explorer USGS image database (Landsat Imagery Archive) with 202/38 and 202/39 (path/row). Before starting the analysis, the atmospheric correction operation the Model FLAASH (Fast Lineof- Sight Atmospheric Analysis of Spectral Hypercubes) was used in ENVI 5.1 softwares through the approach of [25] for hyperspectral and multispectral data, the shadows introduced by topography were eliminated using the band rationing approach [26]. After having performed viewing an image in a colour composite RGB (red, green, blue), an unsupervised automatic classification was made. If the result of the classification does not allow identifying the desired classes (at the base of the occupation card acquired on large scale), we perform the Principal Component Analysis (PCA) on portions of the image that exhibit class confusions.
In case the vegetated surfaces are not well separated, aerial images are used, the vegetation index (NDVI) and the information required during field visits are used to better separate these classes. Subsequently, a land use map is obtained for each analyzed date, the chart (Figure 3) summarizes the sequence of treatments that we performed on the satellite images. For greater certainty of how the vegetation evolves, we monitor the land changes using MODIS time-series datasets from 2000 to 2015, extracted from 250-meter MODIS/NDVI Time Series Database, MOD44/MYD44 with a step time of 16 days. The study used the Normalized Difference Vegetation Index (NDVI) to understand the evolution of vegetation on the last 15 years. The result will give an idea of the trend of increase or decrease and know the margin of NDVI knowing great or small evolution.
Soil erosion model description
RUSLE, one of the most widely-used models, the purpose is to provide the average annual long-term soil erosion for various land management practices in combination with rainfall patterns, topography and soil type of an area [27].
A=R.K.LS.C. P (1)
A represents the losses of potential average annual soil in the long term (t/ha/yr), R corresponds to rainfall factor (MJ mm ha-1 h-1), K represents the soil erodibility factor (t h MJ-1 mm-1), L and S respectively correspond to the factors of length and inclination of the slope (Dimensionless), C is the crop management factor (dimensionless), P represents the support of agricultural practices factor (dimensionless).
K factor is usually calculated using the following formula [28]:
100K = 2.1M1.14 (10-4 ) (12 - a) + 3.25(b - 2) + 2.5(c -3) (2)
M=(percentage of silt+very fine sand × (100–the percentage of clay), a is the percentage of organic matter, b is soil structure code used in soil classification, c is permeability class profiles.
Due to the lack of data, the difficulty of access to the field and its large surface, the approach used is that one proposed by Sharpley and Williams [29].

With SN1 =1− SAN /100 (4)
Where SAN sand fraction, SIL silt fraction, CLA clay fraction, and C topsoil carbon content. The SAN, SIL, CLA and C data are extracted from the new property Soil maps of Africa at 250 meters [29].
In this study the R-factor has been calculated by means of the Modified Fournier Index (MFI) with the approach suggested by for the area of the Moroccan country [30]:

Where pi is the mean monthly rainfall (mm) and p is the mean annual rainfall (mm).
A major limitation for studies aiming at mapping erosivity is the lack of validation data.; this is especially true for the African continent. So due to lack of rainfall stations covering the entire study area, the cumulative precipitation volume was estimated from Tropical Rainfall Mapping Mission (TRMM) data, using the “3Β43” product (mean monthly rainfall) at 0.125° spatial resolution. The TRMM data were used in a way that the data grid covers the study area could provide useful input to monitoring rainfall erosivity.
Slope length and steepness factor (L and S) is estimated in this study using the method developed by Wischmeier and Smith in 1978; L and S are calculated by taking step coupling methods [22,31]:
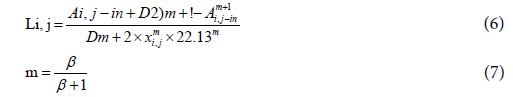
Ai, j − in represent the contributing area at the inlet of grid cell (i, j)measured in m2 . D represent the grid cell size (meters),
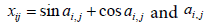 is the aspect direction of the grid cell (i, j) . θ is the slope of DEM in degrees.
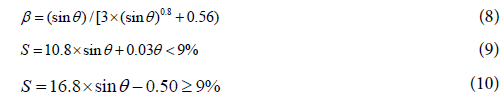
Where θ is the slope of DEM (%) , λ is the horizontal slope length and β is the index related to slope, the Digital Elevation Model (DEM) drawn from 20-m contour interval from 1:50,000 topographic sheets.
Using the Normalized difference vegetation index NDVI which is generally used to derive the C factor in erosion modelling, we calculated the C Factor based on the formula proposed by Desmet and Govers [32]:

Where α-value (equal 2) and β-value (equal 1) are the parameters determine the shape of the NDVI curve. The NDVI is calculated by spectral reflectance difference between Near Infrared (NIR) and red is used to calculate NDVI. The formula can be expressed as:

The final step was making a statistic analysis on ArcGIS software in order to give each land cover type the value of the corresponding C-Factor. The maps used in this step correspond to those elaborated following the methodology explained in the chart of Figure 3.
The management practice factor is usually determined by the method of cultivation and slope of the terrain [33].
The validation process will be carried out using the Sediment Delivery Distributed Model (SEDD) developed by Fernandez et al. [25], the model inputs gross eroded sediment from the RUSLE equation and determines the sediment yield involving the calculation of the sediment delivery ratio for each morphological unit or grid cell using raster GIS. The sediment yield from each grid cell is computed as:

In which Ai=soil loss for a grid cell i (t/ha/yr) calculated using RUSLE Model.
SDRi Sediment Delivery Ratio from cell i.
Generally, the SDR decreases as the basin area increases because there are more chances for eroded sediment to re-captured by the watershed before reaching a stream [34], it is estimated following [35] as a function of travel time:

Where

Runoff coefficient β depends on watershed morphological data [36], it is estimated using an inverse modelling approach, where the SDR for a watershed is related to β as a weighted mean of SDRi [24]. ti is calculated using the equation proposed by Renard et al. [23]:
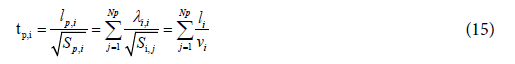
Where:
t p,i=Travel time for particles eroded from cell i, hr.
lp.i=Length of the hydraulic flow path. m.
Sp,i=Slope of hydraulic flow path, m/m.
Np= Number of morphological units, dimensionless
j = Hydraulic flow path. Dimensionless.
λi,j=Length of morphological unit.
Si,j=Slope of morphological unit.
li=Length of segment i along the flow path,
depending on the flow direction in the cell, m.
vi =Flow velocity for cell i, m/s.
The flow velocity of overland flow can be estimated from the relationship [37]:

Where:
si=slope of cell i (m/m).
di=a coefficient for cell i dependent on surface roughness characteristics (m/s) Adapted from Table 2
Validation
The SEDD model is validated by using sediment yield data derived from sediment volume estimations that resulted from bathymetric surveys of the Lalla Takerkoust reservoir. The bathymetric surveys were taken in 1981, 1988, 1991, 1995, 1999, 2004, 2008 and 2012 for Lalla Takerkoust reservoir and in 2008 and 2011 for the recent Ouirgane reservoir. The sediment volumes were converted to mass volume using an experimental mean bulk density extracted from the sediments of the two reservoirs (1.3 t/m3). The resulting mean annual sediment yield (t ha−1 yr−1) of the N’Fis watershed was compared with the annual soil loss as estimated by the used model.
Results and Discussion
Change of land use
After its construction in 1935, the Lalla Takerkoust dam brought many changes to the N’Fis drainage basin in terms of occupation, the water mobilized by the dam reservoir is used as a supply of drinking water and especially for the irrigation and extension of agricultural lands (Figure 4). This fact has played a major role in the fixing of soils, the reduction of erosion, and eventually leads to the minimisation of the sedimentation of the dam, thus, progressing its lifetime. The comparative analysis of cartographic materials was used to the spatial distribution of land use changes from 1987 to 2009. Spatially, the slope is largely the factor manipulating the distribution of lands use. In the low inclinations (slopes below 5°), the sediment deposition phenomenon from the steep slopes is much encountered, these places with most fertile soils are characterized by deep soils and dominated by croplands and grasslands. The steepest slopes (slopes above 10°), generally land with high soil erosion and thus have poor and shallower soils and thus do not allow a good crop development. These places are dominated by bare areas and sometimes occupied by shrublands and forests when lithology is tender.

Figure 4: Example of the huge land cover change that experienced the area after the installation of the Lalla Takerkoust dam.
On the temporary scale, it can be observed the increase in the surface of forests, shrublands, grasslands, and croplands and in return the decreasing in the surface of rainfed croplands, rocky outcrops, and bare areas. The land use/cover shows a large spatial variation that occurred in the study area over the analyzed period. According to the maps of land use (Figures 5A and 5B), the catchment area of N'fis is characterized by a wide bare land (30% in 1987 and 27% in 2009), the rest of the area is composed by rainfed croplands, shrublands, grasslands, forest, rocky outcrops and croplands representing respectively in 1987: 27%, 16%, 11%, 8%, 5% and 2% and after 22 years, the percentage became consequently 11%, 24%, 14%, 9%, 4% and 11%. Table 1 illustrated the evolution of land use observed from 1987 to 2009. The most widespread change has been the transition of rainfed croplands (mostly are bare lands but transformed into land for wheat cultivation in wet periods) into grasslands and croplands. Croplands appears to be the surface with the greatest progress, with an evolution of 153 km2 (approximately a five-fold increase), land cover has experienced a decrease in the surface of croplands with a surface decreased by less than 267 km2 (58%). This decline can be attributed to the fact that the Moroccan government has moved towards strengthening agricultural land to rely on rainfall events that change more and more speed over the years. Indeed, the progress experienced by the area seems to be logical because, since the 1960s, the Moroccan government began a policy aiming the strengthening of hydraulic and agricultural infrastructures of the territory [14].

Figure 5: Example of the huge land cover change that experienced the area after the installation of the Lalla Takerkoust dam.
| Land Cover | LC 1987 (Km2) | LC 2009 (Km2) | Surface Evolution (Km) | Surface evolution (%) | Surface occupied 1987 (%) | Surface occulated 2009 (%) |
|---|---|---|---|---|---|---|
| Grasslands | 192.32 | 241.40 | 49.09 | 25.52 | 11.30 | 14.18 |
| Forest | 131.28 | 146.17 | 14.89 | 11.35 | 7.71 | 8.59 |
| Shrublands | 278.56 | 407.79 | 129.24 | 46.40 | 16.37 | 23.96 |
| Rainfed croplands | 449.95 | 188.15 | -261.80 | -58.18 | 26.44 | 11.05 |
| rocky outcrops | 91.66 | 72.93 | -18.73 | -20.43 | 5.39 | 4.29 |
| Bare areas | 513.92 | 456.92 | -57.00 | -11.09 | 30.20 | 26.85 |
| croplands | 39.85 | 183.91 | 144.06 | 361.53 | 2.34 | 10.81 |
Table 1: Evolution of land use observed in 1987 and 2009.
Precipitation is one of the most important parameters for vegetation growth [38]. Winter and summer precipitations show significant variations on different scales which have a strong impact on crops [39]. The Figure 5C shows the inter-monthly time series variations of NDVI and observed rain rate in the Lalla Takerkoust Dam 2000 to 2015. It can be observed that NDVI and rain rate both show a good periodic variation throughout the study period. In fact, the NDVI is more affected by the previous than the actual climate. Therefore, NDVI is related to the water availability, as higher vegetation index is found during good past rain and lower vegetation index are found during poor past rain. However, in the last 15 years, monthly precipitations appear to be constant, conversely, the NDVI shows a very significant increase, recording a rate of increase of NDVI of 13% over 15 years, these results give us evidence that the study area is experiencing growth in water mobilization so that it can be used to irrigate new agricultural areas and restore forests, and hence the expansion of these areas.
Change in soil erosion
By the multiplication of K factor map, R factor map, LS factor map, C factor map and P-factor map the map of soil erosion rate is obtained which present the annual soil loss on a pixel by pixel basis (20 × 20 m cell size) (Figures 6A and 6B). The estimated soil loss ranges from 0 to 16546 t/ha/year with a mean value of 42.07 and 36.59 t/ha/year between 1987 and 2009 respectively. Approximately 69.5% for 1987 and 61.6% for 2009 of the watershed areas has extreme to very severe soil loss (more than 20 t/ha/year), this corresponds largely to the areas located South East and South West of the basin characterized by very high slopes (>25°) and a lack of vegetation. The portion of the drainage basin featuring moderate to severe soil erosion rates (3-20 t/ha/yr) didn’t show a big change during the study period, it corresponds to the areas located in the centre of the basin and occupied for the years 1987 and 2009; 23.8% and 25.9% respectively. Areas subject to low and very low soil erosion represent 6.7% and 12.6% of the surface basin for 1987 and 2009 respectively, these areas are characterized by low slopes (<10°) and are in most of the time located in the north of the watershed. The evolution of this class of erosion is explained by the fact of the transformation of areas next to river characterized by high slope into contour terraces.

Figure 6: Predicted average annual soil erosion for the N’Fis watershed in 1987 (A), 2009 (B), change of soil erosion between 1987 and 2009 (C), Obtained by the application of RUSLE model.

Figure 7: Predicted average annual soil erosion for the N’Fis watershed in 1987 (A), 2009 (B), change of soil erosion between 1987 and 2009 (C), Obtained by the application of RUSLE model.
The soil erosion rate category on different land use types was developed in Table 2. The analysis shows that the bare areas, rocky outcrops and rainfed croplands were the areas dominating the study area overwhelmingly and owing to their large surfaces, steep slope and soils devoid of vegetation, they are are the major contributing areas in the soil loss; 76.87% and 62.96% of total soil loss in 1987 and 2009 respectively, The mean erosion rate of these areas is around 54 t/ha/yr classifying the zone as exposed to extreme erosion categories. Scrubland was the type of land cover that has the fourth high mean soil erosion~35 t/ha/yr (very severe erosion), with a mean contributing area of soil erosion of 475527.07 t/yr in 1987 to become 600094.59 t/ yr in 2009, this type of land use is characterize by sparse vegetation and most of the time developed at high altitudes under erodible soils. Grassland had a severe erosion rate (~25 t/ha/yr) but took up smaller proportion in the area (11% for 1987 and 14% for 2009) which reduces the soil loss (960367.72 t/yr in 1987 to 1422823.66 t/yr in 2009).
| 1987 | Grasslands | Forest | Shrublands | Rainfed croplands | Rocky outcrops | Bare areas | Croplands | Dam | Total area | |||
|---|---|---|---|---|---|---|---|---|---|---|---|---|
| Rate of erosion | Very low | 0 - 1 | 2,83 | 1,05 | 2,73 | 9,07 | 0,61 | 6,05 | 7,32 | 3,47 | 33,13 | 1.95% |
| Low | 1 - 3 | 7,27 | 6,80 | 9,72 | 30,95 | 0,38 | 19,91 | 5,20 | 0,49 | 80,70 | 4.74% | |
| Moderate | 3 - 5 | 7,51 | 6,82 | 9,51 | 18,02 | 0,34 | 21,51 | 4,61 | 0,24 | 68,57 | 4.03% | |
| High | 5 - 10 | 17,48 | 21,99 | 16,14 | 18,94 | 0,70 | 33,69 | 9,15 | 0,22 | 118,30 | 6.95% | |
| Severe | 10 - 20 | 43,03 | 62,55 | 32,95 | 35,02 | 1,16 | 35,04 | 8,53 | 0,04 | 218,32 | 12.83% | |
| Very severe | 20 - 40 | 92,32 | 29,63 | 105,30 | 90,61 | 2,69 | 71,03 | 2,27 | 0,01 | 393,85 | 23.14% | |
| Extreme severe | >40 | 21,89 | 2,44 | 102,21 | 247,33 | 85,80 | 326,70 | 2,76 | 0,00 | 789,12 | 46.36% | |
| Area (Km2) | 192,32 | 131,28 | 278,56 | 449,95 | 91,66 | 513,92 | 39,85 | 4,47 | 1702 | |||
| Min (t/ha/yr) | 0,01 | 0,01 | 0,01 | 0,02 | 0,09 | 0,01 | 0,01 | 0,14 | 0,01 | |||
| Max (t/ha/yr) | 16546,30 | 2275,57 | 15707,60 | 6268,35 | 7494,93 | 12563,40 | 1519,23 | 76,41 | 16546,29 | |||
| Mean (t/ha/yr) | 24,73 | 15,46 | 34,48 | 42,74 | 116,76 | 50,89 | 12,19 | 1,17 | 42,87 | |||
| Std | 49,86 | 11,84 | 39,54 | 34,55 | 75,69 | 44,82 | 26,96 | 2,61 | 47,36 | |||
| Soil loss (t/yr) | 475527,07 | 202973,70 | 960367,72 | 1923274,71 | 1070284,51 | 2615256,27 | 48561,86 | 523,47 | 7296769,31 | |||
| Soil loss (%) | 6,52 | 2,78 | 13,16 | 26,36 | 14,67 | 35,84 | 0,67 | 0,01 | ||||
| 2009 | Shrublands | Forest | Grasslands | Rainfed croplands | Rocky outcrops | Bare areas | Croplands | Dam | Total area | |||
| Rate of erosion | Very low | 0 - 1 | 4,80 | 2,11 | 4,24 | 3,45 | 0,39 | 3,76 | 42,93 | 3,46 | 65,14 | 3.83% |
| Low | 1 - 3 | 11,50 | 9,44 | 17,00 | 13,77 | 0,26 | 18,82 | 77,28 | 0,51 | 148,59 | 8.73% | |
| Moderate | 3 - 5 | 11,25 | 8,91 | 15,95 | 7,22 | 0,22 | 20,67 | 36,84 | 0,29 | 101,37 | 5.96% | |
| High | 5 - 10 | 21,70 | 23,85 | 23,20 | 7,70 | 0,50 | 31,73 | 11,16 | 0,34 | 120,19 | 7.06% | |
| Severe | 10 - 20 | 45,80 | 69,04 | 43,14 | 14,58 | 1,04 | 33,78 | 11,26 | 0,09 | 218,72 | 12.85% | |
| Very severe | 20 - 40 | 116,47 | 31,66 | 146,87 | 38,78 | 2,23 | 65,99 | 3,55 | 0,02 | 405,57 | 23.83% | |
| Extreme severe | >40 | 29,88 | 1,16 | 157,38 | 102,64 | 68,29 | 282,17 | 0,89 | 0,01 | 642,42 | 37.75% | |
| Area (Km2) | 241,40 | 146,17 | 407,79 | 188,15 | 72,93 | 456,92 | 183,91 | 4,72 | 1702 | |||
| Min (t/ha/yr) | 0,00 | 0,00 | 0,00 | 0,02 | 0,00 | 0,00 | 0,00 | 0,00 | 0,00 | |||
| Max (t/ha/yr) | 16546,30 | 4313,09 | 6969,99 | 4656,49 | 5778,05 | 12563,40 | 1572,39 | 1383,11 | 16546,29 | |||
| Mean (t/ha/yr) | 24,86 | 14,54 | 34,89 | 42,31 | 120,06 | 49,24 | 3,83 | 1,74 | 36,59 | |||
| Std | 49,45 | 12,36 | 28,62 | 31,87 | 68,85 | 42,10 | 7,77 | 13,83 | 43,37 | |||
| Soil loss (t/yr) | 600094,59 | 212566,58 | 1422823,66 | 796027,12 | 875633,96 | 2250003,70 | 70425,69 | 821,49 | 6228396,79 | |||
| Soil loss (%) | 9,63 | 3,41 | 22,84 | 12,78 | 14,06 | 36,12 | 1,13 | 0,01 | ||||
Table 2: Soil erosion rate estimated by the RUSLE model for each land use.
The increase observed in soil loss on grassland and shrublands can be explained by the fact of the transformation of areas vulnerable to erosion (rainfed croplands and bare areas) into shrubs, grasses, herbs, and geophytes. The objective of this huge transformation made by the Moroccan government was specifically to build constant nutrition source for livestock. Comparatively, the forest had a relatively low erosion rate ~15 t/ha/yr, this type of area didn’t know a big change during the studied period in term of surface and soil erosion change, and it has a low contributing soil loss (3% of the total area). This situation is achieved because of the permanent forestation aiming to remedy the problem of forest fires touching the study area each year (Figure 7).

Figure 7: Example of the huge land cover change that experienced the area after the installation of the Lalla Takerkoust dam.
Previous studies showed that with the increased vegetation coverage, the soil properties were improved, changing thus, the water cycle of the region, increasing evapotranspiration and reducing surface runoff [40,41]. The big change that cropland has experienced has a direct impact on soil erosion; the erosion passed from 12.19 t/ ha/yr in 1987 to become 3.83 t/ha/yr in 2009. This huge change is attributed to the reduction in soil erosion loss in the watershed due to the transformation of rainfed croplands and bares area near the rivers in agricultural lands as contouring terraces through the adjustment of slope and implementation of plants. Using the RUSLE model to study the impact of land cover change on soil erosion in the Loess Plateau in central China (similar semi-arid region) from 2000 to 2010 [42] found that the steadily increased vegetation cover leads to gradually decreased soil erosion rates, this conclusion converge with our results; the Figure 6C summarized the evolution of soil erosion in the studied period, according to these resulting maps, 2% of the study area experience an increase of soil erosion rate, 23% experience a decrease and the rest 75% is considered as stable in terms of soil erosion.
Change of soil loss and validation
Excluding the work led by Liu et al. [43] which is based on a purely descriptive study, there is a real handicap in terms of previous work in the western High Atlas basins watershed. Thus, to validate the model applied, the annual average of the sediment yield derived from the reservoir sediments was used. The methodology applied is based on the made to compare the values of the SEDD model with the annual average of siltation before and after the construction of the Ouirgane dam. The application of SEDD reveals that in 1987 the gross erosion rates was 6.52 t/ha/yr decreasing to become 4.03 t/ha/yr of soil loss in 2009 (Figures 8A and 8B). The Ouirgane dam will receive a suspended sediment yield of 0.59 t/year corresponding to a gross erosion rate of 4.84 t/ha/year, while the dam Lalla Takerkoust will receive a suspended sediment yield of 0.10 t/year with a gross erosion rate of 2.03 t/ha/year.

Figure 8: Predicted annual soil loss for the N’Fis watershed in 1987 (A) and 2009 (B) Obtained by the application of SEDD model.
For the studied period, a 33% decrease in total sediment yield was detected from 1981 to 2009, this decrease is directly related to the huge change affecting the land cover, this évolution will not only reduce the potential soil erosion but also, will favourite the sedimentation phenomenon before reaching the dam while decreasing the sediment delivery ratio, the decrease of SDR has passed from a mean of 15.77% in 1987 to became 12.35% in 2009. Sediment yield data were derived from sediment volume estimations that resulted from comparing bathymetric surveys of the Ouirgane and Lalla Takerkoust reservoir. For the Lalla Takerkoust reservoir, the series of the bathymetric survey was taken in 1981, 1988, 1991, 1995, 1999, 2004, 2008 and 2012, with the effectuation of several dredging companions between 1999 and 2004, concerning the Ouirgane reservoir, the series of the bathymetric survey was taken in 2008 and 2011. The different measures carried out have been transformed into graphs in the objective of a better understanding and interpreting the evolution of siltation, the methodology chosen, we chose the methodology adopted by Bachaoui et al. [44]. The basic notion is based on the characterization of the volumetric law of reservoirs by studying the deep relationship of the water deep and volume.
For the reservoir Lalla Takerkoust, bathymetric data analysis show that the sedimentation of the reservoir seems to have a tendency to decrease over the years, especially after the construction of the Ouirgane dam or trend declined further, the build of the Ouirgane dam will decrease the loss of water capacity storage on the Lalla Takerkoust reservoir that achieved in 2012 a loss of 27% of loss. In term of sedimentation, before building the Ouirgane dam, the average annual sedimentation in the Lalla Takerkoust reservoir was 1.19 million m3/ year over the 18 years between 1981 and 1999 and corresponding to a soil loss of 10.49 t/ha/year. After the building of the dam of Ouirgane, the average annual reservoir sedimentation on Lalla Takerkoust dam become 0.18 Million m3/year corresponding to a calculated annual sediment yield of 5.49 t /ha/year between 2004 and 2012. Regarding the Ouirgane dam, the average annual reservoir sedimentation was 0.54 mm3/year between 2008 and 2012 corresponding to a soil loss of 7.58 t/ ha/year. The decrease of the observed suspended sediment yield due to the growth of covered lands was highlighted in other studies in semiarid regions [45] (Figure 9).

Figure 9: The series of bathymetric survey taken in Lalla Takerkoust reservoir (A) and Ouirgane reservoir (B)
The Figure 10 summarize results of simulated and observed soil loss, the values of the observed sediment yield remain high regarding the observed ones, The SEDD based on RUSLE model and SDR coefficient mostly do not consider gully erosion, stream bank erosion, mass wasting (landslides) coincide with the conclusions reached by Japan International Cooperation Agency [21], the case here for the study area where this type of land degradation dominates frequently (Figure 11). For example, the research leads by Joanne and Stuart, Zhao et al. [39,46] for the Mediterranean area provide that only gully erosion may produce erosion rates from 1.1 to 455 t/ha/yr. Thus, to model valid sediment fluxes, knowledge of the types of erosion governing the area must be recognized [47]. To reach this objective, a better understanding of the contribution of the various erosive processes to the formation of the final sediment yield value in a drainage watershed is indispensable [21]. This needs a full identification of the soil erosion hotspots that are still unknown in complex landscapes such as the Moroccan ones. The linear correlation between predicted and observed sediment loss (Figure 10) reveals a linear correlation of R2=0.94, connected through the equation observed sediment loss:

Figure 10: The observed compared to the calculated soil loss.

Figure 11: Example of gully soil erosion experiencing the area.
Observed Sediment Loss=1.08 × Predicted Sediment Loss + 3.05
This result leads us to conclude that the model results could be corrected by adding 3 t/ha/yr, this difference observed could be explained by the participation in sedimentation of rill and interrail erosion very well-known in the study area. The result found in this work goes with the results initiated by Parsons et al. [48]. Based on the siltation measurements data obtained from fifteen watersheds in Morocco [48] on his work entitled water erosion in Morocco its calculation and its control, has proved that a modification of the land cover has an extremely marked influence on the surface soil erosion, but this only contributes to a small part to the global erosion contributing to the silting of the dam.
With the fact that there is a clear limitation of quantitative studies in the area; [19] is almost the only one treating soil erosion risk using a quantitative model. By the application of the RUSLE model and using another approach on the most important watershed of Morocco [49] reported nearly the same rates of the potential soil erosion, with the highest values are observed in south where dominates land with steep slopes. They also reported that in order to have valuable RUSLE model predictions it is necessary take into consideration mass movement. Soil erosion phenomenon receive increasing attention from policy makers and scientists [50-52]. As the studied area is characterized by poor socioeconomic infrastructure, frequent droughts and degraded agricultural lands, this quantitative-evolutionary study of soil erosion rates is crucial to develop management plans to deal with on-site and off-site impacts of erosion. The on-site impacts refer to the decline of soil organic matter content, soil structure soil and loss, leading to decay in water-holding capacity, soil fertility and ultimately to a reduced vegetation cover and food security [53,54]. The off-site impacts refer principally to the sedimentation of artificial water reservoirs in the downstream, thus, reducing the storage capacity, sealing the drainage devices and impact the stability of the construction.
Conclusion
This study analyzed the temporal changes in land use in a semi-arid region (N’Fis Watershed, Western High Atlas of Morocco, from 1987 to 2009), its impact on soil erosion and then reservoir sedimentation. The SEDD, and RUSLE model was applied to assess the effects of land use changes and check dams facing the climate change experiencing the area characterized by a semi-arid climate. The application of RUSLE in GIS environment can be cost-saving and time-saving to estimate soil erosion over a large area, on the other hand it requires a certain number of data that should cover the study area, and that it’s very difficult if not impossible to find in such developing zone with poor resources in terms of equipment, for this, the products of the new establish databases; MODIS TRMM Soilgrids, can offer a real solution to solve the problem of the lack of data. The results of the applied approach shows that sizable sectors of the study region are potentially prone to very severe soil erosion rates which coincide with steep slopes, it also reveals that spatial annual average erosion rate decrease over the years due the significant changes experienced by the land uses, for this purpose the spatial annual average erosion rate has gone from 42.87 t/ ha/yr in 1987 to 36.59 t/ha/yr in 2009, with an annual decrease of 0.29 t/ha/yr.
The sediment delivery ratio has also known a decrease due to land use change, recording an annual decrease of 0.16 between 1987 and 2009, thus, and according to SEDD model, the soil loss has also known a great diminution, passing from 6.52 t/ha/yr to become 4.03 t/ha/yr. The observed sediment yield in reservoirs show higher values compared to those predicted through the different series of bathymetric missions, we could calculate the real soil loss, these losses decrease from 10.49 t/ha/yr in 1987 to 6.98 t/ha/yr in 2009. The results of the quantitative analysis observed and simulated of soil erosion risk lead us to conclude that the SEDD-based model can provide valid sediment yield if adding sheet and rill processes (3 t/ha/yr) it can provide valuable estimates of the spatial distribution of soil erosion risk and then the factors influencing erosion including land use evolution. During the studied period, land use knows a huge evolution after the implementation of the Green Morocco Plan “Plan Maroc Vert”, dam construction policy and ORMVAH, this policy seems to have a direct effect on reducing the soil erosion rates and consequently, reduce the sedimentation in dam, and thereby, mobilize more water for irrigation and the creation of new agricultural land. This research uses new remote sensing parameters and exhaustive modern geospatial methods to study the land cover change and its impact on soil erosion. It will not only be most comprehensive and accurate than those derived in previous assessments, but also build a solid dataset for decision makers and regional policy.
Acknowledgements
The financial support is provided by the CNRST “Projets dans les domaines prioritaires de la recherche scientifique et du développement technologique” (Ref. PPR1/2015/63). The authors gratefully acknowledge the HCEFLCD (Haut Commissariat aux Eaux et Forêts et à la Lutte Contre la Désertification), the DREF (Direction Regionale des Eaux et Forêts–Tensift Al Haouz) and ABHT (Agence du Bassin Hydraulique de Tensift) for providing the data used in this study. The first author receives a scholarship from the National Center for Scientific and Technical Research (CNRST-Morocco) that we also like to thank. We thank the anonymous reviewers for the remarks which have helped in improving the manuscript.
References
- FAO Statistical Yearbook (2013) World Food and Agriculture Food and Agriculture Organization of the United Nations, Rome. pp: 217
- Araya A, Stroosnijder L, Girmay G, Keesstra SD (2011) Crop coefficient, yield response to water stress and water productivity of teff (Eragrostis tef (Zucc.). Agric Water Manag 98: 775-783.
- Oftadeh E, Shourian M, Saghafian B (2016) Evaluation of the Bankruptcy Approach for Water Resources Allocation Conflict Resolution at Basin Scale, Iran’s Lake Urmia Experience. Water Resour Manag 30: 1-15.
- WCD (2000) Dams and development: A new framework for decision-making, Current opinion in obstetrics and gynecology. (1st edn). London, United Kingdom.
- Poesen JWA, Hooke JM (1997) Erosion, flooding and channel management in the Mediterranean environments of southern Europe. Prog Phys Geogr 21: 157–199.
- Boix-Fayos C, Martinez-Mena M, Calvo-Cases A, Arnau-Rosalén E, Albaladejo J, et al. (2007) Causes and underlying processes of measurement variability in field erosion plots in Mediterranean conditions. Earth Surf Process, Landforms 32: 85-101.
- Wang X, Zhao X, Zhang Z, Yi L, Zuo L, et al. (2016) Assessment of soil erosion change and its relationships with land use/cover change in China from the end of the 1980s to 2010. Catena 137: 256-268.
- Ochoa PA, Fries A, MejÃa D, Burneo JI, RuÃz-Sinoga JD, et al. (2016) Effects of climate, land cover and topography on soil erosion risk in a semiarid basin of the Andes. Catena 140: 31-42.
- Schilling J, Freier KP, Hertig E, Scheffran J (2012) Climate change, vulnerability and adaptation in North Africa with focus on Morocco. Agric. Ecosyst Environ 156: 12-26.
- Iglesias A, Mougou R, Moneo M (2011) Towards adaptation of agriculture to climate change in the Mediterranean. Reg Environ Change 11: 159–166.
- Fan J, Morris GL (1992) Reservoir sedimentation. I: Delta and density current deposits. J Hydr Engrg 118: 354–369.
- Maroc (2011) Integrating climate change into the implementation of the Green Morocco Plan. Ministry of Agriculture and Maritime Fisheries and Agency for Agricultural Development.
- REEM (2001)Â Report on the state of the environment of Morocco pp: 34.
- Benhadi A (1975) La politique marocaine des barrages, Moroccan National Documentation Center.
- Maroc (2008) Green Morocco plan: First perspectives on the agricultural strategy. Ministry of Agriculture and Rural Development, Morocco.
- Maroc (2008) Agricultural plan by region - Souss Massa Drâa Region - ADA.
- Simonneaux V, Cheggour A, Deschamps C, Mouillot F, Cerdan O, et al. (2015) Land use and climate change effects on soil erosion in a semi-arid mountainous watershed (High Atlas, Morocco). J Arid Enviro. 122: 64–75.
- Gourfi A, Daoudi L, Shi Z (2018) The assessment of soil erosion risk, sediment yield and their controlling factors on a large scale: Example of Morocco. J Afr Earth Sci 147: 281-299.
- Hessel R, Daroussin J, Verzandvoort S, Walvoort D (2014) Evaluation of two different soil databases to assess soil erosion sensitivity with Mesales for three areas in Europe and Morocco. Catena 118: 234-247.
- Japan International Cooperation Agency (JICA) (2007) Ministry of Spatial Planning, Water and Environment (MATEE), Tensift Hydraulic Basin Agency (ABHT) Study of the integrated management plan for water resources in the Haouz plain Kingdom of Morocco Main Report pp: 3-13.
- Borrelli P, Märker M, Panos Panagos P, Schütt B (2014) Modeling soil erosion and river sediment yield for an intermountain drainage basin of the Central Apennines, Italy. Catena 114: 45-58.
- Renard KG, Foster GR, Weesies GA, McCool DK, Yoder DC (1997) Predicting soil erosion by water: a guide to conservation planning with the Revised universal soil loss equation (RUSLE). USDA agricultural handbook pp: 703.
- Ferro V, Paolo P (2000) Sediment Delivery Distributed (SEDD) model. J Hydrol Eng 5: 411-122
- Fernandez CJQ, Wu DK, Mc Cool P, StÓ§ckle CO (2003) Estimating water erosion and sediment yield with GIS, RUSLE, and SEDD. J Soil Water Conserv 58: 128-136.
- Adler-Golden S, Berk A, Bernstein LS, Richtsmeier S, Acharya PK (1998) A Modtran4 atmospheric correction package for hyperspectral data retrievals and simulations. AVIRIS Workshop Proceedings.
- Holben BC (1981) An examination of spectral band rationing to reduce the topographic effect on remotely sensed data. Int J Remote Sens 2: 115-133.
- Wischmeier WH, Smith DD (1978) Predicting rainfall erosion losses - A guide to conservation planning. Washington DC, USDA Department of Agriculture Science and Education Administration, USA. pp: 163.
- Sharpley AN, Williams JR (1990) EPIC-Erosion/Productivity Impact Calculator: 1. Model Documentation. Washington DC, USDA Department of Agriculture Technical Bulletin, USA. pp: 235.
- Hengl T, Heuvelink GBM, Kempen B, Leenaars JGB, Walsh MG, et al. (2015)Â Mapping Soil Properties of Africa at 250 m Resolution: Random Forests Significantly Improve Current Predictions. PLoS ONE 10: 0125814.
- Arnoldus HMJ (1977) Methodology used to determine the maximum potential average annual soil loss due to sheet and rill erosion in Morocco. Assessing Soil Degradation, FAO Soil Bulletin 34: 39-51.
- Desmet P, Govers G (1996) A GIS procedure for automatically calculating the USLE LS factor on topographically complex landscape units. J Soil Water Conserv 51: 427-433.
- Van der Knijff JM, Jones RJA, Montanarella L (2000) Soil erosion risk assessment in Europe. EUR 19044 EN. Office for Official Publications of the European Communities, Luxembourg. pp: 34.
- Shi ZH, Cai CF, Ding SW, Wang TW, Chow TL (2004) Soil conservation planning at the small watershed level using RUSLE with GIS: a case study in the Three Gorge Area of China. Catena 55: 33-48.
- Boyce FM (1975) Heat content of Lake Ontario and estimates of average surface heat fluxes during IFYGL. Manuscript Rept, Can Ctr Inland Waters, Burlington Ontario.
- Ferro V, Minacapilli M (1995) Sediment delivery processes at basin scale. Hydrolog Sci J 40: 703-717.
- Ferro V (1997) Further remarks on a distributed approach to sediment delivery. Hydrolog Sci J 42: 33-647.
- Haan, CT, Barfield BJ, Hayes JC (1994) Design Hydrology and Sedimentology for SmaIl Catchments. Academic Press, San Diego, California pp: 501-504.
- Joanne MN, Stuart RP (1993) Assessment of Relationships between Precipitation and Satellite Derived Vegetation Condition Within South Australia. J Geogr Stud 2: 180-195.
- Preethi B, Revadekar JV (2012) Kharif foodgrain yield and daily summer monsoon precipitation over India. Int J Climatol 33: 1-9.
- Yan R, Zhang XP, Yan SJ, Zhao WH (2016) Topographical distribution characteristics of vegetation restoration in the Beiluo River Basin from 1995 to 2014. J Northeast Univ Nat 37: 1599-1603.
- Yan R, Zhang X, Yan S, Chen H (2018) Estimating soil erosion response to land use/cover change in a catchment of the Loess Plateau, China. J Soil Water Conserv 6: 13-22.
- Liu BY, Nearing MA, Risse LM (1994) Slope gradient effects on soil loss for steep slopes. Transactions of ASAE 37: 1835-1840.
- Bachaoui B, Bachaoui E, El-Harti A, Bannari A, El-Ghmari A (2007) Mapping of zones at Risk of water erosion: Example of the high atlas moroccan. Remote Sens 7: 393-404.
- Molle F (1991) Characteristics and potentialities of the Açudes of the Brazilian Nordeste. PhD thesis, univ. Montpellier-II pp :380.
- Zhao GJ, Kondolf GM, Mu XM, Han MW (2017) Sediment yield reduction associated with land use changes and check dams in a catchment of the Loess Plateau, China. Catena 148: 126-137.
- Poesen J, Vanwalleghem T, de Vente J, Knapen A, Verstraeten G, et al. (2006) Gully erosion in Europe. In Soil Erosion in Europe, Boardman J, Poesen J. (Ed.). Chichester, John Wiley & Sons, Ltd UK.
- Parsons AJ, Wainwright J, Brazier RE, Powell DM (2006) Is sediment delivery a fallacy? Earth Surf Process Landf 31: 1325-1328.
- Heusch B (1970) Estimation and control of hydraulic erosion. Soc Sci Phys Morocco pp : 41-54.
- EC (2002) Towards a Thematic Strategy for Soil Protection. Commission of the European Communities, Brussels pp: 1-29.
- MEA (2005) Millennium Ecosystem Assessment, Ecosystems and HumanWell-Being: Desertification Synthesis. World Resources Institute, Washington DC, USA.
- UNCCD (2008) The 10-year strategic plan and framework to enhance the implementation of the Convention UNCCD (2008–2018). (Eds). Bogdandy and wolfrum, Netherlands 12: 287-300.
- Crosson P (1997) Will erosion threaten agricultural productivity? Environment 39: 4-31.
- Stocking MA (2003) Tropical soils and food security: The next 50 years. Science 302: 1356-1359.
Citation: Gourfi A, Daoudi L (2019) Effects of Land Use Changes on Soil Erosion and Sedimentation of Dams in Semi-Arid Regions: Example of N'Fis Watershed in Western High Atlas, Morocco. J Earth Sci Clim Change 10: 513.
Copyright: © 2019 Gourfi A, et al. This is an open-access article distributed under the terms of the Creative Commons Attribution License, which permits unrestricted use, distribution, and reproduction in any medium, provided the original author and source are credited.
Select your language of interest to view the total content in your interested language
Share This Article
Recommended Journals
Open Access Journals
Article Usage
- Total views: 4449
- [From(publication date): 0-2019 - Nov 05, 2025]
- Breakdown by view type
- HTML page views: 3547
- PDF downloads: 902