Empirical Estimation of Hourly Incoming Shortwave Radiation over the North Indian Ocean
Received: 25-Oct-2013 / Accepted Date: 03-Dec-2013 / Published Date: 10-Dec-2013 DOI: 10.4172/2157-7617.1000176
Abstract
Hourly estimation of incoming shortwave radiation formulae have been developed and given by many scientists. The empirical formulae have to be updated with the latest realistic data. Using Lumb procedure, author attempted to give new regression coefficients for incoming shortwave radiation with in situ observations made during Arabian Sea Monsoon Experiment (ARMEX) cruises over North Indian Ocean for different cloud amounts (from clear sky to overcast conditions). ARMEX field work program has been conducted in June-August 2002 and March-June, 2003 on board R/V “Sagar Kanya”. The shortwave radiation data has been collected using the Albedometer, which is covering entire cloud amounts. Empirical formulae have been developed using sine of solar altitude (sin (h)) with respect to different could amounts. Newly developed Empirical Formulae are better and more accurate as is evidenced by standard deviation. However newly developed empirical formulae are compared with other formulae given by other scientists. The empirical formulae have been compared with available observed data from Bay of Bengal Monsoon Experiment (BOBMEX) and NCEP re-analyzed data. With BOBMEX data is in agreement, however with NCEP showing lower values.
Keywords: Shortwave radiation; Cloud; Transmission factor; Sin h; Empirical coefficients
5660Introduction
Changes in the oceanic heat budget and transport is having great importance to understand the Indian climate and predicting its short and long term changes. Surface heat fluxes are the key component in determining the oceanic heat budget and transport [1]. The climatology of ocean–atmosphere energy fluxes based on ship observations remains the most important source of global permanent information about the interaction of Ocean and atmosphere [2]. The surface shortwave radiative fluxes are the basic parameter for radiation budget. Incoming shortwave radiation over the ocean surface is one of the major component affecting land and ocean surface heating, however it plays a vital role in understanding the ocean-atmosphere interactions. Direct measurements of radiative (shortwave) fluxes over the Indian Ocean are sparse. As a result, the importance of radiative fluxes in the overall determination of net surface heat fluxes is not clear in understanding the ocean-atmosphere coupling. After advent of satellite technology, the incoming shortwave radiation at the ocean surface has been estimated using satellite measurements. However, the development of satellite techniques for estimating the incoming shortwave radiation will depend crucially on the capability of calibrating the satellite estimated with insitu measurements in the region of study [3,4]. At present several flux products are available, but all have uncertainties [1].
The most commonly used empirical formulae for estimating the Incoming shortwave radiation over the Indian Ocean are those developed by [5-11]. The widely used formulae are developed using the data over the Atlantic and Pacific Oceans in the extra tropics. A problem with such empirical coefficients may not be suitable or relevant for other climatic regimes and tropical latitudes. Their validity and accuracy remain undemonstrated for the tropics in general, and for the Indian Ocean in particular.
Even though there have been numerous formulae, significant disagreement exists currently between the standard measurements and estimates from the formulae even for clear sky conditions [8,9,12]. India Meteorological Department (IMD) and Indian Institute of Tropical Meteorology (IITM) have developed empirical formulae for estimating the Incoming shortwave radiation over the Indian subcontinent [13,14]. The formulae developed over the land may not be suitable to use at sea, since the sea surface generates cloud regimes different from those generated over land [15]. The aerosols in the atmosphere reduce the total radiation on land when compared with that over the Sea at the same latitude. There is a great need to develop parameterization on shorter time scales for the marine conditions. Large volumes of observations under different weather and climate conditions allow developing a rather comprehensive parametric model for indirect estimation of short-wave radiation at different latitudes in the ocean.
In the hourly formulae [15-18] the cloud factor is directly incorporated. In the present article author is discussing about the parameterization and comparison of shortwave radiation using the observed shortwave radiation data collected in northern Indian Ocean. The newly developed regression coefficients include the effect of clouds amount and aerosols effect, but the effect of cloud amount presented. The shortwave radiation values are estimated in this article by taking recourse to modelling, which are compared with in situ values.
Data and Methodology
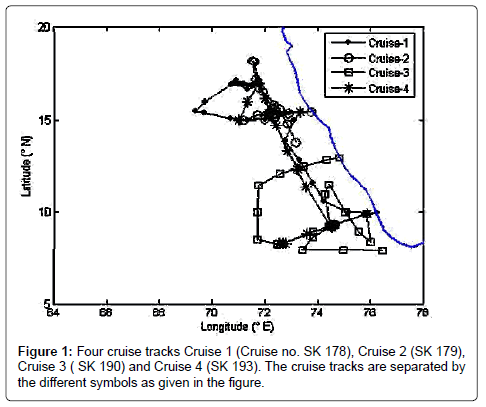
The shortwave radiation parameters have been recorded with the Kipp & Zonen Albedo meter, which measures radiation in the spectrum of 0.3 to 3 μm. The field of view of the instrument is 180°, which ensures radiation measurement from both the upper and the lower hemispheres. Parallel observation of meteorological parameters data have been collected during the four cruises in the ARMEX field experiment program (cruise tracks are given in the Figure 1). The experimental arrangement on board [19] consists of the Albedometer suspended on a boom extending out about 5m horizontally in front of the bow. They are connected through cables of 10m length to the Data logger, placed on the deck. Radiation fluxes have been measured for every 5 minutes; later data has been averaged for one hour.
Measurement of shortwave radiation with albedometer
The incoming and reflected shortwave radiation can be measured, when the outputs from the two sensors of the albedometer are recorded separately. With the two sensors connected in anti-series, the net global radiation is measured (spectral range 0.3-30 μm). The irradiance (Wm- 2) value can be simply computed by multiplying the output signal (V) of the albedometer with the reciprocal of the sensitivity figure (calibration factor, K).
Irradiance (W/m2) = V* 1/K (1)
The two sensors of the Albedometer (upper & lower) are well calibrated. These sensors are also calibrated at IMD, Pune and their values are almost similar to those given by the manufacturer. Hence, the original calibration factors as given by the manufacturer have been used in the conversion of voltages in to irradiance.
The performance and accuracy of the radiometer sensors of Kipp & Zonen have been compared with those of Epply at CAOS, Indian Institute of Science, Bangalore and (has been) found that both are in good agreement [20,21].
Formulae for different cloud amounts
The incoming shortwave radiation at the top of the atmosphere can be considered as a constant (Solar constant). It undergoes various changes and absorptions in the path while travels through the atmosphere. The solar altitude (h) varies in the day time depending on the zenith angle of the Sun. The cloud clusters hovering also influence the shortwave radiation. The model estimates are a function of insulation and transmission factor. Transmission factor is a function of solar altitude and cloud amount. Solar altitudes are estimated during the day time and cloud amount has been observed for every hour. So the transmission factor is also calculated for every hour. The Shortwave radiation (QSW↓) data is classified into 9 categories as clear sky (0 Oktas) to overcast in (8 Oktas). Then, the clear sky or cloudy sky regression coefficients are developed to estimate the incoming short wave radiation over the ocean surface.
Empirical formulae are developed from the in-situ data for determining the Shortwave radiation at the ocean surface on hourly and hence daily values of total solar radiation from a knowledge of total cloud amount reported, in terms of the atmospheric Transmission Factor (TF), Shortwave radiation observed at the ocean surface QSW↓ and the radiation incident at the top of the atmosphere (QT) following the Lumb [16] theme as:
T.F = QSW↓/ QT (2)
T.F = Ai + Bi Sin h (3)
where Ai & Bi are regression coefficients for different total cloud amounts with i = 0 to 8 Oktas Ai and Bi are determined by least square method. Sin h is the sine of solar altitude.
T.F. is strongly dependent on Sin h and cloudiness.
QT = (d/d)2 x S0 x Sin h (4)
QT is the radiation at the top of the atmosphere
S0 is solar constant
(d/d)2 is earth – sun distance correction Sin h =sin(Φ) sin(d) + cos(d) cos(ω)
h is computed as a function of latitude (Φ)
d is declination [d = -22.45 cos (t) where t is the Julian day]
ω hour angle of the sun [ω=15*(12-time)]
From the Shortwave radiation (QSW↓) measured during ARMEX period and the corresponding values of QT calculated from formula 4, the values of TF are obtained from formula 3. In the present study, the distance correction is also incorporated while calculating the TF. The distance correction accounts for about ± 3.3% of variation in the solar radiation at the top of the atmosphere. Thus, the present model is a slightly improved model.
Results and Discussions
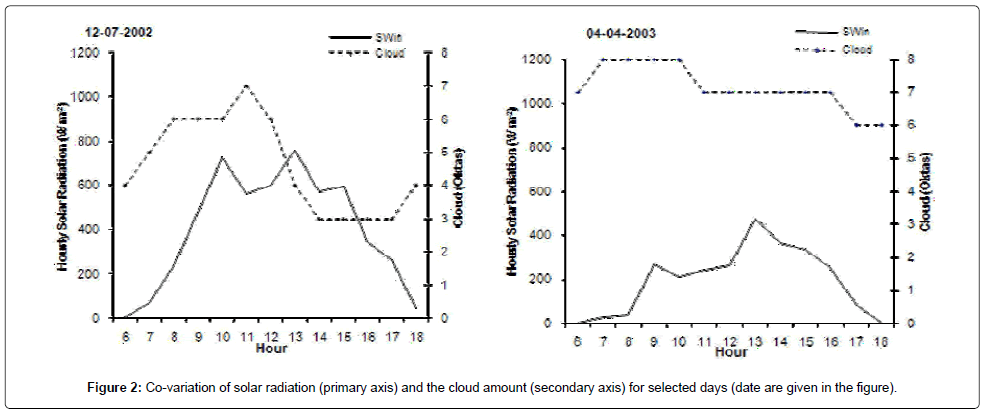
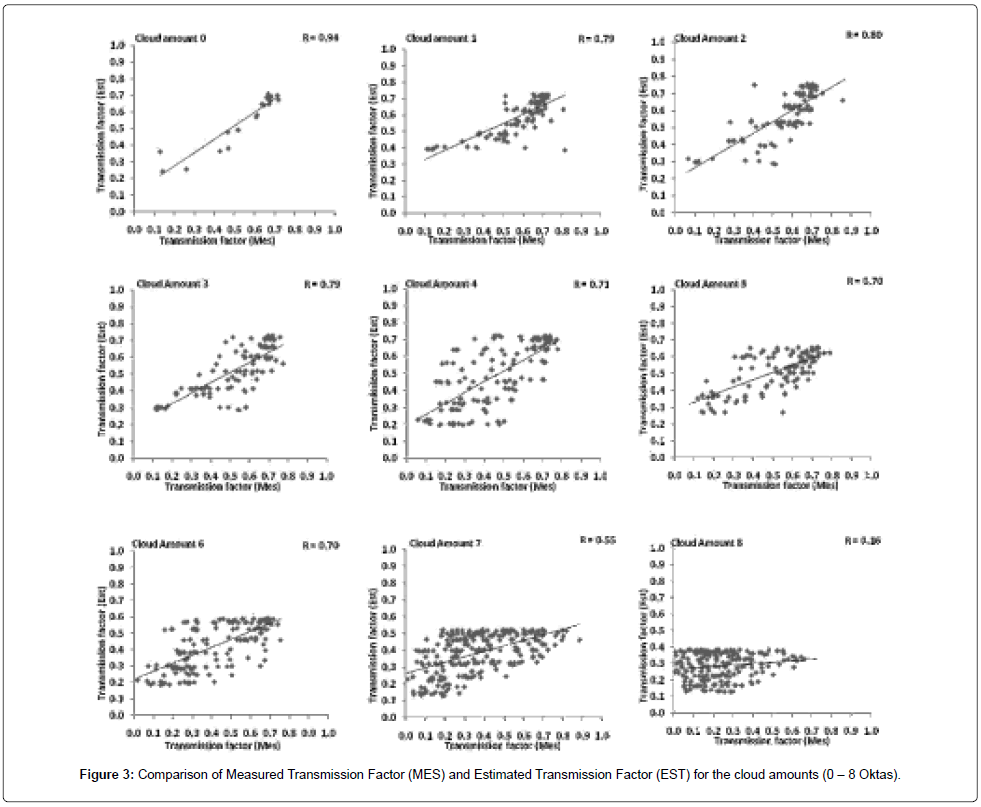
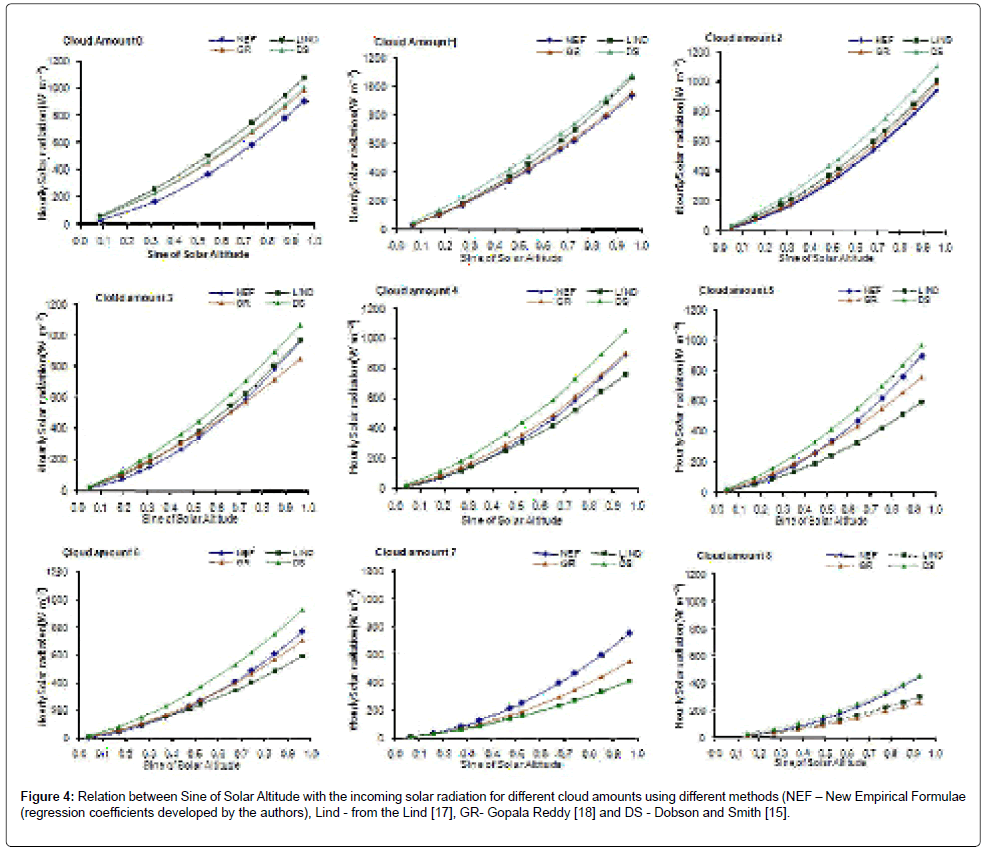
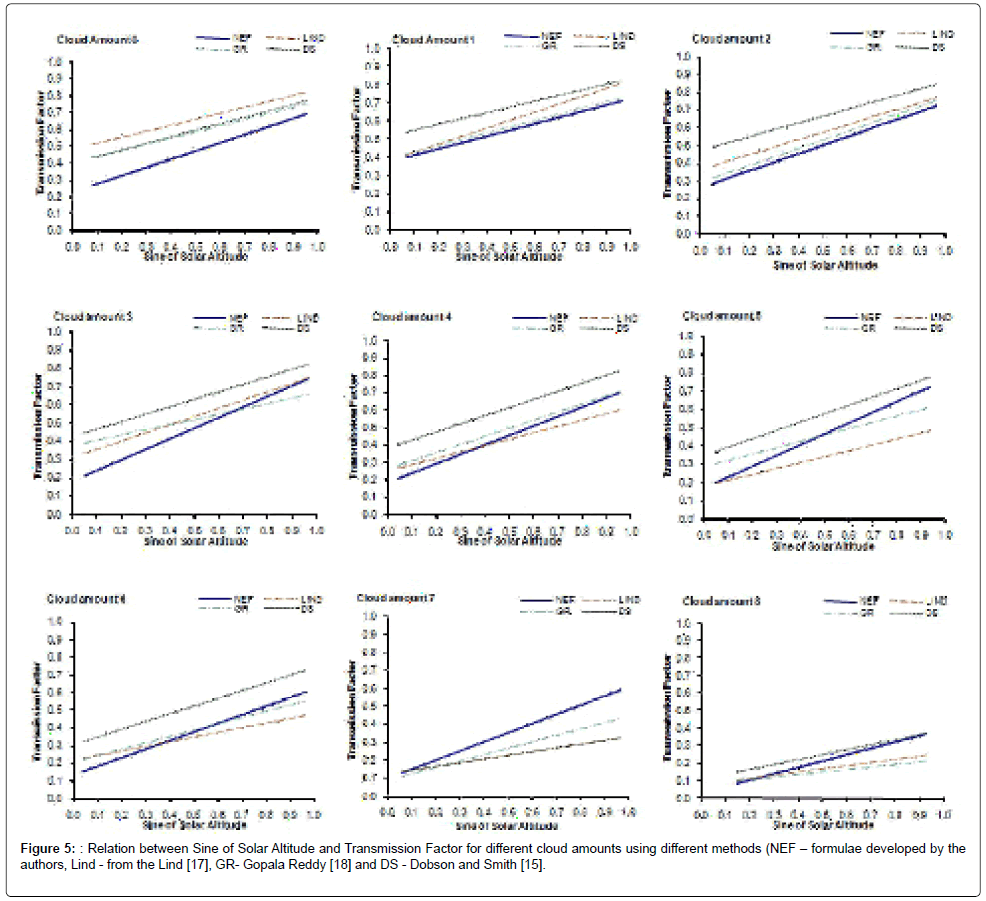
It is well known that cloud feedback strongly regulates the solar radiation and having inverse relation and is shown in the Figure 2. The new regression coefficients are estimated using the recently observed ARMEX data and given in the Table 1. Comparison between the measured transmission factor and the estimated transmission factor for the cloud amounts from clear sky (0 oktas) to overcast condition (8 oktas) are given in the Figure 3. The most noteworthy feature is that the estimated transmission factor with the new regression coefficients co-varies more or less similar with the measured transmission factor for the cloud regimes from 0 to 6 Oktas. While it is shows a drastic reduction for the cloud amounts 7 and 8 Oktas. The measured and the estimated transmission factor varies between 0.01 – 0.98 and 0.13 – 0.76 respectively. Higher scatter and sharp reduction in the transmission factor can be observed under overcast conditions (8 okta) with heavy rainfall events occurred during the study period. Figure 4 depicts the variation of sin (h) with shortwave radiation for different cloud amounts, which show more or less linear and direct variations. As the cloud amount increases, the dependence of sine of solar altitude also starts increasing. However, the dependence of transmission factor with the variation of solar hour angle (Figure 5) is not that high and shows a linear trend of variation between 0.3 and 0.6 with the hour angle from 0 to 1. However, it should also be pointed out that, present to the estimations of Gopala [18]. With cloud amount 7 the present estimations are definitely higher than the other estimations. The present estimations are well within the estimations of other formulae for the cloud amounts 5 and 8 are confirmed by the diagram.
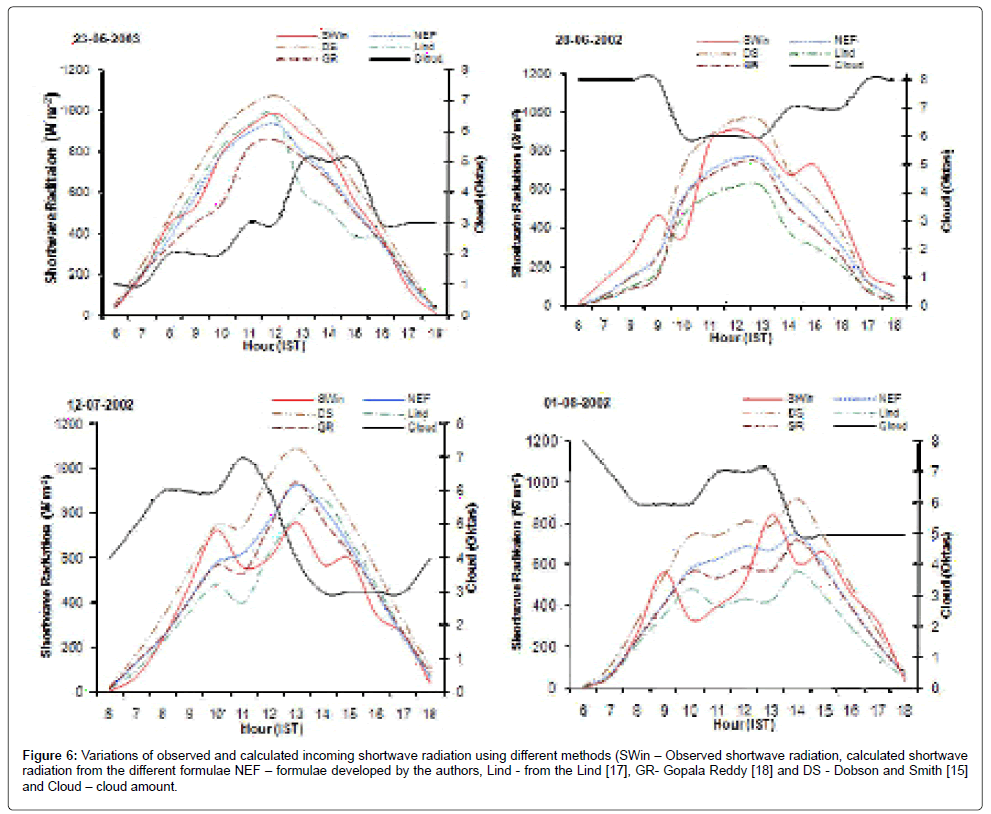
The variations of the observed shortwave radiation with the developed formulae and previously developed formulae for the random dates are given in Figure 6. The shortwave radiation calculated by using Dobson [15] formula is proved to be the higher values than the observed values, however GR formulae are showing the lower values during overcast, and higher value when the cloud is low. From the Lind formulae the shortwave radiation is showing the lower side except when there is a clear sky. The present derived formulae are comparably good consideration than the other formulae.
Figure 6: Variations of observed and calculated incoming shortwave radiation using different methods (SWin – Observed shortwave radiation, calculated shortwave radiation from the different formulae NEF – formulae developed by the authors, Lind - from the Lind [17], GR- Gopala Reddy [18] and DS - Dobson and Smith [15] and Cloud – cloud amount.
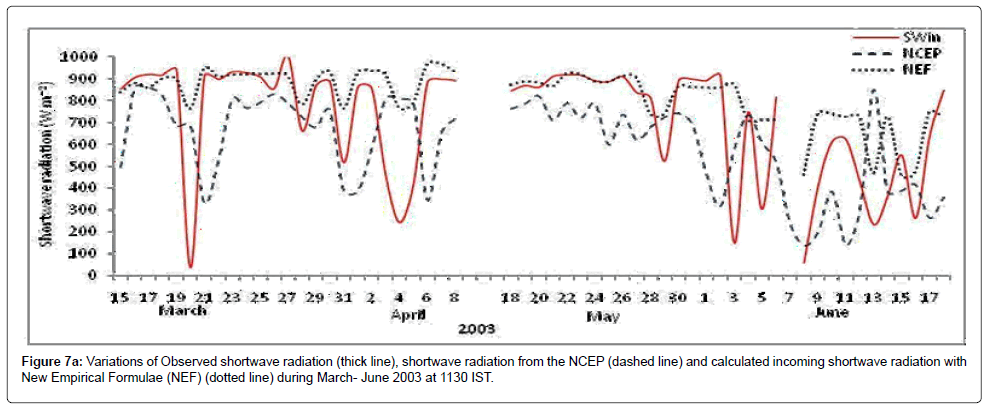
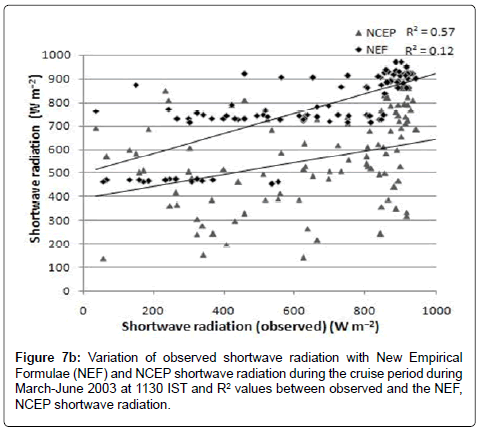
The variation of observed shortwave radiation, NCEP and Shortwave radiation calculated with the newly developed formulae at 1130 IST are shown in the Figure 7. NCEP data is of 2.5 degree, so the difference of the grid has been taken in to consideration for the comparison and the co-located points NCEP data has been obtained for the comparison during the study period. From the figure it can be seen that the shortwave radiation calculated with the newly developed formulae are well within the range of the measured shortwave radiation and fitting better with the r2 of 0.57, when considered different cloud conditions. However the NCEP values are showing lower with the measured shortwave radiation and the r2 is 0.12. The scatter plot shows the NCEP shortwave radiation is not suitable when using it for the point of observations, due to the resolution is low and lower than the measured values. There are some exceptional cases like observed shortwave radiation changed rapidly; the developed formulae are not able to predict the same values. In other cases the shortwave radiation from the developed formulae are much nearer to measured shortwave radiation. The new empirical formulae are much nearer with the measured values except in some exceptional cases.
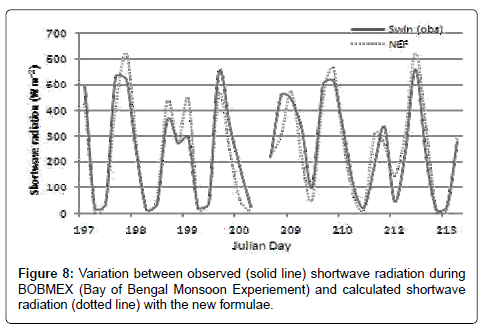
The calculated shortwave radiation using the empirical formulae has been compared with the BOBMEX data and presented in the Figure 8. It can be seen that the observed and the estimated radiation shows a good agreement. During the observed period most of the days are under over cast conditions and even then the present formulae are in good agreement with the observed values.
The regression coefficients A and B of formula to estimate incoming short wave radiation for different cloud amounts from clear sky (0 Oktas) to overcast condition (8 Oktas) are developed and are given in Table 1. The newly developed regression formulae are designed to account in a simple way for the physics of sunlight in a cloudy atmosphere. Following the Lumb theme, similar formulae has been obtained by Lind [17] from JASIN data set, Gopala [18] from Kiel Bay (latitude 54.5°N) data set, Dobson [15] from Pacific Ocean data set between 44°N and 62°N and Gopala [22] from BOBMEX Pilot data collected during October – November, 1998. The Root Mean Square (RMS) error and Standard Deviation (SD) of these formulae are given in Table 2 along with the formulae obtained in the present study for comparison. The above formulae and estimations are mainly for extra tropical data except GRSR. However, in the present article author developed regression coefficients based on sin (h) and cloud amount. Another distinguishing feature is that the regression coefficients are developed for 9 different cloud amount categories. Mention should be made here that GRSR also developed regression coefficients for a specific cloud amounts 1, 4, 5 and 6 Oktas. This, in another way will give more accurate estimates as one can expect linearity to be more applicable if all cloud amounts are taken in to consideration.
| Cloud amount | Coefficients | No. of Observations | |
|---|---|---|---|
| A | B | ||
| 0 | 0.2742 | 0.4297 | 28 |
| 1 | 0.3784 | 0.3489 | 91 |
| 2 | 0.253 | 0.4842 | 91 |
| 3 | 0.18 | 0.5836 | 87 |
| 4 | 0.1855 | 0.5428 | 116 |
| 5 | 0.1713 | 0.5904 | 84 |
| 6 | 0.1341 | 0.4893 | 138 |
| 7 | 0.0957 | 0.5129 | 129 |
| 8 | 0.0328 | 0.3607 | 73 |
Table 1: Regression coefficients A and B (formula 3) fitted to data from R/V Sagar Kanya, sorted by Oktas.
From Table 2, the present formulae are better, more nearly and justified to linearization. This is especially true when the cloud amounts are divided in to several categories. A non-linear process can be better estimated and represented as a linear process if the interval of consideration is small within the limitations of availability of data. e are showing the lower percentage of error when compared with the others. Only for the cloud amounts 7 and 8 are showing error more than 10%. The present empirical formulae are more accurate than the previous formulae. The regression equations have their own limitations as they are derived from the cloud amount observed during the period of observations. The process controlling the physical process is out off scope of the paper, since the relevant information is not available at present.
| Cloud amount | New Empirical Formula | Lind et al (1984) | Gopala Reddy (1987) | Dobson and Smith (1988) | Gopala Reddy and Sree Ram (2000) | |||||
|---|---|---|---|---|---|---|---|---|---|---|
| RMS* | SD** | RMS | SD | RMS | SD | RMS | SD | RMS | SD | |
| 0 | 0.03 | 0.002 | 0.157 | 0.012 | 0.085 | 0.007 | 0.097 | 0.006 | - | - |
| 1 | 0.047 | 0.004 | 0.087 | 0.007 | 0.05 | 0.004 | 0.127 | 0.014 | 0.067 | 0.01 |
| 2 | 0.072 | 0.006 | 0.101 | 0.016 | 0.081 | 0.009 | 0.172 | 0.031 | - | - |
| 3 | 0.077 | 0.006 | 0.101 | 0.014 | 0.121 | 0.021 | 0.198 | 0.048 | - | - |
| 4 | 0.075 | 0.007 | 0.102 | 0.009 | 0.088 | 0.011 | 0.173 | 0.028 | 0.178 | 0.041 |
| 5 | 0.084 | 0.009 | 0.19 | 0.026 | 0.112 | 0.012 | 0.134 | 0.026 | 0.138 | 0.023 |
| 6 | 0.103 | 0.011 | 0.139 | 0.019 | 0.112 | 0.011 | 0.174 | 0.033 | 0.121 | 0.014 |
| 7 | 0.103 | 0.012 | 0.178 | 0.042 | 0.281 | 0.078 | 0.178 | 0.042 | - | - |
| 8 | 0.066 | 0.004 | 0.106 | 0.014 | 0.126 | 0.019 | 0.072 | 0.005 | - | - |
Table 2: Comparison of the new regression formulae with previous formulae.
Conclusions
The newly developed regression formulae are obtained from the data collected during the ARMEX, which covers all types of cloud amounts and the conclusions are:
• Empirical formulae for estimating hourly shortwave radiation over northern Indian Ocean under different cloud amounts are obtained. These hourly shortwave radiation formulae have been developed from the in situ measurements by using Albedometer over northern Indian Ocean.
• The regression formulae have been compared with the previously available formulae. It is emphasized that the present regression coefficients are better as is evident by the root mean square error, standard deviation and also by the mean percentage of error.
• Mean percentage of error with the measured Shortwave radiation is well within the range for the newly developed empirical formulae, except for the cloud amount 7 and 8, where the error is -11.8% and 10% respectively.
• Comparison of newly developed regression formulae with BOBMEX and NCEP data reveals a good agreement with BOBMEX data and lower values with NCEP data.
Acknowledgements
The author express his thankfulness to the Department of Science and Technology (DST), New Delhi, India for supporting the study by providing funds to participate in cruises for collection of data. Author sincerely thanks the Project Investigator K. Gopala Reddy and Co-Project Investigator G. Bharathi for giving opportunity to use the instruments and data collected onboard. The author thank National Center for Antarctic Ocean Research (NCAOR), Goa, India for providing facilities to collect data onboard R/V Sagar Kanya.
References
- Yu L, Jin X, Weller RA (2007) Annual, seasonal and interannual variability of Air-Sea fluxes in the Indian Ocean. J Climate 20: 3190-3209.
- Aleksandrova MP, Gulev SK, Sinitsyn AV (2007) An Improvement of Parametrization of Short-Wave Radiation at the Sea Surface on the Basis of Direct Measurements in the Atlantic Russian Meteorol Hydrol32: 245–251.
- Gautier C (1986) Evaluation of the net short-wave radiation over Indian Ocean during summer MONEX. Mon Weather Rev 114: 525-533.
- Gautier C (1988) Surface solar irradiance in the central Pacific during tropical heat Comparisons between in-situ measurements and satellite estimates. J Climate 1: 600-608.
- Wyrtki K (1971) Oceanographic Atlas of the Inter-National Indian Ocean Expedition. National Science Foundation, Washington DC, USA.
- Seckel GR, Beaudry FH (1973) The radiation from the sun and sky over the Pacific Ocean (Abstract) Trans Am GeophysUnion 54: 1114.
- Reed RK (1977) On estimating insolation over the ocean. J Phys Oceanogr 7 482-485.
- Simpson JJ, Paulson C (1979) Mid-ocean observations of atmosphere radiation Q J Roy Meteor Soc 105: 487-502.
- Atwater MA, Ball JT (1981) A surface solar radiation model for cloudy atmospheres. Mon Weather Rev 109: 878-888.
- Mohanty UC, Mohan KN (1998) A method for estimation of net surface short-wave radiation over the Bay of Bengal. Ind J Marine Sci 27: 60-65.
- Dobson FW, Bretherton FP, Burridge DM, Crease J, Kraus EB, et al. (1982) The ‘CAGE’ experiment: A feasibility study. Report WCP-22 World Meteorological Organization Geneva, Switzerland.
- Ganesan HR (1970) Estimates of solar radiance over India. Ind J Met Geophys 21: 525-533.
- Das HP, Pujari AD (1993) A simple approach towards estimating solar irradiance. Mausam 44: 239-242.
- Dobson FW, Smith DS (1988) Bulk models of solar radiation at sea. Q J R Meteorol Soc 114: 165-182.
- Lumb FE (1964) The influence of cloud on hourly amounts of total solar radiation at the sea surface. Q J R Meteorol Soc90: 43-56.
- Lind RJ, Katsaros KB, Gube M (1984) Radiation budget components and their parameterization in JASIN. Q J R Meteorol Soc 110: 1061-1071.
- Gopala RK (1987) Parameterization of short-wave radiation in the Marine Atmosphere. IUGG, General Assembly, Vancouver, Canada.
- Bhat GS, Gadgil SP, Hareesh K, Kalsi SR, Madhusoodanan P, et al. (2001) BOBMEX: The Bay of Bengal Monsoon Experiment. Bull Amer Meteor Soc 82: 2217-2243.
- Gopala RK, Bharathi G, Ravi KA, Subrahmanyam MV, Muni KK (2003) An experimental study of radiative fluxes in the south Bay of Bengal during BOBMEX 1999 J Earth Sys Sci 112: 267-281.
- Gopala RK, Bharathi G, Sree RP, Subrahmanyam MV, Muni KK (2005) The Variation of Surface Heat Fluxes during Arabian Sea Monsoon Experiment. Mausam 56: 257-262.
- Gopala RK, Sree RP (2000) BOBMEX-98 Pilot: Measurement and analysis of incoming shortwave radiation data. J Earth Sys Sci 109: 249-254.
Citation: Subrahmanyam MV (2013) Empirical Estimation of Hourly Incoming Shortwave Radiation over the North Indian Ocean. J Earth Sci Clim Change 5: 176. DOI: 10.4172/2157-7617.1000176
Copyright: ©2013 Subrahmanyam MV. This is an open-access article distributed under the terms of the Creative Commons Attribution License, which permits unrestricted use, distribution, and reproduction in any medium, provided the original author and source are credited.
Select your language of interest to view the total content in your interested language
Share This Article
Recommended Journals
Open Access Journals
Article Tools
Article Usage
- Total views: 15624
- [From(publication date): 2-2014 - Aug 20, 2025]
- Breakdown by view type
- HTML page views: 11000
- PDF downloads: 4624

