Research Article Open Access
Energy Efficient Construction Methods in UK Dwellings
Ahmad H. Taki* and Rachel Pendred
Leicester School of Architecture, De Montfort University, Leicester LE1 9BH, UK
- *Corresponding Author:
- Ahmad H. Taki
Leicester School of Architecture
De Montfort University
Leicester LE1 9BH, UK
Tel: +44-116-257-7408
Fax: +44-116-257-7518
E-mail: ahtaki@dmu.ac.uk
Received Date: November 16, 2012; Accepted Date: January 05, 2012; Published Date: January 12, 2012
Citation: Taki AH, Pendred R (2012) Energy Efficient Construction Methods in UK Dwellings. J Archit Eng Tech 1:106. doi: 10.4172/2168-9717.1000106
Copyright: © 2012 Taki AH, et al. This is an open-access article distributed under the terms of the Creative Commons Attribution License, which permits unrestricted use, distribution, and reproduction in any medium, provided the original author and source are credited.
Visit for more related articles at Journal of Architectural Engineering Technology
Abstract
This paper examines the thermal performance of housing in the UK and the associated costs for different fabric construction methods of the envelope for a typical four bedroom detached house. The energy ratings were assessed using the UK Government’s Standard Assessment Procedure (SAP), which is based on the Building Research Establishment Domestic Energy Model. The capital costs were estimated from data published by the Building Cost Information Services applied to Leicester UK area in 2011. Through alterations to the dwelling fabric alone, a reduction of 30.1% in carbon emissions of the base property could be achieved. Standard methods proved to be as effective as alternative methods at reducing carbon emissions by 22.6% for an average capital cost increase of 9.1% against the base property. This was equivalent to an extra cost of £13.7 for each kg of CO2 emissions reduction. It was found that alternative methods could reduce carbon emissions by 20.5% for an extra cost of 18.4% over the base property. The optimum construction method that would help achieve the UK government’s carbon emissions target was also discussed. The paper also discusses the methods for improving energy efficiency in new extensions to existing dwellings, using a typical solid-wall terraced house with a new single storey extension, as a case study. In this study, it was found that by increasing refurbishment costs by only 4.7% could result in carbon emissions reduction by 21.7%.
Keywords
UK dwelling; Construction methods; Energy performance; Costs; Part L
Introduction
Background
Approximately 45% of the UK total carbon emissions are a result of energy consumption in buildings [1]. Building Regulations are getting progressively more demanding and in 2008 the Climate Change Act sets the UK government target at 34% and 80% reductions in carbon emissions by 2020 and 2050 respectively based on 1990 levels [2]. The 24 million UK dwellings accounts for approximately 27% of the total carbon emissions [3] due to space heating for the provision of internal comfort conditions. It has been estimated that 70% of the UK housing stock will still be in use by 2050, and thus, there is a need for mass refurbishment to help achieve the UK government target by 2050, due to the fact that the majority of the existing stock of dwellings has been built with low energy performance [4]. In addition, all new homes in England will have to be net zero carbon by 2016. This has prompted further changes to UK Building Regulations between 2010 and 2016 calling for a 25% reduction in carbon emissions by 2010 and a further 44% reduction by 2013, leading to net zero carbon by 2016.
Building envelope
Turner and Townsend [5] have studied three different buildings and identified potential improvement strategies to reduce carbon emissions. They have found that a 20% reduction in carbon emissions can be achieved for these buildings without raising the capital cost by more than 5%. The benchmark dwellings used in the Turner and Townsend report [5] have been adopted by others for use in further research [6,7]. This study will follow the same method and the benchmark dwelling derived from a study carried out by the Zero Carbon Hub [8] will be utilised. Zero Carbon Hub [8] has informed the strategy adopted by the UK government for stage implementation of higher building standards through Building Regulations and has established four levels of specification for improvements to building fabrics and the attendant costs. The four specification levels alter the standards required for the thermal elements, the air tightness, thermal bridging and ventilation with each level being more demanding than the one which precedes it. Costs are only established for improvements and expressed as a percentage increase against a base figure that is undisclosed.
A recent study carried out by Energy Saving Trust [9] has focused solely on fabric improvements in the same way as this study will do; it sets out improvement measures that can be applied to masonry, timber frame and steel frame construction to improve the overall thermal transmittance, U-values. They have found that through its improvement measures an average of 25% reduction over the target emission rate for the dwelling can be made. However, they have not provided the costs for floor, roof and window improvement measures, and this information is critical for homeowners, and can be the deciding factors in the decision to embark on home improvements.
Communities and Local Government [10] have analysed the potential costs of achieving all levels of the code for sustainable homes. They have investigated many ways of reducing carbon emission rather than just looking at the building fabric. Langdon [6,7] have explored many types of low and zero carbon technologies along with varying levels of building fabric upgrades to reduce carbon emissions of seven different building types. All improvement scenarios used to achieve increasing levels of carbon reductions always include improvements to the building fabric first confirming the importance of building fabric on energy performance. Their study used the dwelling base model as presented by Turner and Townsend [5] to assess the improvement measures. However, they did not include the costs of these proposed alterations to the construction methods. By concentrating on improving the fabric of existing domestic buildings the need for space heating and the level of carbon emissions can be significantly reduced and this is crucial to UK government’s carbon reduction target.
None of the above mentioned studies have investigated the use of alternative modern methods of construction to enhance energy efficiency. The Zero Carbon Hub [8] and Turner and Townsend [5] have acknowledged that other forms of construction could have the ability to meet their improved specification targets. It is reported that housing developers are reluctant to deviate from the standard construction design and that there is a lack of information about costs of sustainable construction [11]. It is also noted that higher standards for building fabric to produce a more sustainable building are not specified due to the perceived high costs involved [12].
Solid wall terraced housing
The above ambitious targets set by the Climate Change Act would be difficult to achieve without reducing carbon emissions from the existing dwellings. However, improving energy efficiency of existing solid wall dwelling would be particularly challenging because of their higher fabric heat losses and low energy performance.
The pre-1920’s solid wall houses are seen as the greatest consumers of energy and greatest emitters of carbon emissions, and consequently, if appropriately addressed, have the greatest potential to improve the carbon footprint of the housing stock; these houses are most difficult properties to bring up to modern energy performance standards [13].
Objectives of the study
This paper will investigate whether the method of house construction in use today is the best method to continue into the future with towards higher energy performance targets. The study will examine alternative methods of construction and they will be compared to standard construction methods. Their impact on energy performance and costs as applied to a four bedroom two storey detached dwellings will be assessed. This study will attempt to discover the limits of fabric energy efficiency and will help establish a framework for assessing the financial implications associated with reducing carbon emissions resulting from the building fabric. Additionally, this paper will address the challenges of improving the energy efficiency of existing UK solid-wall dwellings.
Methodology
The energy efficiency of the dwelling will be assessed using the UK Government’s Standard Assessment Procedure (SAP), while the costs will be estimated from data published by the Building Cost Information Services applied to Leicester UK area in 2011. These tools will be applied to a typical four bedroom detached house with six different construction methods of the envelope (three standard methods; three alternative methods. Additionally, these tools will be applied to a typical solid-wall terraced house with a new single storey extension.
Modelling tools
The procedure used for the calculation is based on the BRE Domestic Energy Model, BREDEM, [14,15], which provides a framework for the calculation of energy use in dwellings. The model calculates the monthly energy consumption in dwellings, including estimates for space heating, water heating, cooking and lights and appliances. The dwelling is divided into two zones. Zone 1 is the living area which may be one or more rooms. This area is heated to a higher temperature than the rest of the house which is zone 2. The model considers the physical characteristics of the dwelling and the lifestyle of the occupants to produce realistic estimates of domestic energy use and running costs.
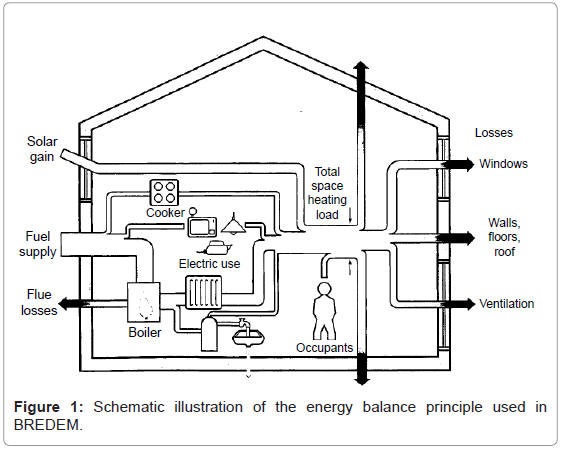
The input data required to perform a BREDEM calculation are summarised in Table 1. BREDEM uses a mixture of analytical and empirical techniques. The energy consumption is based on an integrated form for the heat transfer equation and its surroundings. The overall energy balance is shown in Figure 1 [15].
| Information required | |
|---|---|
| Site definition | Degree day region; Height above sea level (m); Number of sides sheltered from wind; Mean site wind speed; Level of overshading |
| Type of dwelling | Number of storeys; Definition of zones 1 and 2, noting whether zone 1 is all of a storey and whether the stairs provide a direct link between zone1 and zone 2; Total floor area for each zone, volume for each zone; Type of construction (e.g. timber frame, cavity wall) |
| Building fabric | Areas and U-values for roof, external walls, for each zone; Heat loss floor area for each zone, floor perimeter, type and amount of insulation; Window areas, type of frame, type of glazing, level of leakiness (e.g. draught stripped, loose fitting), orientation, zone. |
| Ventilation | Pressure test result1; Number and type of fans and vents |
| Heating system | Type (e.g. combi boiler with fan-assisted flue); Fuel; Controls fitted (e.g. room thermostat); Level of independent control in zone 2 (e.g. TRVs); Secondary heating, type of appliance and fuel; Number of pumps and fans |
| Hot water heating | Type of hot water heater (e.g. from boiler, electric immersion); Volume of hot water tank; Thickness and type of tank insulation; Whether primary pipework is insulated; Whether there is a cylinder thermostat; Location of tank (zone 1 or zone 2) |
| Mechanical ventilation | Efficiency of heat recovery |
| Cooking | Cooking system and fuel used (e.g. electric cooker, kitchen range) Location of kitchen (zone 1 or zone 2) |
| Lighting | Proportion of light bulbs that are low energy |
| Occupancy | Number of occupants1; Demand temperature for each zone1; Heating periods (for each zone if different)1; Level of usage of hot water, lights and appliances and cooking (above average, average, below average or well below average) |
| Conservatory (if present) | Areas and U-values of components separating house and conservatory; Areas and U-values for external conservatory components; Area and U-value of conservatory floor; Area and type of glazing; Whether a curtain or blind is present; Orientation; Heating pattern and demand temperature; Zone adjacent to conservatory |
| Renewables | Solar water heating; Photovoltaic panels; Micro wind turbines; Small-scale hydro-electric generators |
Table 1: Summary of information required to perform a BREDEM calculation [15].
Supplying this value is optional; a default can be used instead. The model can be used for ensuring the most appropriate measures are selected when upgrading existing dwellings and calculating their energy ratings. The model underpins the UK Government’s Standard Assessment Procedure for energy rating of dwellings (SAP) which is used for checking compliance with Building Regulations Part L. The procedure is consistent with the standard BS EN ISO 13790 [16]. The SAP ratings were calculated using the National Energy Home Rating software (NHER). This commercial software was chosen because it is one of the UK Government authorise software for assessing the energy efficiency of dwellings, and available from the National Energy Services, UK. The results for the Target and Dwelling Emission Rates (TER and DER) are given from the output of the SAP methodology, which is the national calculation methodology which is recognised as being a simplified tool but should fully capture the simple nature of a typical dwelling in the UK.
Costs of construction methods
When comparing costs of construction methods there are fluctuations in price associated with labour and equipment costs for each construction method, these fluctuations stem from issues such as faster build time for alternative/modern methods of construction resulting in lower labour costs and hire charges, these costs are considered by the National Audit Office [17]. They have highlighted areas where modern methods of construction can create increased costs that would not normally be encountered when using traditional methods such as loss of the factory production slot, suppliers failing to deliver the correct components or damage to critical prefabricated components. The cost of this study will be based on material costs alone similar to a study carried out by Wang et al. [18], who used material costs alone to calculate the difference in price of insulated exterior walls. They have recognised that workmanship, equipment and vehicle costs will contribute to for example, a wall constructed with larger blocks. However they have suggested that increased costs will be balanced with factors that reduce costs such as ease of building. This study followed a similar assumption in that it was recognised that by using alternative methods of construction savings can be made on labour by reduced time on site and less need for skilled labour such as brick layers; however the alternative methods come with alternative costs such as bracing hire for Insulated Concrete Formwork construction and prolonged need for a crane when using Structural Insulated Panels. It is also noted that these alternative methods are often finished with a brickwork outer skin in order to resemble traditional construction methods and therefore the need for skilled labour is not altogether eliminated. There are many contributing factors that can affect the price of construction work and so for this study only material costs will be considered as they are constant and measurable. The costs were estimated from data published by Building Cost Information Services applied to Leicester UK area in 2011.
The base property
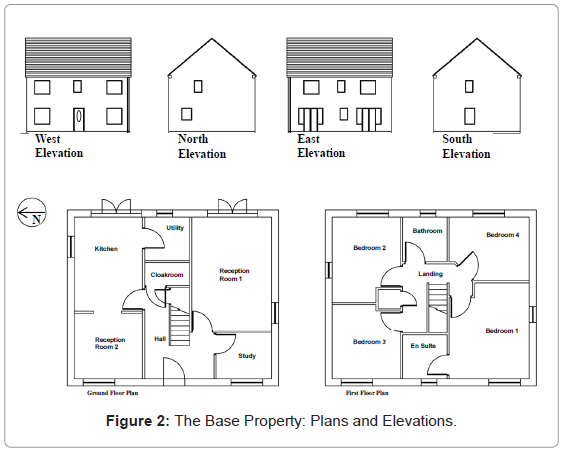
The simulation model used in this study represents a two storey four bedroom detached house with a gross internal floor area of 116 m2, located in Leicester, East Midland of England. (Figure 2) shows the plans and elevations. This base case property was taken from Zero Carbon Hub [8]. The base property represents the standard construction methods employed by builders to achieve compliance with the 2006 Part L Building Regulations.
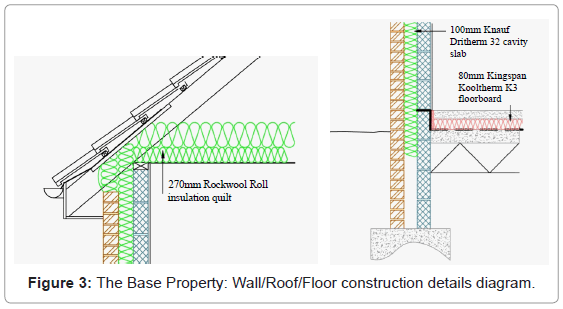
Figure 3 and Table 2 shows the construction details of the base property. Cost data for the base property has been established from different analyses of similar establishments published by the Building Cost Information Service as applied to the first quarter of 2011 and to the Leicester area using the appropriate cost indices. Elemental cost figures have been selected from the analysis which best fits the specification of the base property. The costs per m² of floor/wall/roof/window area were determined using Building Cost Information Service indices. The total cost is shown in Table 2.
| Element | Specification | U-Value W/m²K |
|---|---|---|
| External Walls: Cavity walls | 102.5 mm Brickwork outer leaf (0.77 W/m²K), 100 mm cavity with Knauf full fill dritherm 32 cavity slab (0.032 W/m²K), 100 mm lightweight concrete blocks, Tarmac toplite standard (0.15 W/m²K), 13 mm plaster (0.48 W/m²K) |
0.275 |
| Ground Floor: Solid Floor | 65 mm screed (1.15 W/m²K), 80 mm Kingspan Kooltherm K3 floorboard (0.022 W/m²K), 1200 gauge polyethylene damp proof membrane, 100 mm concrete slab (1.35 W/m²K), 225 mm compacted hardcore |
0.2 |
| Roof: Cold Pitched Roof | Timber trussed cold roof, 38 × 100 mm softwood members at 450 mm centres, 100mm Rockwool roll between joists with 170 mm laid over at right angles to the joists (0.044 W/m²K). 9.5 mm Gyproc wallboard plasterboard finish to underside of joists (0.19 W/m²K) |
0.165 |
| Windows: double glazed | PVC double glazed sealed units with 20 mm air gap and low emissivity coated glazing |
1.8 |
| Boiler and water heating system | Vaillant Ecomax 824/1e 90.2% efficient mains gas combination condensing boiler with interlock and load compensator. Radiator heating system, programmer, room thermostat and TRV’s | |
| Air Tightness | Air tightness 10 m3/hr/m2 at 50 Pa | |
| Ventilation | Low energy extract fan in cloakroom. Natural ventilation elsewhere, opening lights and trickle vents on all windows. | |
| Costs | Total cost of base property £77264 |
Table 2: Construction details of the base property.
Three standard construction methods and three alternative construction methods were explored and applied to the base property to investigate their impacts on energy performance and costs. These proposed methods are summarised below and described in sections 3 and 4.
1. Standard improvement 1: Standard methods of construction with insulation levels increased.
2. Standard improvement 2: Standard methods of construction with regular insulation substituted for an insulation with a better thermal performance.
3. Standard improvement 3: Standard methods of construction with cavity wall insulation replaced with Xtratherm full fill insulation.
4. Alternative method 1: Structural Insulated Panels (SIP) used in place of the standard roof and wall constructions.
5. Alternative method 2: Insulated Concrete Formwork (ICF) used in place of the standard wall construction.
6. Alternative method 3: Thin joint solid blockwork walls with external insulation and floating floor used in place of the standard wall and floor constructions.
All improvement measures include the use of high performance and low emissivity triple glazed windows in place of the standard double glazed windows of the base property. The new U-values of windows and doors were 0.8 W/m2K and 1.0 W/m2K respectively. The costs of the new windows were £4636. Costs were taken from Zero Carbon Hub (2009). The values of air tightness for all scenarios were assumed based on case studies and manufacturers’ technical data for each building construction type.
The case study
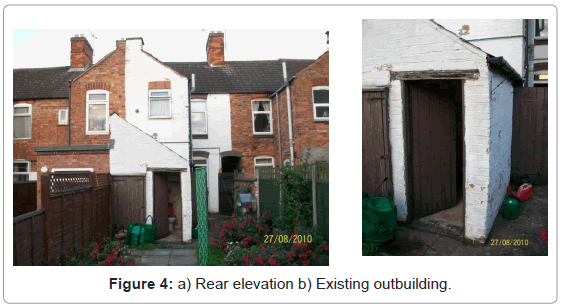
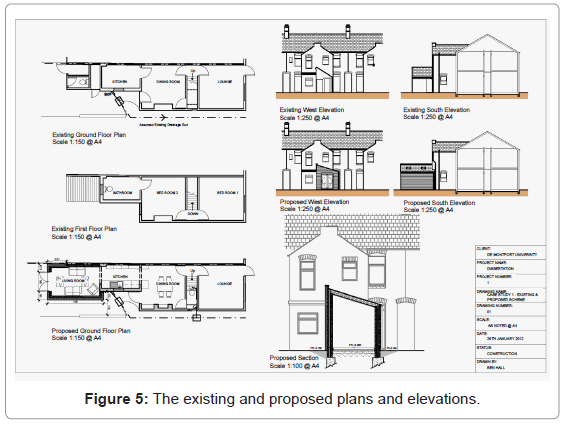
To address the challenges of improving the energy efficiency of solid-wall dwellings, an existing terraced house with a new single story extension was selected in this study. (Figure 4a and 4b) shows photos of the dwelling and Figure 5 shows the proposed plans and elevation.
The application of internal and external insulation systems will be applied to the dwelling and their implication on thermal performance together with the associated costs will be assessed.
Standard construction methods
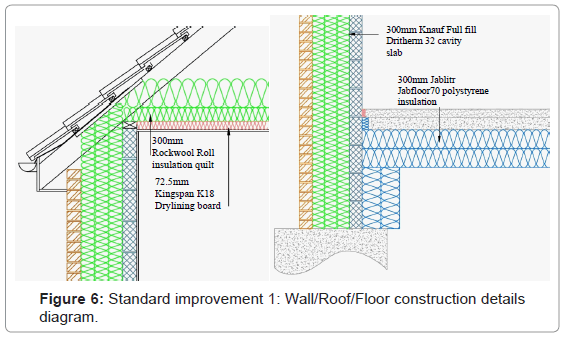
Standard improvement 1: The first set of improvements will simply be to add more insulation to the standard construction method as shown in (Figure 6 and Table 3). The improvement measures have been chosen based on the maximum amount of insulation that has been applied to the construction in practice. The extra costs resulting from such improvement measures are also shown in Table 3. Built Passive Houses [19] has a similar construction to standard improvement 1 and air tightness of 7 m3/hr/m2 was assumed.
| Element | Specification | U-Value W/m²K | Extra costs £ |
|---|---|---|---|
| External Walls: Cavity walls | Same as in Table 1, but with 300 mm Knauf full fill dritherm32 insulation (0.032 W/m²K) | 0.123 | 1484 |
| Ground Floor: Solid Floor | Same as in Table 1, but with 300 mm expanded polystyrene insulation Jablite Jabfloor 70 (0.038 W/m²K) |
0.106 | -212 |
| Roof: Cold Pitched Roof | Same as in Table 1, but with 72.5 mm Kingspan Kooltherm K18 insulated dry lining board to underside of joists comprising 12.5 mm plasterboard facing bonded to 60 mm thick rigid phenolic insulation (0.021 W/m²K) |
0.104 | 830 |
| Windows: triple glazed | high performance triple glazed windows and low emissivity coated glazing | 0.8 | 4636 |
| Air Tightness | Air tightness 7 m3/hr/m2 at 50 Pa | ||
| Ventilation | Whole house mechanical ventilation with heat recovery | ||
| Costs | Extra over costs from base property | 6738 |
Table 3: Standard improvement 1 construction details and extra costs.
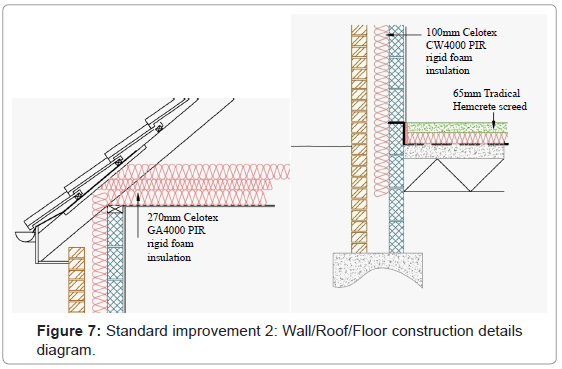
Standard improvement 2: The second set of improvements to the standard construction methods will be to substitute the type of insulation in each thermal element with a lower thermal conductivity giving the overall construction a better (lower) U-value. These are presented in Figure 7 and Table 4. The constructions for the walls, roof and floor have not changed in design and therefore it could be argued that no change to air tightness will have happened.
| Element | Specification | U-Value W/m²K | Extra costs £ |
|---|---|---|---|
| External Walls: Cavity walls | Same as in Table 1, but with 100 mm Celotex CW4000 polyisocyanurate rigid foam insulation (0.022 W/m²K), 50 mm air gap |
0.178 | 799 |
| Ground Floor: Solid Floor | Same as in Table, but with 65 mm Tradical Hemcrete screed (0.11 W/m²K), |
0.181 | 238 |
| Roof: Cold Pitched Roof | Same as in Table 1, but with 270 mm Celotex GA4000 polyisocyanurate rigid foam insulation between and over joists (0.022 W/m²K) |
0.087 | 1126 |
| Windows:Triple glazed | high performance triple glazed windows and low emissivity coated glazing | 0.8 | 4636 |
| Air Tightness | Air tightness 7 m3/hr/m2 at 50 Pa | ||
| Ventilation | Same as in Table 1 | ||
| Costs | Extra over costs from base property | 6799 |
Table 4: Standard improvement 2 construction details and extra costs.
If the floor insulation was increased to its maximum of 100mm, the floor U-value would reduce to 0.155W/m2K and this would reduce carbon emissions by 15kg/yr for the extra over the costs from the base property of £6932. This is defined as standard improvement 2.1 method.
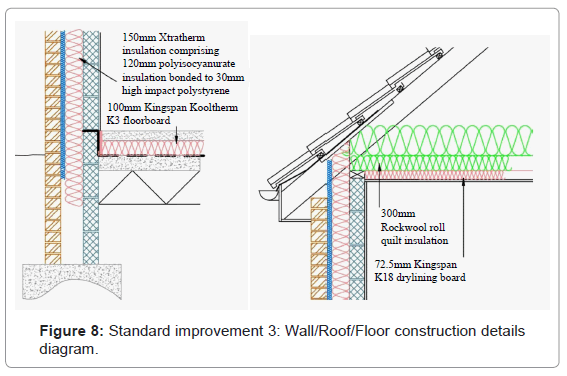
Standard improvement 3: The final set of improvements to the standard construction methods will be a mixture of the first two improvement methods with the use of ‘Xtratherm’ which is wall insulation system introduced to the market in October 2010, and works within a traditional 100mm cavity using traditional foundations, building skills and materials to achieve U-values of 0.16 W/m2K. This new product is a full fill cavity insulation comprising polisocyanurate insulation bonded to high impact polystyrene insulation. This combination has the benefit of a better thermal conductivity with the ability to be installed to fully fill the cavity, unlike other high performance polyisocyanurate products which are only available as a partial cavity fill. The construction details and extra over the costs from the base property are shown in Figure 8 and Table 5.
| Element | Specification | U-Value W/m²K | Extra costs £ |
|---|---|---|---|
| External Walls: Cavity walls | Same as in Table 1, but with 150 mm Xtratherm Cavity comprising 120 mm polyisocyanurate insulation bonded to 30mm high impact polystyrene (0.021 W/m²K). |
0.124 | 2173 |
| Ground Floor: Solid Floor | Same as in Table 1, but with 100 mm Kingspan Kooltherm K3 floorboard (0.022 W/m²K) |
0.169 | 133 |
| Roof: Cold Pitched Roof | 72.5 mm Kingspan Kooltherm K18 insulated dry lining board to underside of joists comprising 12.5 mm plasterboard facing bonded to 60mm thick rigid phenolic insulation (0.021 W/m²K) | 0.104 | 830 |
| Windows:Triple glazed | high performance triple glazed windows and low emissivity coated glazing | 0.8 | 4636 |
| Air Tightness | Air tightness 7 m3/hr/m2 at 50 Pa | ||
| Ventilation | Low energy extract fan in cloakroom. Natural ventilation elsewhere, opening lights and trickle vents on all windows. | ||
| Costs | Extra over costs from base property | 7772 |
Table 5: Standard improvement 3 construction details and extra costs.
Similar to standard improvement 2 the constructions for the walls, roof and floor have not changed in design however the windows compared with the base property are high performance windows and the air leakage through these windows will be reduced over those of the base house. The assumed air tightness for this construction therefore will be 7 m3/hr/m2.
Alternative construction methods
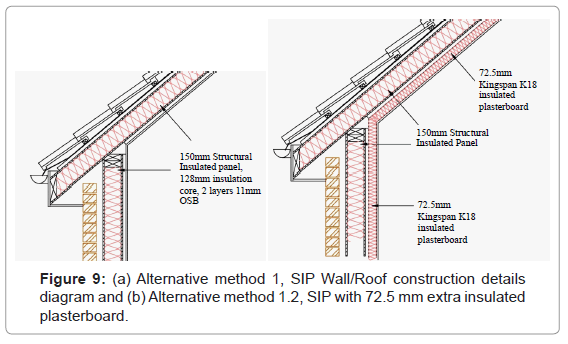
Structural insulated panels: Structural Insulated Panels, SIP, consist of a rigid foam insulation core typically sandwiched between two layers of oriented strand board this construction provides a load bearing alternative to masonry and was first introduced in North America in 1952. Despite its historical use in America it is still seen as a fairly new construction type in Europe and it is often categorised under the heading of modern methods of construction. The construction details of alternative method 1 together with extra over the costs from the base property are shown in Figure 9 and Table 6. The extra over the costs from the base property would be £15753. Alternative method 1.2 follows the construction of alternative method 1 but has an additional insulated plasterboard finish of 72.5mm to improve thermal performance.
| Element | Specification | U-Value W/m²K | Extra costs £ |
|---|---|---|---|
| External Walls: Structural Insulated Panels | 102.5 mm Brickwork outer leaf. (0.77 W/m²K) 50 mm cavity 150 mm SIP comprising: 11 mm Oriented strand board (0.13 W/m²K) 128 mm insulation (0.025 W/m²K) 11mm oriented strand board (0.13W/m²K) 25 × 25 mm batons to create a service void. 12.5 mm plasterboard. (0.19 W/m²K) |
0.187 | 6992 |
| Ground Floor: Solid Floor | Same as in Table 1 | 0.2 | 0 |
| Roof: Warm Roof | SIP comprising: 11 mm oriented strand board (0.13 W/m²K) 128 mm insulation (0.025 W/m²K) 11mm oriented strand board (0.13 W/m²K). 25 × 25 mm batons to create service void. 12.5 mm plasterboard finish (0.19 W/m²K) |
0.192 | 4125 |
| Windows: triple glazed | high performance triple glazed windows and low emissivity coated glazing |
0.8 | 4636 |
| Air Tightness | Air tightness 3 m3/hr/m2 | ||
| Ventilation | Whole house mechanical ventilation with heat recovery. | ||
| Costs | Extra over costs from base property | 15753 |
Table 6: Alternative method 1 construction details and extra costs.
Case studies (Energy Saving Trust, 2007) have shown that air permeability rates with SIP construction recorded between 2.89 m3/hr/m2 and 5.16 m3/hr/m2. An average of 3 m3/hr/m2 for this construction method was assumed for the purposes of the SAP calculation. Replacing standard plasterboard with Kingspan K18 of 72.5 mm would add extra costs for the walls and roof of £8675 and £5247 respectively. The extra over costs for the alternative method 1.2 from the base property would be £18558.
Insulated concrete formwork
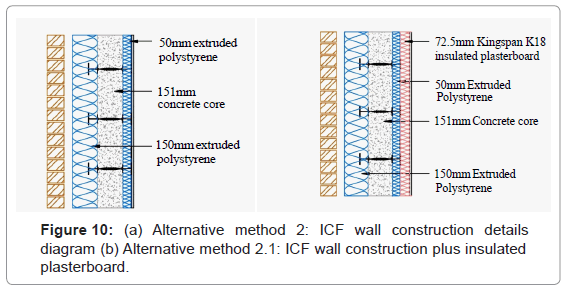
Insulated concrete formwork, ICF, is a wall system that consists of either hollow polystyrene blocks or alternatively polystyrene planks which are tied together using specially made clips, both systems are assembled on site and then filled with concrete to create a thermally insulated structural wall. The polystyrene creates the formwork for the concrete and is typically extruded polystyrene as this has a lower conductivity than expanded polystyrene; it also withstands the pressure from the concrete better. Figure 10 and Table 7 shows the build up for the wall and extra costs involved.
| Element | Specification | U-Value W/m²K | Extra costs £ |
|---|---|---|---|
| External Walls: Insulated Concrete Formwork | 102.5 mm Brickwork outer leaf. (0.77 W/m²K) 50mm cavity. 150 mm extruded polystyrene plank (0.029 W/m²K) 151 mm concrete core(1.35 W/m²K) 50 mm extruded polystyrene plank (0.029 W/m²K) 12.5 mm plasterboard (0.19 W/m²K) |
0.132 | 8983 |
| Ground Floor: Solid Floor | Same as in Table 1 | 0.2 | 0 |
| Roof: Cold Pitched Roof | Same as in Table 1 | 0.165 | 0 |
| Windows: triple glazed | high performance triple glazed windows and low emissivity coated glazing | 0.8 | 4636 |
| Air Tightness | Air tightness 2 m3/hr/m2 | ||
| Ventilation | Whole house mechanical ventilation with heat recovery | ||
| Costs | Extra over costs from base property | 13619 |
Table 7: Alternative method 2 construction details and extra costs.
ICF case studies have shown that this construction can achieve very low air permeability rates and the ICF manufacturer claimed an air tightness of 2.1 m3/hr/m2. For the purpose of the SAP calculation an air tightness of 2 3/hr/2 was assumed. This led to the whole dwelling to be mechanically ventilated with heat recovery system. To further improve the performance of the ICF an insulated plasterboard finish could be used as shown in Figure 10 which would reduce the U value of the wall to 0.065 W/m2K. The extra over costs for the alternative method 2.1 from the base property would be £15302.
Thin joint blockwork
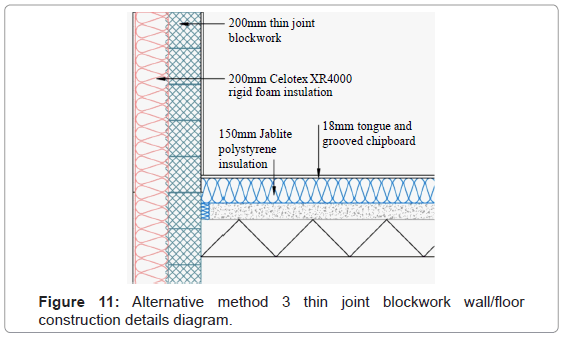
Thin joint block work combines standard ‘aircrete’ building blocks with a thin joint of cement based adhesive which is fast to set and cuts the standard mortar joint of 10 mm down to just 3 mm. Due to the fast setting time of the thin joint adhesive the external walls of a building can be erected faster, the thermal performance of the wall is increased because thermal bridges created by mortar joints are reduced and the system of blockwork is familiar to tradesmen so no further training is required. The system can be used in any standard block work application; this study will look at the solid external wall construction. Figure 11 shows the build up of the external wall with insulation applied externally and a render finish. For this construction method the thin joint blockwork walls have been combined with a floating floor comprising 150 mm polystyrene insulation over the concrete slab finished with an 18 mm tongue and grooved chipboard as shown in Figure 11.
Table 8 shows the construction details of the alternative method 3 together with extra cost involved. For the purpose of the SAP calculation an air tightness of 4 m3/hr/m2 was assumed as recorded in other case studies.
| Element | Specification | U-Value W/m²K | Extra costs £ |
|---|---|---|---|
| External Walls: Thin joint blockwork |
15mm Render (0.57 W/m²K) 200 mm Celotex XR4000 rigid foam polyisocyanurate insulation (0.022 W/m²K) 200 mm thin joint aerated Thermalite Shield concrete blocks (0.15 W/m²K) 13 mm plaster. (0.48 W/m²K) |
0.121 | 4216 |
| Ground Floor: Floating Floor | 18 mm tongue and groove chipboard (0.13 W/m²K), 150 mm Jablit Jabfloor 70 expanded polystyrene (0.038 W/m²K), 1200 gauge polyethylene damp proof membrane, 100mm concrete slab (1.35 W/m²K), 225 mm compacted hardcore. | 0.185 | -951 |
| Roof: Cold Pitched Roof | Same as in Table 1 | 0.165 | 0 |
| Windows: triple glazed | high performance triple glazed windows and low emissivity coated glazing | 0.8 | 4636 |
| Air Tightness | Air tightness 4 m3/hr/m2 | ||
| Ventilation | Low energy extract fan in cloakroom. Natural ventilation elsewhere, opening lights and trickle vents on all windows. | ||
| Costs | Extra over costs from base property | 7901 |
Table 8: Alternative method 3 construction details and extra costs.
Existing terraced dwelling with a new single storey extension
The physical characteristics of this solid-wall dwelling (Figure 5) were entered into the NHER software to produce SAP ratings and details of carbon emissions. The results for different scenarios are summarised in Table 9. The specification and costs of the proposed insulation systems are shown in Table 10.
| SAP rating | CO2 emissions rate (kg/m2/year) | CO2 emissions (kg/year) | % CO2 reduction over the existing dwelling without extension (% per m2) | |
| Existing dwelling without extension | 56 | 59.57 | 3973 | 0 |
| Existing dwelling with new extension | 56 | 56.50 | 4316 | -8.6 (5.2) |
| Insulation applied to existing dwelling with new extension | 67 | 40.17 | 3111 | 21.7 (32.6) |
Table 9: SAP 2009 assessment and CO2 emissions.
| Specification | Costs (% over new extension) | |
| Total cost of the new extension £21950 | See Figures 4 and 5 | £21950 (0) |
| Internal wall insulation system | 37.5 mm Kingspan Kooltherm K17 insulation boards giving U-value of 0.35 W/m2K | £1026 (4.7) |
| External wall insulation system | 100 mm polystyrene insulation boards and render system giving a U-value of 0.35 W/m2K | £1211 (5.5) |
Table 10: Percentage of extra costs over the new extension cost.
Table 9 shows that the overall thermal performance of the dwelling is not notably improved if the existing dwelling is not refurbished and the impact of the new extension on the reduction of carbon emissions per m2 would be only 5.2%, but the overall carbon emissions of the dwelling were increased by 8.6%. Although the extra costs of the new extension would be approximately £11778, but it seems that the building control would only be concerned with new extension in terms of its thermal performance and little attention made to the main part of the dwelling. Table 9 shows that by reducing the U-value of the existing external walls and roof to 0.35 W/m2K and 0.2 W/m2K respectively the percentage reduction in carbon emissions would be 21.7%. Such reduction could be achieved with extra costs of £1026 (4.7% over the extension cost) for the case of an internal wall insulation system, or £1211 (5.5%) if external wall insulation system was applied (Table 10).
These results show that any attempt to construct a new extension to an existing solid-wall dwelling needs to consider refurbishing the existing part to enhance the overall energy efficiency. These results, as applied to construction of a new extension, suggest that a 21.7% reduction in carbon emissions can be achieved with approximately 4.7% to 5.5% increase in refurbishment costs. The external wall insulation could be applied if the dwelling was not in a conservation area and the existing external finish was poor.
The impact of building envelope types on thermal performance and costs
All base property details (Figure 2 and Table 2) such as orientation, window sizes, heating specification, element U-Values etc were entered into the NHER software to produce SAP ratings and details of carbon emissions for the base property. The results are summarised in Table 11.
| Target Emission Rate (TER) against Part L (2006) | 21.95 kg CO2/m2/yr |
| Target Emission Rate (TER) against Part L (2010) | 16.46 kg CO2/m2/yr |
| Dwelling Emission Rate (DER) | 21.83 kg CO2/m2/yr |
| Total CO2 kg/yr | 2286 kg/yr |
| SAP Rating | 83 |
Table 11: Base property SAP results.
All the proposed construction methods described above were applied to the base property, and the details of each scenario such as orientation, window sizes, heating specification, element U-Values etc were entered into the NHER software to produce SAP ratings and dwelling emission rates, DER, in kg of CO2/m2 of floor area per year.
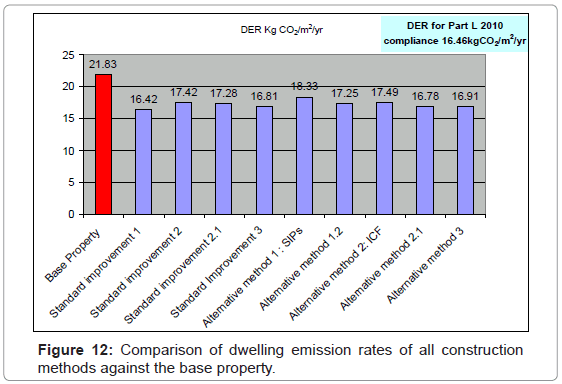
Figure 12 shows the dwelling emission rate, DER, for the base property and for all the construction methods tested. It can be seen that only standard improvement 1 has reached the target emission rate for compliance with Building Regulation Part L 2010 and that none of the constructions would be able to reach the target for 2013 which will be a 44% reduction relative to Part L 2006 carbon levels (i.e. TER of 12.29 kg CO2/m2 of floor area). All of the results range from 16.4 to 18.3 kg CO2/m2/yr.
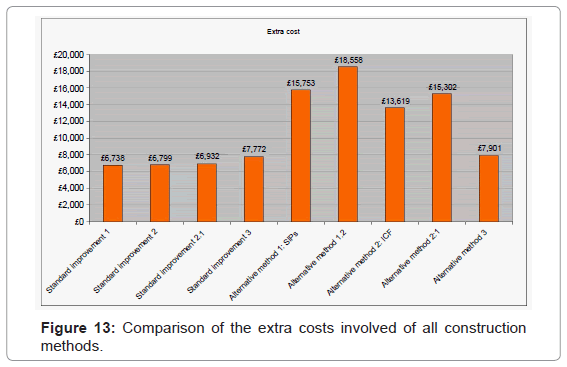
Figure 13 shows the extra costs from the base property for all the proposed construction methods. SIP and ICF construction methods are the most expensive, costing as much as an extra £18558 whereas the other standard methods cost no more than an extra £7772. This combination of extra cost for SIP construction together with its highest DER value would make such construction method difficult to justify simply in economic terms.
Table 12 shows the percentage of reduction in CO2 emissions over the base property achieved by each construction method, together with the costs involved for each kg of CO2 reduction. The percentage reduction in CO2 emissions range from15.7% to 24.8% with costs increase range from 8.7% to 24.0%. The extra costs for each kg of CO2 emission reduction range from £11.9 to £44.0. The standard methods of construction can reduce carbon emissions by an average of 22.6% against the base property. However the SIP construction and ICF constructions that have not been enhanced with insulated plasterboard could not achieve the 20% reduction mark. Standard methods prove to be as effective as alternative methods at reducing carbon emissions for an average capital cost increase of 9.1% against the base property. This is equivalent to an extra cost of £13.7 for each kg of CO2 emissions reduction. Table 12 shows that alternative methods could reduce carbon emissions by only 20.5% for an extra cost of 18.4% over the base property. This is equivalent to an extra cost of £31.5 for each kg of CO2 emission reduction. These results disagree with the findings by Turner and Townsend (2007) who suggested that a 20% reduction in CO2 emissions can be achieved with up to a 5% increase in capital costs. However, it should be considered that they looked at more than just the fabric of the building and prices have risen significantly since 2007. In addition, Energy Saving Trust (2010) found that by improving the fabric of a building alone the carbon emissions could be reduced by 25%. The next stage was to look at the optimum combination of construction methods that could reduce carbon emissions by more than 25%.
| DER kg of CO2/m2 per year | CO2 emissions kg/yr (% reduction over base property) | Extra costs (% over base property) | Costs in £ per kg CO2 emissions reduction | |
|---|---|---|---|---|
| Base property costs £77264 | 21.83 | 2286 (0) | 0 (0) | 0 |
| Standard improvement 1 | 16.42 | 1720 (24.8) | 6738 (8.7) | 11.9 |
| Standard improvement 2 | 17.42 | 1812 (20.7) | 6799 (8.8) | 14.3 |
| Standard improvement 2.1 | 17.28 | 1797 (21.4) | 6932 (9.0) | 14.2 |
| Standard improvement 3 | 16.81 | 1746 (23.6) | 7772 (10) | 14.4 |
| Alternative method 1: SIP | 18.33 | 1928 (15.7) | 15753 (20.4) | 44.0 |
| Alternative method 1.2 | 17.25 | 1811 (20.8) | 18558 (24.0) | 39.1 |
| Alternative method 2: ICF | 17.49 | 1838 (19.6) | 13619 (17.6) | 30.4 |
| Alternative method 2.1 | 16.78 | 1760 (23.0) | 15302 (19.8) | 29.1 |
| Alternative method 3 | 16.91 | 1756 (23.2) | 7901 (10.2) | 14.9 |
Table 12: Percentage of CO2 emissions reduction and extra costs for each construction method.
Specifying a building fabric with the optimal thermal performance
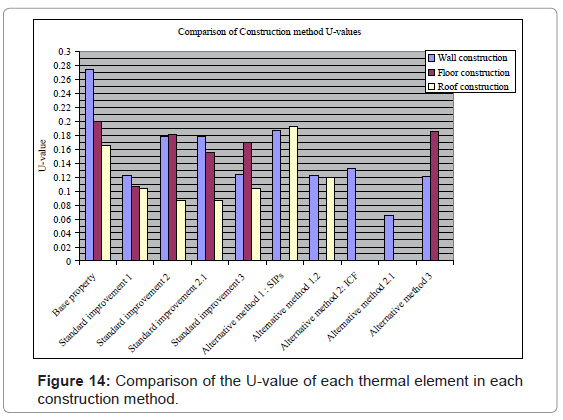
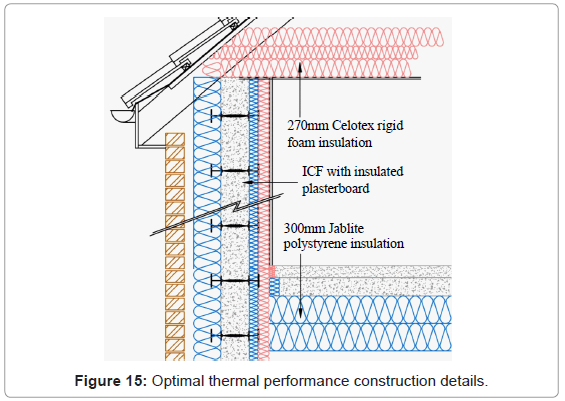
Figure 14 compares the U-value of each thermal element within each construction method. Windows have not been included as triple glazed with low emissivity and U-values of 0.8 W/m2K were used for all construction methods. Figure 14 shows that the wall construction in alternative method 2.1 (i.e. the ICF with insulated plasterboard, U-value of 0.065 W/m2K) would provide the best U-values while the floor construction in standard improvement 1 would give a U-value of 0.106 W/m2K. For the roof construction in standard improvement 2 was selected to give a U-value of 0.087 W/m2K. If all of these constructions were combined and an air tightness based on the levels specified for each of the construction methods was assumed then a combined building fabric could be tested in improving energy efficiency in dwellings. Such construction details are shown in Figure 15 and Table 13. The extra over the costs from the base property was estimated to be £16216.
| Element | Specification | U-Value W/m²K |
|---|---|---|
| External Walls: Insulated concrete formwork | 102.5 mm Brickwork outer leaf. (0.77 W/m²K) 50 mm cavity. 150 mm extruded polystyrene plank (0.029 W/m²K) 151 mm concrete core(1.35 W/m²K) 50 mm extruded polystyrene plank (0.029 W/m²K) 72.5 mm Kingspan Kooltherm K18 insulated dry lining board to underside of joists comprising 12.5 mm plasterboard facing bonded to 60mm thick rigid phenolic insulation (0.021 W/m²K) | 0.065 |
| Ground Floor: Solid Floor | 65 mm screed, 100 mm concrete slab, 1200 gauge polyethylene damp proof membrane, 300 mm expanded polystyrene insulation Jablite Jabfloor 70 (0.038 W/m²K), 225 mm compacted hardcore. | 0.106 |
| Roof: Cold Pitched Roof | Timber trussed cold roof, 38 × 100 mm softwood members at 450 mm centres, 270 mm Celotex GA4000 polyisocyanurate rigid foam insulation between and over joists (0.022 W/m²K). 9.5 mm Gyproc wallboard plasterboard finishes to underside of joists. (0.19 W/m²K) | 0.087 |
| Windows: Triple glazed | PVCu triple glazed sealed units with low e coated glazing. | 0.8 |
| Air Tightness | Air tightness 4 m3/hr/m2 | |
| Ventilation | Low energy extract fan in cloakroom. Natural ventilation elsewhere, opening lights and trickle vents on all windows. | |
| Costs | Extra over costs from base property £16216 |
Table 13: Optimal thermal performance construction details and extra costs involved.
All the details were entered into the NHER software to produce SAP ratings and details of carbon emissions. The results are summarised in Table 14.
| Target Emission Rate (TER) to comply with 2010 Part L | 16.46 kg CO2/m2/yr |
| Dwelling Emission Rate (DER) | 15.44 kg CO2/m2/yr |
| Total CO2 kg/yr | 1597 kg/yr |
| SAP Rating | 87 |
| % CO2 reduction over base property | 30.1% |
| % Cost over base property | 21% |
| Cost in £ per kg CO2 emissions reduction | £23.5 |
Table 14: Optimal thermal performance construction SAP results.
The results for this building fabric has exceeded the TER for Part L 2010 but still fails to meet the UK government target for 2013 which is 12.29 kg CO2/m2/yr. This shows that using today’s technology improvements to the building fabric alone can reduce the CO2 emissions of the base property by 689 kg/yr (30.1%) and meet compliance criteria in Part L 2010. Such reduction in CO2 emissions could be achieved for a capital cost increase of 21% over the base property. However, the proposed building fabric would need to be combined with low and zero carbon technologies to fulfil Part L requirements in 2013, and eventually zero carbon target in 2016.
Specifying the most cost effective building fabric improvements
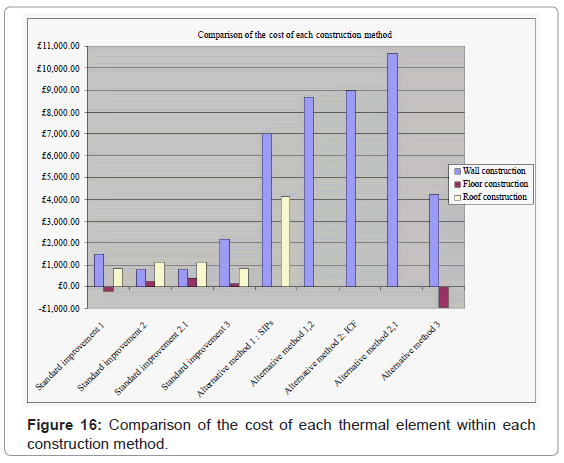
Figure 16 compares the cost of each fabric element within each improvement method; windows have not been included as they were the same for all construction methods with an extra cost of £4636. It can be seen from Figure 16 that the most cost effective construction methods would be a combination from the wall details in standard improvement 2 construction methods, together with floor construction details in alternative method 3 and roof details of standard improvement 1 construction method. Such combination details are shown in Table 15 and Figure 17. The extra over costs from base property was estimated to be £5314.
| Element | Specification | U-Value W/m²K |
|---|---|---|
| External Walls: Cavity walls | 102.5mm Brickwork outer leaf. (0.77 W/m²K) 150mm cavity with 100mm Celotex CW4000 polyisocyanurate rigid foam insulation. (0.022 W/m²K) 50mm air gap. 100 mm lightweight concrete blocks. Tarmac Toplite Standard (0.15 W/m²K).13 mm plaster. (0.48 W/m²K) | 0.178 |
| Ground Floor: Floating Floor | 18 mm tongue and groove chipboard (0.13 W/m²K), 150 mm Jablite Jabfloor 70 expanded polystyrene (0.038 W/m²K), 1200 gauge polyethylene damp proof membrane, 100 mm concrete slab (1.35 W/m²K), 225 mm compacted hardcore. | 0.185 |
| Roof: Cold Pitched Roof | Timber trussed cold roof, 38 × 100 mm softwood members at 450 mm centres, 100 mm Rockwool Roll between joists with 200 mm laid over at right angles to the joists (0.044 W/m²K). 72.5 mm Kingspan Kooltherm K18 insulated dry lining board to underside of joists comprising 12.5 mm plasterboard facing bonded to 60mm thick rigid phenolic insulation (0.021 W/m²K) | 0.104 |
| Windows: Triple glazed | PVCu triple glazed sealed units with low coated glazing. | 0.8 |
| Air Tightness | Air tightness 7 m3/hr/m2 | |
| Ventilation | Low energy extract fan in cloakroom. Natural ventilation elsewhere, opening lights and trickle vents on all windows. | |
| Costs | Extra over costs from base property £5314 |
Table 15: The most cost effective building fabric construction details and extra costs involved.
All the details were entered into the NHER software to produce SAP ratings and details of carbon emissions. The results are summarised in Table 16.
| Target Emission Rate (TER) to comply with 2010 Part L | 16.46 kg CO2/m2/yr |
| Dwelling Emission Rate (DER) | 17.54 kg CO2/m2/yr |
| Total CO2 kg/yr | 1825 kg/yr |
| SAP Rating | 86 |
| % CO2 reduction over base property | 20.2% |
| % Cost over base property | 6.9% |
| Cost in £ per kg CO2 emissions reduction | £11.5 |
Table 16: The most cost effective building fabric SAP results.
Such construction method would produce the most cost effective option to reduce carbon emissions by 461 kg/yr (20.2%) for a total extra cost of £5314 over the base property costs. This option has not met the criteria as presented in Part L 2010. However, the price for each kg of CO2 saved was £11.5 compared with £23.5 for the optimal improvement (Table 14) which is more than double the cost.
Conclusion
The impact of six different fabric construction methods on energy performance and costs, for a typical UK four bedroom two storey detached dwelling has been investigated. Also, this paper has considered the importance of improving the thermal performance of an existing UK solid-wall dwelling with a single story extension.
The UK Government’s Standard Assessment Procedure (SAP), which is based on the Building Research Establishment Domestic Energy Model, was used to energy rate the dwelling. The capital costs were estimated from data published by the Building Cost Information Services applied to Leicester UK area in 2011. The following conclusions can be drawn from this study:
1. The standard methods of construction could reduce carbon emissions by an average of 22.6% for an extra cost of 9.1% against the base property, while the alternative methods could reduce carbon emissions by an average of 20.5% for capital cost increase of 18.4% over the base property. This suggests that standard methods are continually favoured over other form in the construction of dwellings.
2. The industry has recognised that there is a reluctance to embrace alternative methods and has responded by endeavouring to improve the standard methods of construction. With continuing advances in standard constructions it becomes increasingly unlikely that these methods will lose ‘their crown’ to alternative methods.
3. Through alterations to the building fabric alone, a reduction of 30.1% in the carbon emissions of the base property can be attained. However, the proposed building fabric would need to be combined with low and zero carbon technologies to fulfil future Part L requirements, and eventually zero carbon target in 2016.
4. A reduction of 20.2% in the carbon emission of the base property could be achieved for an extra cost of 6.9%. This is equivalent to £11.5 for each kg of CO2 emissions reduction representing the most cost effective building fabric improvements of the methods tested.
5. Other parameters that affect the choice of construction method would include the build time, construction lifespan, whole project costs, construction dimensions and investment payback period through reduction in running costs. These should be undertaken to discover whether alternative methods could provide any outstanding benefits to influence their use on construction projects.
6. Construction technology is continually advancing and the possibility of prefabricating thermal elements for buildings is extended to more methods. This can now be used for masonry construction and straw bale construction aiding the construction industry on its road to zero carbon. The industry needs to understand the construction processes and physics of the building components. Further investigation should be carried out to determine the implications for the future.
7. This study has investigated three alternative methods. Modular construction and timber frame could be included in future studies to evaluate thermal performance targets. Another route to achieving lower carbon emissions could be through the use of natural methods of construction including straw bale and rammed earth.
8. The solid wall housing stock, in particular with proposed extension being constructed to an existing dwelling, offers a great opportunity to reduce carbon emissions by 21.7% with an increase of refurbishment costs by only 4.7%. These results show that any attempt to construct a new extension to an existing solid-wall dwelling needs to consider refurbishing the existing part to enhance the overall energy efficiency and reducing heating bills.
Acknowledgements
The authors express their gratitude to Ben Hall for the provision of images and data.
References
- Department of Energy and Climate Change (2010) Digest of United Kingdom Energy Statistics.
- Department of Energy and Climate Change (2008) the Climate Change Act.
- Communities and Local Government (2007) Building a Greener Future: Policy Statement. Communities and Local Government Publications.
- Boardman B, Darby S, Hinnells M, Killip G, Layberry R et al. (2005) 40% House, Oxford: Environmental Change Institute, University of Oxford . ECI Research Report No. 31
- Turner and Townsend (2007) The impact on costs and construction practice in Scotland of any further limitation of carbon dioxide emissions from new buildings. Scottish Building Standards Agency.
- Langdon, Davis (2009) Assessing the costs of Nordic domestic energy standards. Building Standards Division, The Scottish Government.
- Langdon, Davis (2008) Cost impact analysis for low carbon and ecohomes standard housing using lifecycle costing methodology. Scottish Government Social Research.
- Zero Carbon Hub (2009) Defining a fabric energy efficiency standard: For zero carbon homes. Milton Keynes.
- Energy Saving Trust (2010) Fabric First: Focus on fabric and services improvements to increase energy performance in new homes.
- Department for communities and Local Government (2010) Code for sustainable homes: A Cost Review. Communities and Local Government Publications.
- Williams K, Dair C (2007) What is stopping sustainable building in England? Barriers experienced by stakeholders in delivering sustainable developments. Sustainable Development 15: 135-147.
- Osmani M, O’Reilly A (2009) Feasibility of zero carbon homes in England by 2016: A house builder’s perspective. Building and Environment 44: 1917-1924.
- King C, Weeks C (2010) Sustainable Refurbishment of non-traditional housing and pre-1920's Solid Wall Housing.BRE Press, Garston, 2010. Report No. Information Paper IP 3/10. ISBN No. 978-1-84806-119-4.
- Anderson BR, Clark AJ, Baldwin R, Milbank NO (1985) BREDEM-BRE Domestic Energy Model: background, philosophy and description. BRE Report: BR 66, BRE, Garston.
- Anderson BR, Chapman PF, Cutland NG, Dickson CM, Doran SM et al. (1997) BREDEM-8 Model description–BRE, Garston.
- ISO 13790 (2008) Energy performance of buildings-Calculation of energy use for space heating and cooling Geneva: International Standards Organisation.
- National Audit Office (2005) Using modern methods of construction to build homes more quickly and efficiently. London. National Audit Office.
- Wang Y, Huang Z, Heng L (2007) Cost–effectiveness assessment of insulated exterior walls of residential buildings in cold climate. International journal of project management 25: 143–149.
- Built Passive Houses (2010) Project information ID 1779.
Relevant Topics
- Architect
- Architectural Drawing
- Architectural Engineering
- Building design
- Building Information Modeling (BIM)
- Concrete
- Construction
- Construction Engineering
- Construction Estimating Software
- Engineering Drawing
- Fabric Formwork
- Interior Design
- Interior Designing
- Landscape Architecture
- Smart Buildings
- Sociology of Architecture
- Structural Analysis
- Sustainable Design
- Urban Design
- Urban Planner
Recommended Journals
Article Tools
Article Usage
- Total views: 18559
- [From(publication date):
December-2012 - Aug 29, 2025] - Breakdown by view type
- HTML page views : 13883
- PDF downloads : 4676

