Environmental Vulnerability to Climate Change and Anthropogenic Impacts in Dryland, (Pilot Study: Middle Draa Valley, South Morocco)
Received: 27-Mar-2014 / Accepted Date: 01-May-2014 / Published Date: 04-May-2014
Abstract
The Middle Draa Valley (MDV) is an oasitic region characterized by an arid climate. The local economy is based on agriculture, and also on tourism. Water scarcity and lack of dense vegetation make it an area vulnerable to climatic change. The environmental vulnerability is accelerated by human pressure and by the high poverty rate that is the highest in the country, thus forcing the population to the overexploitation of this oasitic ecosystem. The purpose of this paper is the realization, of a detailed qualitative analysis based on calculations of a representative number of indicators of environmental vulnerability index (EVI) developed by Stockholm Environment Institute (SEI) and mapping additional factors specific of oasitic system that places an impact environmental vulnerability. The results of this study pave the way to classify this region as a vulnerable area to climate change and anthropogenic impacts.
Keywords: Vulnerability; Oasean ecosystem; Impact; Climate change; Anthropogenic factors
10587Introduction
Morocco’s oases suffer from a serious deterioration due particularly to climate change, made even worse by demographic and urban pressure [1]. Middle Draa Valley (MDV) is one of these oases. More pressure is being placed on the environment, which can be damaging if coupled with poor environmental management. In drylands like MDV, the economic and social vulnerabilities have been extensively studied, but showed only a limited understanding of the overall problem. The Environmental Vulnerability Index (EVI) developed by South Pacific Commission for Applied Sciences (SOPAC), looks specifically, and for the first time, into the issue of environmental vulnerability. Vulnerability has received growing international recognition as an issue of central concern to the sustainable development of countries [2]. According the Intergovernmental Panel on Climate Change [3], vulnerability is the susceptibility of a system to be harmed by climate variability and change including its exposure, sensitivity and ability to cope with or adapt to adverse affects. In addition to climate, drylands display a close human-nature interdependence based on marginal natural resources and are often home to marginalized populations [4]. It is in this context that the Environmental Vulnerability Index (EVI) for the Middle Draa Valley is calculated. The EVI is a numerical index that reflects the status of a country or a region’s environmental vulnerability. This index was designed for anthropogenic, meteorological, biological, and geological issues and for general characteristics. The overall EVI for MDV is determined by the calculating of 50 indicators. The EVI focuses on the vulnerability of the environment to natural risks and to human mismanagement, including the effects on the physical and biological aspects of the ecosystems, diversity, populations and organisms, communities, and species [5]. In the case of MDV, The general problems encountered are [6]:
• Sensitive water resources
• Demographics booming regulated migration
• Socio-spatial Mutations causing an imbalance in the land use
• Risk of extinction oases
Anthropogenic pressure is a major factor influencing land degradation, causing desertification. Droughts exacerbate the degradation processes [7]. The population continues to grow [8] in this less-favored area, but crop yields grow little if not at all [9], resulting in worsening poverty, food insecurity and widespread degradation of natural resources. MDV is especially vulnerable to climate change because of its geographic exposure, low incomes, and greater reliance on climate-dependent sectors such as agriculture [10]. Adaptive and resilient strategies to cope with climate change are the solution to reduce the environmental vulnerability [6].
Methodology
Study area
The MDV (Figure 1) is characterized by a 200 km belt of six aligned oases (from upstream to downstream: Mezguita-Tinzouline-Ternata- Fezouata-Ktaoua-M’hamid) (Figure 2) [11]. The geology of MDV is determined by three of the five major geological structures of Morocco [12] Anti-Atlas, the High Atlas and the pre-Sahara. The total surface of the six Draa oases is 26,000 ha are arable land and irrigated-dependent land. The six oases vary in size and the number of farmers. Ktaoua is the largest oasis with over 7000 ha of farmland. M’hamid, in the far south is the smallest oasis [13]. The study area reaches from the southern slopes of the High Atlas Mountains to the Lac Iriki in the Saharan Foreland (Figure 2). It covers an area of approximately 15 000 km², 378 to 1100 m above sea level. The main administrative units are the provinces of Zagora and one part of Ouarzazate [1]. It is located in part in Draa Valley which extends over an area of 30000 km2 (Figure 2).
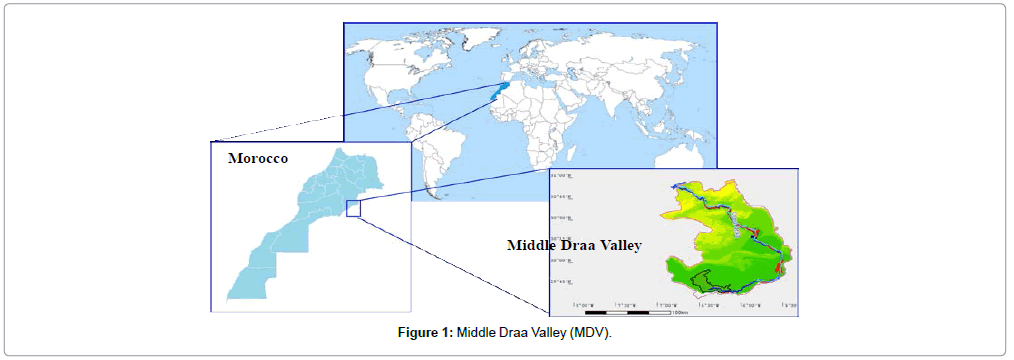
Figure 1: Middle Draa Valley (MDV).
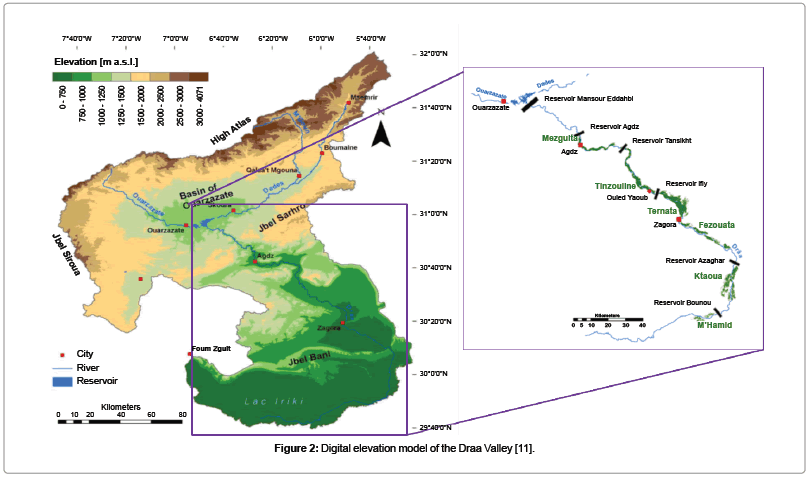
Figure 2: Digital elevation model of the Draa Valley [11].
According to the classification of Koeppen [14,15], MDV is marked with its hot and arid climate. This is also affected by its geographical position south; and experiences few but sometimes heavy rainfall occasions, typical of desert and steppe climates [16].
Various studies have confirmed the same projections of future climate [17-19]. In fact, according to a study conducted by PACC/ OASIS Project (Figure 3), showed that the winter season (Figure 3A) would know a reduction in total average rainfall for the entire oasitic area. This reduction would be estimated at 20% for 40% in Zagora (MDV). The average annual temperature of oasitic region (Figure 3B) would experience an increase which would range from 1.6 to 1.8°C for Zagora province (MDV).
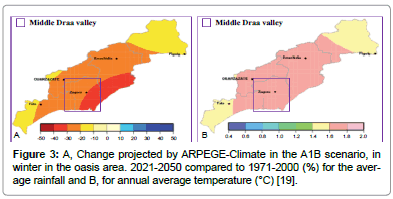
Figure 3: A, Change projected by ARPEGE-Climate in the A1B scenario, in winter in the oasis area. 2021-2050 compared to 1971-2000 (%) for the average rainfall and B, for annual average temperature (°C) [19].
According the report [19], downscaling techniques, used, include developing climate change scenarios to fine spatial scales from MCG output coarser resolution. This study uses two methods (dynamical and statistical downscaling including MCG): dynamical downscaling using the outputs of the ARPEGE-Climate models and statistical downscaling using SDSM model. The SDSM model is calibrated using the largescale predictors from the NCEP reanalysis (National Center for Environmental Prediction)/NCAR (National Center for Atmospheric Research). Reanalyses from the associations of these two U.S. agencies cover a period of 50 years re-analysis, were interpolated in this study, on the grid (Gaussian) of MCCG3 for the period of the current climate (1961-2003). The results in the Figure 3 cover the period of 1960- 2010/2021-2050, with a spatial resolution of 50 km and 60 km. The period choice is based on the following elements (after the same report):
· Makers and specialists have particular interests to the nearest horizons such as 2012.
· Climatologists and experts in climate modeling, warned about the fact that in near horizons the natural variability, especially in the case of rainfall, is still dominant.
· The period 2021-2050 was chosen by the European project FP6-ENSEMBLES.
The future changes are evaluated under the IPCC-A1B scenario, which is an intermediate scenario part of the scenario family A12. A1B scenario differs from the two other scenarios of the family (A1FI and A1T) by technological change in the energetic sector. Because in 2010 the king of Morocco introduced the new Moroccan Renewable Energy Plan with the aim to install five solar power plants before 2020, with a total capacity of 2000 Megawatts (Mw) and a cost of around Euro 7 billion, the first phase of the Moroccan Solar Plan with a capacity of 500 MW [7], was implemented by MASEN to cover an area of 2,500 ha in upstream zone of the study area.
By way of example, we include a second study (local study) carried out under the same scenario, between the periods (2036-2050) minus (1986-2000). The regional scale climate model REMO was nested into ECHAM5 global climate model data. The SRES A1B greenhouse gas scenario prescribes global-scale climate change forcing. The subsequent statistical downscaling produces spatially distributed climatic features in the Draa region [16]. In the maps A and B the climate change signal shows overall drying (Figure 4).
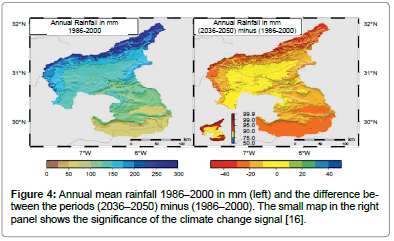
Figure 4: Annual mean rainfall 1986–2000 in mm (left) and the difference between the periods (2036–2050) minus (1986–2000). The small map in the right panel shows the significance of the climate change signal [16].
The climatic change (precipitation decreases and temperature increases) induces the reduction in vegetation cover, and leads to an increase in soil erosion, which will accelerate reservoir siltation and the lessening of the water resources and agriculture sector, which makes the region to vulnerable.
The hydrology of the MDV is controlled by releases of Mansour Eddahbi Dam which was constructed in 1972 with an initial capacity of 583 million m3. The Mansour Eddahbi Dam is a way to tap water to generate hydroelectric power, control floods by reducing fluctuations in water level, and increase the amount of water available for irrigation, thus, irrigating larger agricultural areas all year round. However, the Mansour Eddahbi experienced a number of problems which include siltation. Indeed, the capacity was reduced by approximately 25% to 438 Mm3 (in 1998) due to siltation. This corresponds to a serious erosion rate of 5.6 tons/ha/year [20]. According to forecasts (Figure 5), water level in the dam would dwindle in the future due to different scenarios.
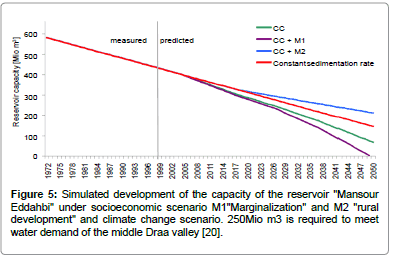
Figure 5: Simulated development of the capacity of the reservoir "Mansour Eddahbi" under socioeconomic scenario M1"Marginalization" and M2 "rural development" and climate change scenario. 250Mio m3 is required to meet water demand of the middle Draa valley [20].
After construction of the Mansour Eddahbi Dam, the Iriki Lake (downstream) became completely dry as is shown in the two figures below. Pecture (Figure 6) were taken in 1969 before the construction of the Mansour Eddahbi Dam, while pecture B shows the disappearance of the lake in 2000.
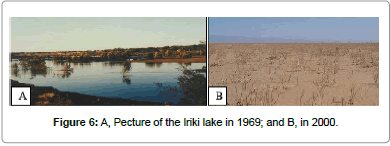
Figure 6: A, Pecture of the Iriki lake in 1969; and B, in 2000.
The Iriki Lake has an undeniable originality and renown as a meeting place for various tribes. According to HCEFLCD (2007) [21], this lake was once famous for its biodiversity and cultural richness. It provided an important habitat for birds and a migration path between Europe and Africa. In addition to their ecological importance, the lake has a unique heritage. It played a vital role in the economic progress and social development of local aboriginal communities. As a consequence of the construction of this reservoir, 32 species of birds are already extinct [21]. In addition, the dam allows the development of intensive irrigation, causing an increase in soil salinity especially in the downstream, which deteriorates the quality of the soil. More local people are forced to move. That raises the issue of resettlement of displaced populations as well as finding them jobs, which lead to the increase in unemployment and poverty.
The Draa Valley is mainly rural and its economy remains highly dependent on irrigated agriculture [22]. Although the agriculture is mostly to provide subsistence and for local consumption [23], the oases North Mezguita and Tinzouline (upstream) have benefited from the use of groundwater, but the southern oases, Ktaoua and M’hamid (downstream) had neither water nor groundwater quality (Figure 7).
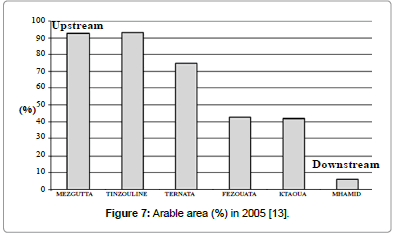
Figure 7: Arable area (%) in 2005 [13].
From upstream to downstream, it depicts a decrease in the cultivated area of each oasis. For example, in a drought-stricken year like 2005, downstream palm groves (Fezouata and Ktaoua) were cultivated in 40% of the total arable area. The situation in M'HAMID surrounding Iriki Lake is even worse; in fact, the area did not exceeded 10% of the total arable area. A drought-stricken year has the same effect on livestock. Scarcity and lack of precipitation impacts the forage availability which reduces the number of animal life (Figure 8) [24].
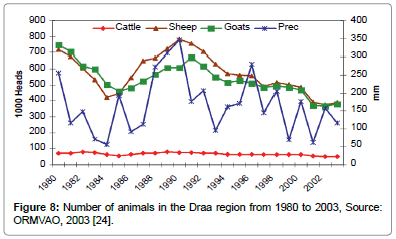
Figure 8: Number of animals in the Draa region from 1980 to 2003, Source: ORMVAO, 2003 [24].
The plants health is another problem which threatens the oasis. The region suffers from the extension of Bayoud (Fusarium oxysporum F. sp. Albedinis) disease, a soil fungus that attacks the finest date palm trees. Over the past decade Moroccan oasis space devoted for date production decreased by 34% [25], partly due to the spread of the fungus.
The development of agriculture in the periphery of the palm grove and therefore uncontrolled digging boreholes leads to accelerated water groundwater depletion. For example, at the Feija Imssoufa, more than 350 ha were developed and equipped with 226 wells with 171 pumps, the average of one well per 2 ha. Several areas of similar extension to Feija are observed around the MDV [26]. Since the construction of Mansour Eddahbi Dam in 1972, the number of motor pumps has increased steadily. It is estimated that in 1977, the six oases had about 2000 pumps, and in 1985 this figure had doubled (Table 1) [27]. In 2005, the number of motor pumps has increased to nearly 7,000 for the whole MDV.
| 1977 | 1982 | 1985 | 2005 | |
| Total pumps | 2001 | 2363 | 4520 | 6905 |
Table 1: Pumps number in 1977, 1982, 1985 and 2005 in the palm of MDV [27].
What aggravates the situation is the orientation of farmers to more profitable crops but harmful in the long run, especially the cultivation of watermelons which dramatizes the demand for water. In fact, from 2012 to 2013 the area is almost doubled (670 in 2012 to 1130 in 2013) [28] and Figure 9, which green stains are watermelons crops in 2000, 2003, 2007 and 2013). Evolution of watermelons area is well illustrated in Figure 8, by satellite imagery that we acquired from USGS, in the last ten years and in the same time of year, which coincides with the watermelons period.
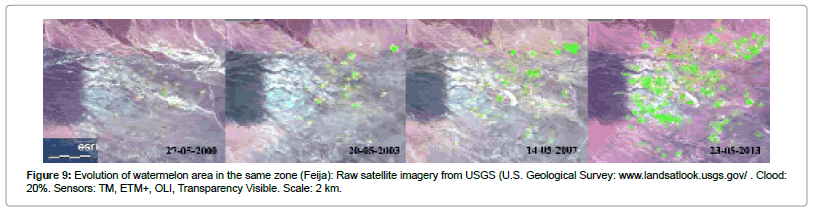
Figure 9: Evolution of watermelon area in the same zone (Feija): Raw satellite imagery from USGS (U.S. Geological Survey: www.landsatlook.usgs.gov/ . Clood: 20%. Sensors: TM, ETM+, OLI, Transparency Visible. Scale: 2 km.
Regarding the tourism pressure on water resources; the situation is alarming; in fact, this sector causes an increasing pressure on water resources. For example the consumption of water by tourism increased from 15,967 m3 in 1982 to 89 575 m3 in 2000, an increase of 461% [26].
The environmental vulnerability is accelerated by social vulnerability, as shown in the Table 2, which shows a high poverty and illiteracy rate that makes the oasitic communities of Middle Draa valley often at the periphery of society, geographically, and economically.
| Urban area | Rural area | |
|---|---|---|
| Population | 42 802 | 240 566 |
| Population density | 256/km2 | 11/km2 |
| Human Development Indicators (HDI) | 0.65 | 0.52 |
| Illiteracy | 34.75% | 55% |
| Poverty rate | 12.75% | 37.64% |
Table 2: Zagora (Middle Draa Valley) [6].
Methodology
Qualitative analysis of environmental vulnerability in MDV using EVI: The Environmental Vulnerability Index (EVI) is designed to summarize a wide range of environmental vulnerability information about a country or a region. To achieve this index with 50 indicators, it was necessary to collect data from a variety of sources, including bibliographic data, government ministries, and environmental organizations. Information was also gathered it surveyed through questionnaires in MDV. The data gathered pertained to the particular indicator to be calculated and represented the 5 last years (e.g. for Farming) for indicators and last 30 years for others (e.g. for Climate). This index is determined for anthropogenic, meteorological, biological, and geological events and for general characteristics. The overall EVI for MDV was determined by the calculating 43 indicators from a total of 50, which is short of the 80% minimum requirement [2]. Data for the meteorological indices were obtained from the ORMVAO (Office Régional de Mise en Valeur Agricuole d’Ouarzazate) and ABHO (Agence du basin hydraulique d’Ouarzazate); and data for the biological, anthropogenic, and region characteristic indices were obtained primarily from Tourist Board, ONEE (National Office of Electricity and drinking water) , and the Ministry of Energy. To be consistent with the methods of the South Pacific Applied Geosciences Commission, the calculation of the indices was based on the units of measurement used in the indicators (Tables 3 and 4).
| No | Type | Category | Sub- Index |
Description | MDV | Unit |
|---|---|---|---|---|---|---|
| 1 | Wind | Weather & climate | CC D CCD |
Average annual excess wind over the last five years (summing speeds on days during which the maximum recorded wind speed is greater than 20% higher than the 30 year average maximum wind speed for that month) averaged over all reference climate stations. | 1 | days/yr |
| 2 | Dry | Weather & climate | CC D AF W CCD |
Average annual rainfall deficit (mm) over the past 5 years for all months with >20% lower rainfall than the 30 year monthly average, averaged over all reference climate stations. | 2 | mm/station/ yr |
| 3 | Wet | Weather & climate | CC D AF W CCD |
Average annual excess rainfall (mm) over the past 5 years for all months with >20% higher rainfall than the 30 year monthly average, averaged over all reference climate stations. | 1 | mm/station/ year |
| 4 | Hot | Weather & climate | CC D CCD |
Average annual excess heat (degrees Farenheit) over the past 5 years for all days more than 9F (5°C) hotter than the 30 year mean monthly maximum, averaged over all reference climate stations. | 4 | degrees/yr |
| 5 | Cold | Weather & climate | D CCD |
Average annual heat deficit (degrees) over the past 5 years for all days more than 5°C cooler than the 30 year mean monthly minimum, averaged over all reference climate stations. | 3 | degrees/yr |
| 7 | Volcano | Geology | D | Cumulative volcano risk as the weighted number of volcanoes with the potential for eruption greater than or equal to a Volcanic Explosively Index of 2 (VEI 2) within 100km of the country land boundary (divided by the area of land). | 1 | VEI Units/million sq km |
| 8 | Earth-quake | Geology | D | Cumulative earthquake energy within 100km of country land boundaries measured as Local Magnitude (ML) = 6.0 and occurring at a depth of less than or equal to fifteen km (=15km depth) over 5 years (divided by land area) | 1 | Number ML >= 6, Depth <= 15km |
| 9 | Tsunami | Geology | D | Number of tsunamis or storms surges with run-up greater than 2 metres above Mean High Water Spring tide (MHWS) per 1000km coastline since 1900 | 1 | Number since 1900 >2m run-up |
| 10 | Slides | Geology | D | Number of slides recorded in the last 5 years (EMDAT definitions), divided by land area | 1 | Slides/million sq km land |
| 11 | Land | Geography | CC CBD |
Total land area (km2) | 4 | sq km |
| 12 | Dispers-ion | Geography | CC CBD |
Ratio of length of borders (land and maritime) to total land area | 4 | km/1000 sq km |
| 13 | Isolation | Geography | CBD | Distance to nearest continent (km) | 6 | km |
| 14 | Relief | Geography | CC CCD CBD |
Altitude range (highest point subtracted from the lowest point in country) | 1 | m |
| 15 | Lowlands | Geography | CC CCD CBD |
Percentage of land area less than or equal to 50m above sea level | 1 | % |
| 16 | Borders | Geography | CBD | Number of land and sea borders (including EEZ) shared with other countries | 2 | number |
| 18 | Openness | Resources & Services |
AF CBD |
Average annual USD freight imports over the past 5 years by any means per km2 land area | 1 | USD Thousands/sq km land |
| 19 | Migrat-ory | Resources & Services |
AF CBD |
Number of known species that migrate outside the territorial area at any time during their life spans (including land and all aquatic species) / area of land | 3 | Spp/1000 sq km land |
| 20 | Endemics | Resources & Services |
CBD | Number of known endemic species per million square km land area | 6 | Spp/1,000,000 sq km land |
| 21 | Introduc-tions | Resources & Services |
AF CBD |
Number of introduced species per 1000 square km of land area | 2 | Spp/1,000 sq km land |
| 22 | Endang-ered | Resources & Services |
CBD | Number of endangered and vulnerable species per 1000 sq km land area (IUCN definitions) | 4 | Spp/1,000 sq km land |
| 23 | Extin-ctions | Resources & Services |
AF CBD |
Number of species known to have become extinct since 1900 per 1000 sq km land area (IUCN definitions). | 4 | Spp/1,000 sq km land |
| 25 | Loss Veg | Resources & Services |
AF W CCD CBD |
Net percentage change in natural vegetation cover over the last five years | 5 | % change (-ve = loss) |
| 26 | Fragment | Resources & Services |
AF CBD |
Total length of all roads in a country divided by land area | 1 | km/sq km |
| 27 | Degrada-tion | Resources & Services |
W CCD |
Percent of land area that is either severely or very severely degraded (FAO/AGL Terrastat definitions) | 7 | % |
| 28 | Reserves | Resources & Services |
AF W CBD |
Percent of terrestrial land area legally set aside as no take reserves | 1 | % of land area |
| 30 | Farming | Resources & Services |
AF W |
Annual tonnage of intensively farmed animal products (includes aquaculture, pigs, poultry) produced over the last five years per square km land area. | 5 | t/sq km/yr |
| 31 | Fertili-zers | Resources & Services |
HH AF W |
Average annual intensity of fertilizer use over the total land area over the last 5 years. | 2 | kg/sq km/yr |
| 32 | Pesticides | Resources & Services |
HH AF |
Average annual pesticides used as kg/km2/year over total land area over last 5 years. | 2 | kg/sq km/yr |
| 33 | Biotech | Resources & Services |
AF | Cumulative number of deliberate field trials of genetically modified organisms conducted in the country since 1986 | 1 | Total number trials |
| 36 | Water | Resources & Services |
HH AF CCD |
Average annual water usage as percentage of renewable water resources over the last 5 years | 7 | % |
| 37 | Air | Resources & Services |
HH | Average annual SO2 emissions over the last 5 years | 1 | t /sq km/yr |
| 38 | Waste | Resources & Services |
-- | Average annual net amount of generated and imported toxic, hazardous and municipal wastes per square km land area over the last 5 years | 1 | t/km2/yr |
| 39 | Treat-ment | Resources & Services |
HH W |
Mean annual percent of hazardous, toxic and municipal waste effectively managed and treated over the past 5 years. | 7 | % |
| 40 | Industry | Resources & Services |
Average annual use of electricity for industry over the last 5 years per square km of land | 1 | toe/km2 | |
| 41 | Spills | Resources & Services |
-- | Total number of spills of oil and hazardous substances greater than 1000 litres on land, in rivers or within territorial waters per million km coast during the last five years | 1 | Number of spills/million km coasts |
| 42 | Mining | Resources & Services |
-- | Average annual mining production (include all surface and subsurface mining and quarrying) per km2 of land area over the past 5 years. | 7 | t/km2/yr |
| 43 | Sanita-tion | Resources & Services |
HH W |
Density of population without access to safe sanitation (WHO definitions) | 4 | people/km2 |
| 44 | Vehicles | Resources & Services |
-- | Number of vehicles per square km of land area (most recent data) | 1 | vehicles /km2 |
| 45 | Density | Human Populations |
CC D W |
Total human population density (number per km2 land area) | 1 | people/km2 |
| 46 | Growth | Human Populations |
W | Annual human population growth rate over the last 5 years | 6 | % |
| 47 | Tourists | Human Populations |
-- | Average annual number of international tourists per km2 land over the past 5 years. | 7 | people/km2/yr |
| 49 | Agreements | Human Populations | -- | Number of environmental treaties in force in a country | 2 | treaties |
| 50 | Conflicts | Human Populations |
-- | Average number of conflict years per decade within the country over the past 50 years. | 1 | Average conflict years/decade |
Table 3: Summary of environmental vulnerability indices (EVI) for MDV.
| Climate Change | CC | 13 indicators |
|---|---|---|
| Biodiversity | CBD | 19 |
| Water | W | 12 |
| Agriculture / Fisheries | AF | 20 |
| Human Health Aspects | HH | 6 |
| Desertification | CCD | 11 |
| Exposure to Natural Disasters | D | 11 |
Table 4: 50 EVI indicators are grouped into seven categories: sub-indices.
For the indicators 6-17-24-29-34-35-48: Not applicable or not data
Spatial analysis of environmental vulnerability in MDV: In order to make a spatial analysis, we developed a qualitative map using generalized dynamics of natural environmental and human impact. We will add the predefined factors in the EVI, other specific additional factors of oasitic system. The card is made through a program of outputs and socio-economic and ecological survey, supplemented by interviews with the heads of government departments and local organizations working in the field of environment. The interviews took place in 2012- 2013; the interviews were conducted with approximately 100 farmers per oasis, all from different villages within one oasis. We considered by taking villages upstream and downstream along the Draa River. The sample size is 600 farmers of a total of approximately 18,000 farms for the region.
Results
Analysis of environmental vulnerability in MDV using EVI
Based on the analysis of the data collected, the overall Environmental Vulnerability Index (EVI) for the MDV is determined to be 288 (with 86% of data). The Hazards index was determined to be 2.75, the resistance index was 3.38, and the damage index was found to be 2.86. The sub-indices of climate change for MDV was calculated to be 2.6, the biodiversity sub-indices was 3, the Exposure to Natural Disaster index was measured at 1.6, and the Desertification was found to be 3.2, Agriculture/Fisheries is 3, Human Health Aspects is 3.83, and Water 3.75 (Table 5).
| Climate Change | 2.60 | 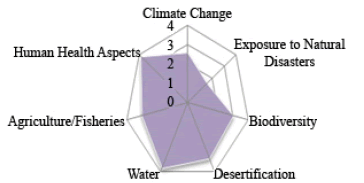 |
| Exposure to Natural Disasters | 1.60 | |
| Biodiversity | 3.00 | |
| Desertification | 3.20 | |
| Water | 3.75 | |
| Agriculture / Fisheries | 3.00 | |
| Human Health Aspects | 3.83 |
Table 5: Environmental vulnerability index (EVI) by category scores for MDV.
The individual scores for each of the indicators used to determine the overall index are illustrated in Figure 10 and Table 3 (in Green color). EVI is not a fixed value it can change in the future to reflect changes in the environmental conditions.
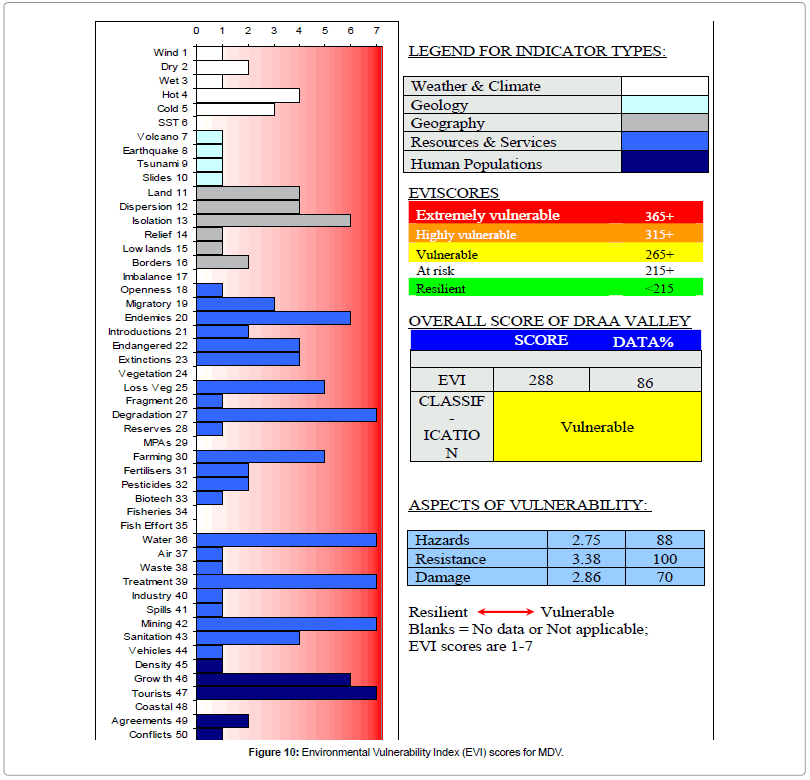
Figure 10: Environmental Vulnerability Index (EVI) scores for MDV.
The extraction and compilation of indicators of environmental vulnerability index can give the graphs of Figure 11, called sub-indices.
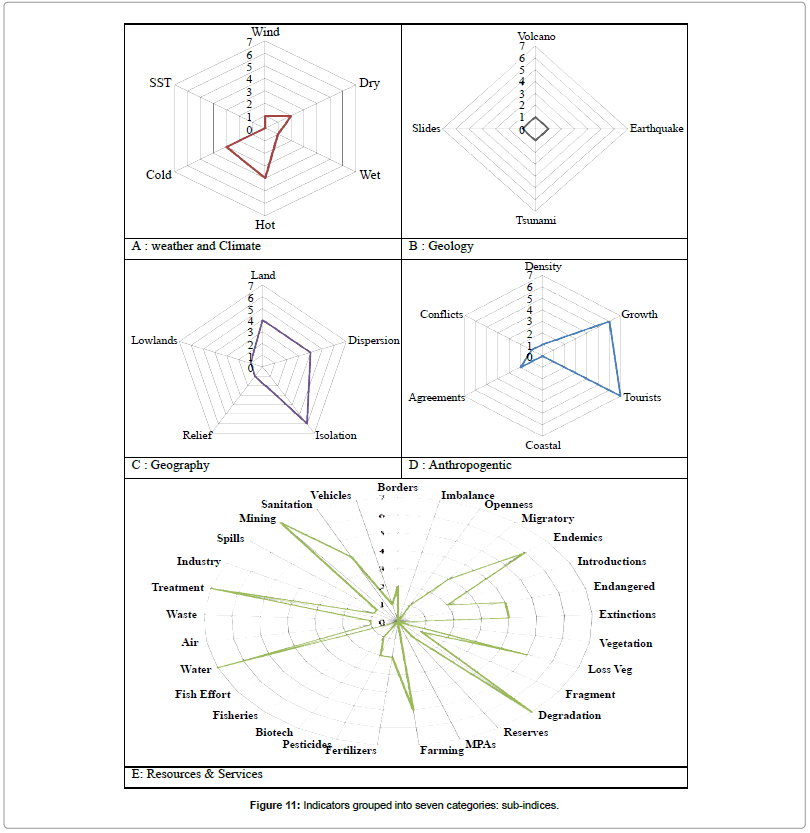
Figure 11: Indicators grouped into seven categories: sub-indices.
Spatial analysis of environmental vulnerability in MDV
The study region is located in an area of high environmental sensitivity zone; subject to great pressure of human activities and climate change. Various factors influencing the environmental vulnerability of MDV are considered. But it should be noted that this selection of factors is not exhaustive, and only those salient factors for which information is of great significance were selected. We use an integrated evaluation criteria system. (Natural, environmental and human vulnerability) [29]. The results of the literature review and survey are summed up the following maps (Figure 12).
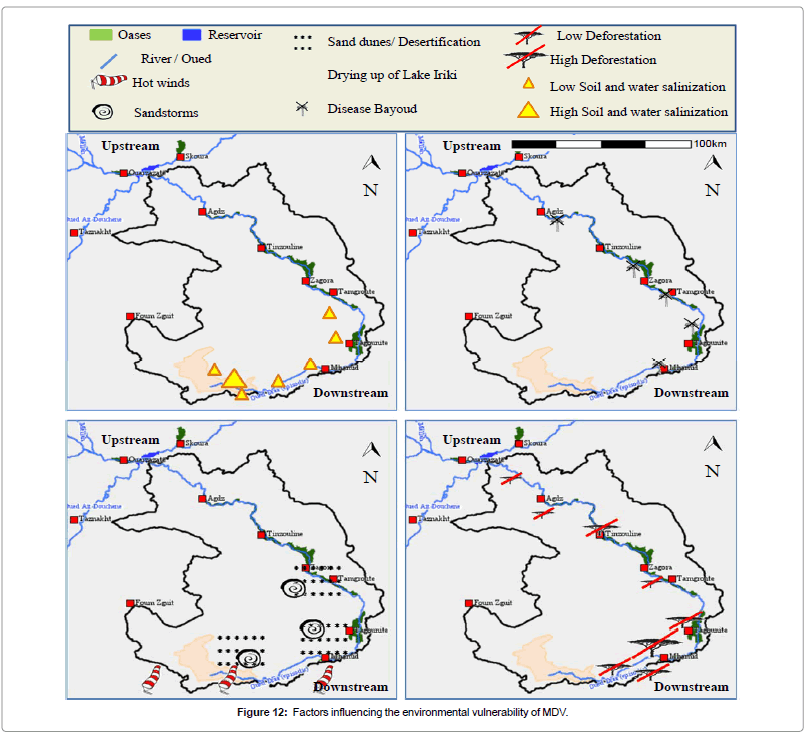
Figure 12: Factors influencing the environmental vulnerability of MDV.
According to these maps and bibliographic analysis, we can retain the following impacts:
• Natural conditions including low topography, arid climate, fragile soil, hot winds, and scarce vegetation cover form an important determinant of vulnerability evaluation.
• Disease Bayoud, siltation reservoir, vegetation degradation, and sand silting are to be taken into because the study area is severely suffering from these earth surface processes and environmental problems.
• Reservoir construction, drying up of Iriki Lake, deforestation, soil and water salinization, Population density, pasturage, and cultivation disturbances are therefore selected to evaluate the impacts of human activities.
Discussion
Analysis of environmental vulnerability in MDV using EVI
The overall EVI score for the MDV is 288, suggests that this area is, on a level, vulnerable to effects from meteorological, biological and anthropogenic sources. This score implies that MDV faces vulnerability issues. The MDV is slightly vulnerable to geological hazards. However, upon closer investigation of the individual indicators, it is evident that there are certain events that, when studied in isolation have a profound effect on the environment and affect areas of high vulnerability for this region. The most important vulnerability issues for this area, those scoring a 6 and 7 on the EVI scale and identified using the EVI, relate to Isolation (13), Endemics (20), Degradation (27), Water (36), Treatment (39), Mining (42), Grouth (46) and Tourists (47).
MDV scored a 4-5 on the EVI scale in several other areas that represent the next most vulnerable aspects of the oases. These included Loss of vegetation (25), Farming (30), Hot (4), Land (11), Dispersion (12), Endangered (22), Extinction (23) and Sanitation (43). These vulnerability issues are consistent with those identified for the MDV, and it can be reasonably concluded that these issues seriously affect oases conditions. They are areas of high complexity to moderate vulnerability for MDV. It should be noted that most of these issues are in some way related to human activities. These anthropogenic activities pose a particular hazard to this area. Problems related to land degradation, water resources, loss of natural vegetation, can be attributed to the high population growth and unregulated and indiscriminate land development. MDV is presently highly vulnerable to incidental damage from human activities, pollution (score 4 for Sanitation (39) and 7 for treatment (43) indicators), and resource depletion as a result of the population growth, which places considerable stress on natural ecosystems. The population growths require more housing and infrastructure, which has led to considerable development of the MDV. As a result, it is relatively vulnerable to the effects of the loss of vegetation. The processes within the natural ecosystem, including soil formation, groundwater regeneration, and pollution attenuation, are therefore also at risk from the ongoing land development on the oasis. These anthropogenic activities create a particular hazard on such valley. With regard to the indicators that scored in between the range, 2 and 3, on the EVI scale, such as the Dry (2), Cold (5), Borders (16), Migratory (19), Introductions (21), Fertilizers (31), Pesticides (32) and Agreements (49), it can be concluded that the vulnerability of the Middle Draa Valley to problems in these areas would be greatly decreased with the careful management of natural resources and the monitoring of human activities. These factors all make the MDV more vulnerable than others agro-ecosystems, which also exhibit more resilience to hazards because of their greater land mass, stronger economies, and more effective management and mitigation systems. This study has shown that MDV is most vulnerable to hazards from anthropogenic sources, moderately vulnerable to hazards from biological and meteorological sources, and least vulnerable to hazards from geological sources. However, integrated and comprehensive management of the resources of MDV is necessary to sustainably use the available resources and to ensure that these resources are protected, in particular from uncontrolled anthropogenic events, which seem to have the most adverse affect on the natural ecosystems. Restoration and the establishment of protected areas would alleviate the problem of the loss of natural vegetation. Management of water is critically important and requires a cooperative management approach that involves every one. To this end, a sewage system instead of the traditional system (septic tanks) is vital for the management of the water resources. To synthesize on future climate, the temperatures are likely to rise while precipitation is likely to decrease. Both the risk and the duration of droughts are likely to increase in this region. Water scarcity and the dependency on rain-fed agriculture contribute to the sensitivity of the region. The sensitivity is increased by population growth which is strongest. Climate change exposure, pronounced sensitivity and limited adaptation capacities make MDV vulnerable to climate change. Concerns that the vulnerability to drought could contribute to social instability are reasonable. Climate change is likely to cause a decrease in agricultural production downstream, then upstream. Future droughts, additionally, have the potential to increase social inequality. This event will be strongly aggravated by soil degradation, mainly due to salinization. Some recent developments like watermelon growing are likely to increase the vulnerability of the agricultural sector and water resource to climate change. Adapting to climate change in this region is primarily a social consciousness followed by a political will and a mobilization of all actors to intervene on several levels: the fight against desertification, the control of overgrazing and the sewage treatment without forgetting the preservation of natural resources based on an ecological tourism. The agricultural strategy of Morocco "Plan Maroc Vert" aims the maximization for industrial agriculture and the fight against poverty for small-scale agriculture. A rationalization of irrigation practices and improving soil conditions will be crucial to secure future productivity. Area based rainfall insurances as well as a future improvement of seasonal weather predictions is further options to reduce vulnerability. Replacement of firewood by electric energy supply is able to compensate the impacts of climate change. Pushing forward the development of solar power plants, as envisioned by the government in the Solar Energy Complex Ouarzazate, that is near the Mansour Eddahbi Dam by 4 km,"with a capacity of 500 MW, is the first phase of the Moroccan Solar Plan to be implemented by MASEN, scheduled for 2015 [30] is therefore promising because it combines a stimulus for the domestic economy with the adaptation to climate change. In the past, people have developed sophisticated livelihood systems, such as those based on locally adapted crop and livestock rotation, drought-tolerant crop species as well as irrigation practices, in order to adapt to the inherently low land productivity and insecure water availability [31].
Spatial analysis of environmental vulnerability in MDV
In the MDV (15000 km2), the oases occupy about 26,000 ha (2% of total area) in six palm groves and is characterized by a vegetation management in stratum dominated by the date palm that promotes micro-hot and humid climate conducive to diversified agricultural production. Climate change alters the hydrological regime of Oued (river) Draa and influence agricultural production, from upstream to downstream of the MDV. Also the agricultural sector faces a lot of challenges such as Bayoud disease, soil salinization, silting and drought. In addition to these phenomena, we note the introduction of new crops that require more water in this dryland region like watermelons, as noted in Figure 8. We attempted to identify areas of weakness in the oasis ecosystem in the MDV along the valley upstream to downstream and emphasize the role of human activities in terms of accelerating vulnerability. This study sheds light on the changes that occurred in forested landscape and other major land uses both temporarily and spatially. It also shows the relationship of land use change to that of environmental vulnerability during the past 30 years in a sub-watershed like the MDV. These findings provide quantitative and qualitative basis and support for forest policy, management issues and institutional analyses in planning and management of watersheds.
Conclusion
Data collection process took place in government ministries, state agencies, and others environmental organizations, and the relevant data were obtained from available documents or interviews with wellinformed experts. These data were then used to calculate the values of the environmental indicators as directed by SOPAC, and the overall EVI for Draa valley is determined by the sum of the calculated values of all these indicators. The results of the research reveal that most indicators received a score of 4 or less, selected indicators received scores of 6 and 7, which indicated a high vulnerability for these indicators. It turned out that the indicators with the highest scores were mostly anthropogenic in essence or could be traced to some human-caused impact. It was concluded that the MDV vulnerability could to a large extent be controlled by vigilant management of this region's resources, coupled with information sharing between the agencies governing these resources. The MDV oases are classified by UNESCO (2000) as a biosphere reserve. Indeed it plays an important socio-economic and ecological role as a natural barrier against the progress of the desert. Today it is in degradation due to the scarcity of water resources along with the siltation exacerbated by the power of the winds. The challenges posed by climate change increase the importance of MDV adaptation. Reduced vulnerability and adaptation to climate change cannot be achieved by one sector alone, but all sectors that depend directly or indirectly on services provided from this environment. The agricultural sector has a great pressure on environmental resources in general and water resources (water availability is a vital factor in oases) and soil especially a mismanagement of soil quality, rangeland vegetation, and excessive exploitation of groundwater. These are different kinds of pressures that led to the adoption of unsustainable land management in the MDV. Among these are year-long sowing, watermelon culture, and overgrazing. The impacts of these practices include the loss of land and other natural resources. Reduction of the oasis ecosystem services includes the loss of biodiversity and reduced agricultural productivity that result in poor harvest and food shortages. Together, these effects cause a deterioration of living conditions and purchasing power especially in the rural population. Today, climate change increases these problems. In order to take advantage of the technological innovations such as localized irrigation, solar and wind energy. It is necessary to have strong monitoring mechanisms to ensure a sustainable development.
Acknowledgements
We thank the anonymous reviewers for their insight and critical review of the manuscript.
References
- Morocco (2010) Resilient Drylands and Oases Committed Territories. Resilient Drylands and Oases, committed territories Cancunmesse. Mexico.
- Environmental Vulnerability Index-EVI (2003) The Demonstration Environmental Vulnerability Index (EVI). South Pacific Applied Geoscience Commission, SOPAC- Technical Report 356.
- IPCC (2007) Climate Change 2007: Impacts, adaptation and vulnerability. Contribution of Working Group II to the Fourth Assessment Report of the Intergovernmental Panel on Climate Change. Cambridge University Press, Cambridge, UK.
- Safriel UN, Adeel Z, Niemeijer D, Puigdefabres J, White R, et al. (2005). Dryland systems. Ecosystems and human well-being: Current state and trends: Findings of the Condition and Trends Working Group. Island Press, Washington, USA.
- UNEP (2001) United Nations Environmental Programme-2001. Report On Environmental and Sustainability Indicators for Latin America and the Caribbean. Sixth Meeting of the Inter Sessional Committee-Forum of Ministers of the Environment of Latin America and the Caribbean, UNEP, Nairobi, Kenya.
- Morocco (2011) Assessment of vulnerability and impacts of climate change in the oases of Morocco and structuring local adaptation strategies. Mission 1.1: Diagnostic assessment of climate vulnerability and adaptive capacity in current situation (Bassinoasien de Dadès-Draa Mai), France.
- Chelleri L, Minucci G, Ruiz A, Karmaoui A(2014) Responses to Drought and Desertification in the Moroccan Drâa Valley Region. Resilience at the Expense of Sustainability?Int J Clim Change Impacts Resp 5:1835-7156.
- Larbl SH(1988) Les zones phcenicicolesMarocaines. Communication présentée au Séminairesur “Les systèmesagricolesoasiensTozeur, Tunisie.
- Christina R (2008) Work Destinations of OuledYaoubLabour Migrants.Atlas Impetus, Morocco.
- Mohammad AR (2008) Agricultural production and income security under increasing water uncertainty in Draa valley. International conferences in Ouagadougou. Burkina Faso, West Africa.
- Anna K (2009) Soil characteristics and soil erosion by water in a semi-arid catchment (WadiDrâa, South Morocco) under the pressure of global change. AngefertigtmitGenehmigung der Mathematisch-NaturwissenschaftlichenFakultät der Rheinischen Friedrich-Wilhelms-Universität Bonn.
- Piqué A (200) Geology of Northwest Africa.Berlin: GebruederBornträger, Berlin, Germany.
- Claudia H (2009) Economic analysis of water use and management in the Middle Drâa valley in Morocco vorgelegt, Morocco.
- Martin-Igul S (2006) Influence du tourismesur lagestion de l'eauen zone aride. Exemple de la vallée du Draa (Maroc). Université de Lausanne– Institut de Géographie (IGUL), Switzerland.
- Ouhajou L (1996) EspaceHydrauliqueetSociété au Maroc. Cas des Systèmesd’Irrigationdans la Vallée du Dra (Doctoral thesis). Agadir: UniversitéIbnZohr, Morocco.
- Schulz O, Judex M (2008) IMPETUS Atlas Morocco. Research Results 2000-2007 (3rdedn ). Department of Geography, University of Bonn, Germany.
- Born K, PiechaK, Fink A (2008) Regional Patterns of Rainfall and Temperature in the Drâa Region. Impetus Atlas Morocco, Morocco.
- Babqiqi A(2008)Personal communication: slide presented at the WB/MAPM, FAO, INRA, DMN workshop in Rabat, Morocco.
- Morocco (2011) Synthèse de l'étude "Evaluation du changementclimatiquefutur au niveau des zones oasiennesmarocaines" en partenariat avec la direction météorologiquenationale, Morocco.
- Diekkruger B (2010) Impact of global change on hydrology and soil degradation-scenario analysis for semi-arid Draa catchment (south Morocco). Global water system project, International Project Office. Conference of global catchment initiative (GCI). University club Bonn, Germany.
- HCEFLCD (2007) Etude d’aménagement du parc national d’Iriqui. Rapport de synthèse. HCEFLCD-DREF SO.
- Katharina G (2010) Drinking water supply in the Middle Draa Valley, South Morocco. Options for action in the context of water scaricity and institutional constraints, Universitätzu Köln, Germany.
- Roth A (2008) Agricultural Structure in OuledYaoub. IMPETUS Atlas Morocco. Research Results 2000-2007 (3rdedn). Department of Geography, University of Bonn, Germany.
- Claudia H (2008) Drought Effects on Livestock Husbandry): IMPETUS Atlas Morocco. Research Results 2000-2007 (3rdedn). Department of Geography, University of Bonn, Germany.
- Zainabi A (2001) La Vallée du Dra :Developementalternatif et action communautaire. Background paper WDR 2003.
- CMV (2005) Distribution de l’eaudans le DraaMoyen. Office régional de mise en valeurAgricole de Ouarzazate, Morocco.
- Ormvao (2013) Office Régional de Mise en ValeurAgricoled’Ouarzazate, ORMVAO, Maroc.
- Wang XD (2008) Regional assessment of environmental vulnerability in the Tibetan Plateau: Development and application of a new method. J Arid Environ 72: 1929-1939.
- Masen(2012) (Moroccan Agency ForSolar Energy) Projetcentralesolaired’ouarzazate. Étuded’impactenvironnementalet social (EIES), Morocco.
- Peterson GA, Unger PW, Payne WA (2006) Dryland agriculture (2nd edn.). ASA-CSSA-SSSA, Madison, WI, USA.
Citation: Karmaoui A, Messouli M, Yacoubi Khebiza MIfaadassan I (2014) Environmental Vulnerability to Climate Change and Anthropogenic Impacts in Dryland, (Pilot Study: Middle Draa Valley, South Morocco). J Earth Sci Clim Change S11: 002.
Copyright: © 2014 Karmaoui A, et al. This is an open-access article distributed under the terms of the Creative Commons Attribution License, which permits unrestricted use, distribution, and reproduction in any medium, provided the original author and source are credited.
Select your language of interest to view the total content in your interested language
Share This Article
Recommended Journals
Open Access Journals
Article Usage
- Total views: 19293
- [From(publication date): 0-2014 - Aug 17, 2025]
- Breakdown by view type
- HTML page views: 14481
- PDF downloads: 4812