Evaluation of Anthropogenic Carbon Dioxide (CO2) Concentrations along River Nworie, Imo State, Nigeria
Received: 27-Aug-2018 / Accepted Date: 21-Sep-2018 / Published Date: 28-Sep-2018 DOI: 10.4172/2573-458X.1000159
Keywords: Climate change; Greenhouse gases; Pollution; Relative humidity; Temperature; Wetlands
Introduction
The worldwide concern with global climate has highlighted the challenges faced by both industrialized and developing countries on the issue of increasing greenhouse gas emissions. These gases are chlorofluorocarbons (CFC), carbon dioxide (CO2), methane (CH4), and nitrogen oxides (NOx) which absorbs the radiation in the earth atmospheric system. Excess of these gases often affect the environment causing global warming [1]. While the greenhouse effect has been beneficial to maintain global temperatures compatible to human life, recent increases in average temperatures due to human activities are causing great alarm.
Of all greenhouse gases responsible for global warming, CO2 is of major concern. Atmospheric CO2 is produced naturally from volcanic out gassing, the combination of organic matter and the respiration processes of living anaerobic organisms [2] and artificially from combustion of various fossil fuels and deforestation etc. The artificial sources of CO2 emissions are generally thought to be responsible for global warming causing increase in atmospheric CO2 by about 43 % since the beginning of the age of industrialization. In 2016, the Earth's atmosphere CO2 concentration is averagely 402 parts per million (by volume) which continues to increase [3].
The concentrations of carbon dioxide in the atmosphere as well as climatic parameters such as temperature and relative humidity fluctuate slightly with the seasons and on regional basis. This is evident in some studies conducted from different areas of the world [4-11], in sub-Saharan West Africa [12-15] and Nigeria has been reviewed [16-18]. The predictions of global future climate change rely mostly on the ability to quantify fluxes of greenhouse gases, especially CO2, at regional scales. However, micronutrients along river banks are equally influenced by greenhouse gases and so the current project is important.
The aim of the study is to determine the dry season variation of atmospheric carbon dioxide along River Nworie, Owerri Municipal, Imo state, Nigeria. Since oceans with land sequesters about half of the anthropogenic emissions of atmospheric CO2 [16-19]. Wetlands along many rivers have not been characterized for greenhouse gases emissions or absorption; hence the current research contributes to information on this subject. Also, measurements over the wetland are very helpful for understanding emissions growth as well as verifying the mitigation policies.
Materials and Methods
Study area
Nworie River is a first order stream that runs about 5 km course across Owerri metropolis in Imo State before emptying into Otamiri River. It is about 9.2 km long. Imo state is situated in the southern rain forest vegetation belt of Nigeria, it has between latitude 5 o and longitude 7o 34oE. It has an annual rainfall of about 1700-2500 mm. The climate of the study area follows a tropical pattern with the rainy season lasting between seven and eight months between April and October with interruption in August and dry season running through November to March. Average humidity of 80%-85% occurs during the rainy season. Temperature is similar all over the state, with maximum values ranging from 280oC to 350oC and minimum values from 190oC to 240oC.
Control point
The control is a land area that is saturated with water from the rainy season. The area experiences no anthropogenic disturbance and located around Bishop’s Court, Owerri which is more than 7 km away from river Nworie. Geographically, it is located at Latitude-N 5o 29.3623’, Longitude-E 7o 1.4622’ and area is filled with grassland Figure 1a and 1b.

Figure 1a: Map showing sampling points along Nworie River.

Figure 1b: Photographs each sampling point along the longitudinal course of Nworie River.
Atmospheric CO2 measurement
AZ 77535 CO2 gas analyzer (AZ Technologies, Taiwan) was the instrument used to determine the CO2 on the surface/air above the water. The instrument is designed with NDIR (Non-Dispersive Infrared) waveguide technology sensor. The instrument carried out automatic analysis of the sample of ambient air with the use of the physical properties that gives continuous output signal to the analyzer which returns the values of the CO2, temperature and relative humidity, which were read from the screen. The instrument which was held at arm length and about 10 cm above the water was used to obtain the concentration of CO2 in the air. Sampling was carried at the hours of morning, afternoon and evening at six different points and the control point for seven weeks with mean reported for each week. These hours were chosen based on the fact that they are meteorological hours recommended for weather observation by world meteorological organization.
The data were collected in year 2016 dry season from November to December.
Method of data analysis
Data analysis was done using Microsoft excel 2007 and values of all the results from the sampling points was recorded as calculated mean values of ambient temperature, relative humidity and air CO2 concentrations for morning, afternoon and evening hours. The standard deviation (SD) was determined and co-efficient of variation (CV %) was used to determine variation in the concentration of CO2 between samplings points using equation 1.
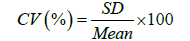 (1)
(1)
Variation was categorized as little variation (CV% <20), moderate variation (CV%=20-50) and high variation (CV% >50) [20-22].
Anthropogenicity was estimated according to [23] given in equation 2. It is the ratio actual carbon dioxide concentration to reference concentrations expressed in percentage. This estimates the impact of human activities on ambient concentration of carbon dioxide along river Nworie.
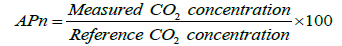 (2)
(2)
The control data were used as the reference concentrations.
Results and Discussion
The results for variability and basic descriptive statistical summary for temperature, relative humidity and ambient CO2 concentration obtained at various points of the river for seven weeks during November and December 2016 is presented in Table 1. The weekly variations of meteorological parameters: (a) relative humidity (%) and (b) temperature (°C) along river Nworie during 2016 dry season (November and December) are shown in Figures 2 and 3. Mean reported for data collected daily in morning, afternoon and evening hours.

Figure 2: Trends for ambient CO2 concentrations recorded during the study.

Figure 3: Trends for RH recorded during the study.
| Weeks | PARAMETERS | Aŧ | Bŧ | Cŧ | Dŧ | Eŧ | Fŧ | Min | Max | Mean | SD | CV (%) | Control |
|---|---|---|---|---|---|---|---|---|---|---|---|---|---|
| 1 | CO2 | 549 | 550 | 556 | 563 | 567 | 572 | 550 | 572 | 559.5 | 9.35 | 1.7 | 480 |
| Temp (oC) | 33.2 | 33.4 | 31.9 | 32.3 | 33.6 | 33.8 | 31.9 | 33.8 | 33.03 | 0.76 | 2.3 | 29 | |
| RH (%) | 61.4 | 62 | 60.2 | 69.6 | 67 | 67.8 | 60.2 | 67.8 | 64.67 | 3.93 | 6.1 | 60.4 | |
| 2 | CO2 | 565 | 577 | 560 | 547 | 556 | 573 | 547 | 577 | 563 | 11.08 | 1.9 | 462 |
| Temp (oC) | 33.1 | 33.5 | 33.1 | 30.6 | 31.2 | 37.6 | 30.6 | 37.6 | 33.18 | 2.46 | 7.4 | 28 | |
| RH (%) | 67.6 | 66.1 | 69.8 | 71.8 | 67.2 | 63.4 | 63.4 | 71.8 | 67.65 | 2.92 | 4.3 | 74 | |
| 3 | CO2 | 545 | 544 | 563 | 554 | 545 | 549 | 544 | 563 | 500 | 7.38 | 1.5 | 490 |
| Temp (oC) | 35 | 35 | 35.7 | 34.6 | 35.7 | 35.7 | 34.6 | 35.5 | 38.28 | 0.48 | 1.3 | 29 | |
| RH (%) | 55.3 | 56.1 | 57.9 | 54.2 | 53.6 | 58.3 | 53.6 | 57.9 | 55.9 | 1.92 | 3.4 | 61 | |
| 4 | CO2 | 560 | 564 | 536 | 574 | 575 | 574 | 536 | 575 | 563.83 | 14.97 | 2.7 | 458 |
| Temp (oC) | 35.2 | 35 | 34.7 | 34.6 | 35.1 | 35.2 | 34.6 | 35.2 | 34.97 | 0.25 | 0.7 | 29 | |
| RH(%) | 55.3 | 56.1 | 56.4 | 54.6 | 57.6 | 57.1 | 55.3 | 57.1 | 56.18 | 1.11 | 1.9 | 60 | |
| 5 | CO2 | 579 | 570 | 576 | 572 | 576 | 568 | 568 | 579 | 573.5 | 4.18 | 0.7 | 455 |
| Temp (oC) | 32.9 | 32.9 | 33.1 | 33.5 | 33.7 | 33.2 | 32.9 | 33.7 | 33.22 | 0.33 | 0.9 | 30 | |
| RH(%) | 64.3 | 64.1 | 65.1 | 64.9 | 65 | 65.3 | 64.1 | 65.3 | 64.78 | 0.48 | 0.7 | 66.3 | |
| 6 | CO2 | 576 | 575 | 573 | 571 | 579 | 576 | 571 | 579 | 575 | 2.76 | 0.5 | 460 |
| Temp (oC) | 35.5 | 30.7 | 33.8 | 30.7 | 38.2 | 38.9 | 30.7 | 38.9 | 34.63 | 3.56 | 10.3 | 28 | |
| RH(%) | 68.5 | 68 | 62.2 | 64 | 60.3 | 67.3 | 60.3 | 68.5 | 65.05 | 3.39 | 5.2 | 71.3 | |
| 7 | CO2 | 565 | 574 | 509 | 542 | 561 | 573 | 509 | 574 | 554 | 24.9 | 4.5 | 490 |
| Temp (oC) | 35.2 | 39.9 | 38.1 | 39.1 | 38.8 | 39 | 35.2 | 39.9 | 38.35 | 1.65 | 4.3 | 30 | |
| RH(%) | 69.9 | 66.9 | 69.9 | 67.4 | 69.9 | 69.9 | 66.9 | 67.4 | 68.98 | 1.43 | 2.1 | 73.9 | |
| Control mean ± SD | CO2 (ppm) | 470.71 ± 15.43 | |||||||||||
| Temp (oC) | 29 ± 0.82 | ||||||||||||
| RH(%) | 66.70 ± 6.37 | ||||||||||||
Table 1: The result for the CO2 concentration in air, temperature and relative humidity along river Nworie for dry season of 2016.
The trend for CO2 concentrations for the sampling points and control is presented in Figure 2. The concentration of atmospheric CO2 ranged from 550 ppm to 572 ppm in week one, from 547 ppm to 572 ppm in week two, from 544 ppm to 563 ppm in week three, from 536 ppm to 575 in week four, from 568 ppm to 579 ppm in week six while week seven showed ranges of 509 ppm to 574 ppm respectively. Higher concentrations were recorded in the present study when compared with concentration of 402 ppm recorded in early 2016 for average global concentration of CO2. The obtained concentrations at river Nworie was generally higher than the control with range of 480 ppm (week one) to 490 ppm (week seven) and mean of 470.71 ± 15.43 ppm. The present study also showed higher concentrations when compared to annual average atmospheric CO2 concentrations observed in Ahmedabad in western India (413.0 ± 13.7 ppm) in 2015 [24]. The high CO2 is due mainly to anthropogenic activities carried out along the river such as the use of potable water, generation of wastewater, the generation of solid waste and vehicle exhaust [25,26]. The cycles of CO2 is mostly governed by the strength of emission sources, sinks and transport patterns. NASA [27] reported that human-made carbon dioxide (CO2) continues to increase above levels not seen before and is not absorbed by vegetation and the oceans. The increase in atmospheric concentration of CO2, and thus in the CO2 induced greenhouse effect, is the reason for the rise in average global temperature causing global warming [8,27].
The variability of CO2 along the river show little variations as all coefficients of variations are less than 20% (Table 1). However, the highest variability was recorded in the seventh week of the study (4.5%) while in week six the lowest was recorded (0.5). The reason for the little variations could be due to the sampling points falling in the same geographical location.
The trends of temperature from week one to seven is introduced in Figure 4. In week one temperature ranged from 31.9oC at point C to 33.8 at point F. During week two, the temperatures at the sampling point dropped (as low as 30.5oC) except for point B and F with slight and heavy increase in temperature respectively. From week three, there was temperature rise and drop from the week four to five. In the sixth, the highest temperature was recorded at point F while B and D recorded lowest. There was a significant increase at point B and D, temperature rising from 30.7oC to 39.9oC respectively. There were also temperature rise at points C, E, and F while reducing temperature was observed at point A. Throughout the study, all points showed higher temperature when compared to control where we recorded a range of 28 to 30oC and mean of 29 ± 0.82oC.

Figure 4: Trends for ambient temperature recorded during the study.
Though temperatures were high, it showed little variability like all other parameters revealed little variability (<20%, Table 1). High temperature in urban areas such as Lagos (33oC), Warri (32.1oC), Benin (31.3oC), Portharcourt (30.3oC), Calabar (31.5oC), Abuja (33.8oC), Lokoja (33.3oC), Ilorin (33.4oC), Jos (31.8oC), Kano (39.8oC), Maiduguru (39.8oC) and Sokoto (39.7oC) respectively in Nigeria has been reported [28]. This rise in temperature implies that there is rise in CO2. Soon [29] using climate modeling asserted that increase in atmospheric CO2 increases with increasing atmospheric temperature. This is evident in the current study where high temperatures along river Nworie showed high CO2 concentrations as opposed to the observation at the control where low temperature followed low CO2 concentrations.
Generally, from week one to week seven low humidity was recorded in all points, except for week two where a maximum RH of 71.8% was recorded Figure 4. However, the control showed high humidity when compared with observations made at river Nworie except in week one. The range of RH was 60 to 73.9% with mean of 66.70 ± 6.37%. The low humidity could be due to the season of study. There is generally high temperature during dry season and thus little amount water vapors in the environment. Relative humidity gives amount of water vapour in the environment and depends on the temperature. Therefore, the high humidity recorded at the control points is due to the low temperature observed in that area.
Relationship between climatic parameters and CO2 concentration during the study
In order to establish a relationship between ambient CO2 concentrations and climatic parameters measured, we conducted a linear, exponential and power regression analysis. Table 2 shows the summary of the relationships showing equations and regression coefficients. A good correlation equation between temperature and CO2 as well as RH and CO2 was shown in Table 2. Regression analysis revealed that increasing temperatures could lead to increasing CO2 concentration while CO2 concentrations increased for decreasing relative humidity. Since, all R2 values (regression coefficient) are positive. Regression coefficient is adjudged on the scale of -1, 0, +1. Positive relationship suggests the dependent variable and independent variable have direct relationship and vice versa for negative relationships while zero suggests no relationship.
| Weeks | Linear Relationship | Exponential Relationship | Power Relationship | |||
|---|---|---|---|---|---|---|
| Equation | R2-Value | Equation | R2-Value | Equation | R2-Value | |
| Relationship between temperature Vs. CO2 concentration during the study | ||||||
| 1 | 0.022x+20.24 | 0.079 | 22.49e0.000x | 0.076 | 3.017x0.378 | 0.074 |
| 2 | 0.169x-62.08 | 0.581 | 1.906e0.005x | 0.605 | 5E-07x2.854 | 0.607 |
| 3 | 0.012x+28.61 | 0.034 | 29.25e0.000x | 0.034 | 10.85x0.186 | 0.033 |
| 4 | 0.005x+31.61 | 0.119 | 31.76e0.000x | 0.118 | 10.85x0.186 | 0.033 |
| 5 | -0.000x+33.54 | 5.00E-05 | 33.61e-2E-0x | 8.00E-05 | 35.40x-0.01 | 6.00E-05 |
| 6 | 0.968x-522.2 | 0.562 | 4E-06e0.028x | 0.559 | 1E-43x16.09 | 0.559 |
| 7 | 0.004x+35.83 | 0.004 | 36.23e0.000x | 0.003 | 27.45x0.052 | 0.003 |
| Relationship between relative humidity Vs. CO2 concentration during the study | ||||||
| 1 | 0.341x-126.1 | 0.657 | 3.367e0.005x | 0.66 | 5E-07x2.956 | 0.66 |
| 2 | -0.218x+190.5 | 0.687 | 413.2e-0.00x | 0.681 | 6E+06x-1.81 | 0.683 |
| 3 | 0.110x-4.964 | 0.181 | 18.97e0.002x | 0.179 | 0.059x1.084 | 0.178 |
| 4 | 0.005x+52.97 | 0.005 | 53.27e9E-05x | 0.005 | 41.09x0.049 | 0.004 |
| 5 | -0.022x+77.56 | 0.038 | 78.82e-3E-0x | 0.037 | 224.6x-0.19 | 0.037 |
| 6 | -0.089x+116.5 | 0.005 | 168.3e-0.00x | 0.007 | 24221x-0.93 | 0.007 |
| 7 | -0.009x+74.34 | 0.028 | 74.61e-1E-0x | 0.028 | 113x-0.07 | 0.029 |
Table 2: Relationship between climatic parameters and CO2 concentration during the study.
All relationships showed positive slope during the study except in week 5 for temperature-CO2 relationship. Meanwhile, negative slope were obtained in week 2, 5, 6 and 7 for relative humidity-CO2 relationship. The relationship equations showed that the plots didn’t follow the origin (0) and thus having high intercept. This observation follows the regression coefficient obtained suggesting that the relationship isn’t perfect (<1). Positive relationship was also reported for CO2 emissions from the lower Red River in Vietnam [30].
To determine which relationship is more pronounced with CO2 concentration, we created a trend plot which compared the different relationships. The trend results are presented in Figure 5. Looking at Figure 5a critically, it could be observed that the relationship between CO2 and temperature is better described by an exponential equation especially in the fourth week. Although a power and linear relationships followed closely. However, with relative humidity the trend follows similar pattern (Figure 5b). There was high relationship was recorded in week 1 and 2 of the study which drops with weeks.

Figure 5: Comparing the different relationships for CO2 and other climatic parameters.
Anthropogenicity (Human Impact Estimation)
We estimated the impact of human activities on the high concentration of carbon dioxide along river Nworie using anthropogenic model as described in equation 2. When discussing climate change, it is often used to refer to emissions produced as a result of human activities. We estimate the impact based on data obtained from the control point. The computed anthropogenicity is presented in Table 3.
| Weeks | Anthropogencity (%) | |||||
|---|---|---|---|---|---|---|
| A | B | C | D | E | F | |
| 1 | 114.38 | 114.58 | 117.29 | 117.29 | 118.13 | 119.17 |
| 2 | 122.29 | 124.89 | 121.21 | 118.4 | 120.35 | 124.03 |
| 3 | 111.22 | 111.02 | 114.9 | 113.06 | 111.22 | 112.04 |
| 4 | 122.27 | 123.14 | 117.03 | 125.33 | 125.44 | 125.33 |
| 5 | 127.25 | 125.27 | 126.59 | 125.71 | 126.59 | 124.84 |
| 6 | 125.22 | 125 | 124.57 | 124.13 | 125.87 | 125.22 |
| 7 | 115.31 | 117.14 | 103.88 | 110.61 | 114.49 | 116.94 |
Table 3: Computed Anthropogenicity for CO2 concentrations for different sampling points throughout the study period.
Generally, high anthropogenic impact estimate were obtained throughout the study period which ranged from 103.88% to 127.25%. The high estimate obtained suggested that the many activities experienced along the river is causing high temperature and thus high CO2 concentrations. Activities experienced along this area include waste dumpsite which contains organic matter and in the presence of warmer temperature and moisture decomposes and oxidizes, releasing CO2 in the atmosphere. Other activities include emission for automobile exhaust, automobile workshop, building constructions, road construction, destroyed vegetation mostly grasses and polluted water, sand mining and dredging on both sides of the Nworie River. The drainage and destruction can result in substantial carbon emission [31-33].
The week-wise trend for anthropogneicity is introduced in Figure 6. Week-wise impact showed that the highest human impact on CO2 concentration was observed in the fifth week (126.04%) while the least in week one (100.26%). The week-wise impact follows the trend; week 5>week 6>week 4>week 2>week 7>week 1 respectively. Meanwhile, site-wise trend is introduced in Figure 7. The highest estimated value was obtained at point F (121.08%) and least recorded at point C (117.92%). The site-wise impact follows the trend; point F>point E>point B>point A>point D>point C respectively.

Figure 6: Week-wise trend for anthropogneicity.

Figure 7: Site-wise trend for anthropogneicity.
Conclusion
With the rising global warming, awareness results from this work confirm elevated CO2 concentrations over 44% above early 2016 average global CO2 concentration. The concentrations according to sampling points varied with low % variability but it was observed that temperature had more linear and exponential relationships with CO2 concentrations. Relative humidity exhibited similar trend for linear, exponential and power relationships with CO2 concentrations. The various human activities have contributed to rising CO2 concentrations along river Nworie which is confirmed by the high annthropohenicity (103.88% to 127.25%) recorded with respect to the control point. However, a bigger study with more study sites is required over multiple years to elucidate more accurate distributions of emissions and their source regions for tracking the changes associated with anthropogenic activities and emission mitigation policies.
References
- Akpojotor GE, Akporhonor T (2005) Global warming: Methods to sequester the increasing emitted CO2 in Nigeria. Proceedings of the International Conference on Science and Technology, Nigeria, pp: 460-463.
- Akpojotor GE, Ofomola MO (2009) Database of CO2 emission in Nigeria. Proceedings of the Second International Seminar on Theoretical Physics and National Development, Nigeria, pp: 268-279.
- https://www.nasa.gov/feature/goddard/2016/carbon-dioxide-fertilization-greening-earth
- Lin X, Indira NK, Ramonet M, Delmotte M, Ciais P, et al. (2015) Long-lived atmospheric trace gases measurements in flask samples from three stations in India. Atmos Chem Phys 15: 9819-9849.
- Newman S, Jeong S, Fischer ML, Xu X, Haman CL, et al. (2013) Diurnal tracking of anthropogenic CO2 emissions in the Los Angeles basin megacity during spring 2010. Atmos Chem Phys 13: 4359-4372.
- Turnbull JC, Miller JB, Lehman SJ, Tans PP, Sparks RJ, et al. (2006) Comparison of CO2, CO, and SF6 as tracers for recently added fossil fuel CO2 in the atmosphere and implications for biological CO2 exchange. Geophys Res Lett 33: L01817.
- Wang Y, Munger JW, Xu S, Mc Elroy MB, Hao J, et al. (2010) CO2 and its correlation with CO at a rural site near Beijing: Implications for combustion efficiency in China. Atmos Chem Phys 10: 8881-8897.
- Sharma N, Dadhwal V, Kant Y, Mahesh P, Mallikarjun K, et al. (2014) Atmospheric CO2 variations in two contrasting environmental sites over India. Air Soil Water Res 7: 61-68.
- Wong KW, Fu D, Pongetti TJ, Newman S, Kort EA, et al. (2015) Mapping CH4: CO2 ratios in Los Angeles with CLARS-FTS from Mount Wilson, California. Atmos Chem Phys 15: 241-252.
- Wunch D, Wennberg PO, Toon GC, Keppel AG, Yavin YG (2009) Emissions of greenhouse gases from a North American megacity. Geophys Res Lett 36: L15810.
- Tiwari YK, Vellore RK, Kumar KR, van der Schoot M, Cho CH (2014) Influence of monsoons on atmospheric CO2 spatial variability and ground-based monitoring over India. Sci Total Environ 490: 570-578.
- Mahesh P, Sharma N, Dadhwal V, Rao P, Apparao B, et al. (2014) Impact of land-sea breeze and rainfall on CO2 variations at a coastal station. J Earth Sci Clim Change 5: 201.
- Duru AJ (2008) The implications of variability in rainfall over imo state on the little dry season (1975-2007). Owerri: Imo State University.
- Ward MN, Lamb DH, Portis Sebarri R (1999) Climate variability in Northern Africa: Understanding droughts In: Sahel and the Maghreb. Beyond El Nino, pp: 119-140.
- Nicholson SE (1981) Rainfall and atmospheric circulation during periods of drought and wetter years in West Africa. Mthly Weather Rev 109: 2191-2208.
- Onyenechere EC (2010) Climate change and spatial planning concerns in Nigeria: Remedial measures for more effective response. J Hum Ecol 32: 137-148.
- Climate change in Nigeria: A communication guide for reporters and educators (2003) Nigerian Environmental Study Team (NEST).
- Nigeria climate change: Executive summary of five multisector surveys on Nigeria’s vulnerability and adaptation to climate change (2004) Nigerian Environmental Study Team (NEST).
- Le Quere C, Moriarty R, Andrew RM, Peters GP, Ciais P, et al. (2015) Global carbon budget 2014. Earth Syst Sci Data 7: 47-85.
- Verla AW, Enyoh CE, Okonkwo FC, Verla EN (2017) Radiation levels of dumpsites within Imo State University, Owerri, Imo State, Nigeria. World News of Natural Sciences 11: 45-64.
- Verla EN, Verla AW, Ugwulor L (2015) Seasonal variation of heavy metals in playgrounds of public schools within Owerri metropolis, Imo State, Nigeria. International Letters of Chemistry, Physics and Astronomy 50: 61-70.
- Enyoh CE, Verla AW, Egejuru NJ (2018) pH variations and chemometric assessment of borehole water in Orji, Owerri Imo state, Nigeria. J Environ Anal Chem 5: 1-9.
- Verla EN, Verla AW, Enyoh CE (2017) Pollution assessment models of soils in Portharcourt city, rivers state, Nigeria. World News of Natural Sciences 12: 1-23.
- Naveen C, Shyam L, Venkataramani S, Prabir KP, Varun S (2016) Temporal variations of atmospheric CO2 and CO at Ahmedabad in western India. Atmos Chem Phys 16: 6153-6173.
- Solid waste management and greenhouse gases: A life-cycle assessment of emissions and sinks (2006) National service center for environmental publications.
- Bjorkegren AB, Grimmond CSB, Kotthaus S, Malamud BD (2015) CO2 emission estimation in the urban environment: Measurement of the CO2 storage term. Atmos Environ 122: 775-790.
- Efe SI (2016) Evaluation of carbon dioxide emissions and temperature variation in Nigerian cities. J Geo Environ Earth Sci Inter 6: 1-9.
- Soon W, Baliuna S, Robison AB, Robinson ZW (1999) Environemental effects of increased atmospheric CO2. Climate Reseach 13: 149-164.
- Peter AR, Nina FC, Jonathan JC (1997) Carbon dioxide concentration and atmospheric Hudson river flux in the Hudson river. Estuaries 20: 381-390.
- Thi Phuong QL, Marchand C, Tu Ho C, Duong TT, Nguyen HTM, et al. (2018) CO2 partial pressure and CO2 emissions 1 from the lower Red River (Vietnam). Bio geosciences 15: 4799-4814.
- https://news.nationalgeographic.com/news/energy/2013/05/130510-earth-co2-milestone-400-ppm/
- Westerdahl D, Wang X, Pan X, Zhang KM (2008) Characterization of on-road vehicle emission factors and microenvironmental air quality in Beijing, China. Atmos Environ 43: 697-705.
- https://www.nasa.gov/press/goddard/2014/november/nasa-computer-model-provides-a-new-portrait-of-carbon-dioxide/
Citation: Wirnkor VA, Ebere EC, Ngozi VE (2018) Evaluation of Anthropogenic Carbon Dioxide (CO2) Concentrations along River Nworie, Imo State, Nigeria. Environ Pollut Climate Change 2: 159. DOI: 10.4172/2573-458X.1000159
Copyright: © 2018 Wirnkor VA, et al. This is an open-access article distributed under the terms of the Creative Commons Attribution License, which permits unrestricted use, distribution, and reproduction in any medium, provided the original author and source are credited.
Select your language of interest to view the total content in your interested language
Share This Article
Recommended Journals
Open Access Journals
Article Tools
Article Usage
- Total views: 7088
- [From(publication date): 0-2018 - Dec 08, 2025]
- Breakdown by view type
- HTML page views: 6130
- PDF downloads: 958