Evaluation of Pebble form Indices as Paleoenvironmental Signatures of the Maastrichtian - Danian Age Using Quartz Clasts in Owerre-Ezukala Area, Southeast of Nigeria
Received: 04-Nov-2018 / Accepted Date: 16-Jan-2019 / Published Date: 24-Jan-2019
Abstract
The Maastrichtian - Danian age is well exposed around the Owerre-Ezukala area in the Anambra Basin of southeastern Nigeria. Two geologic units were encountered in the study area; Maastrichtian Ajali Formation and Danian Nsukka Formation. Outcrop sections were located, measured and described in detail following standard field methods. Pebble beds were sampled to evaluate their form indices which served as signatures of the paleoenvironment of deposition. The research methodologies were standard methods used in pebble morphological analysis. A total of one hundred and thirty pebbles were collected from three localities (Olo, Owerre–Ezukala and Ubaha). The following parameters were evaluated; Flatness Index (FI), Oblate-Prolate Index (OPI), Pebble form and Maximum Projection Sphericity (MPS). The mean values of FI, OPI and MPS (44.7%, -0.066, and 0.789 respectively), are suggestive of a fluvially agitated shallow marine environment (estuarine). Bivariate scatter plots of FI versus MPS and MPS versus OPI suggest fluvio-estuarine environment. Plots made on sphericity-form diagram suggest a transitional setting (probably fluvial to estuarine). The sedimentary facies analysis supports a fluvio-estuarine setting for the Maastrichtian – Danian age.
Keywords: Maastrichtian-Danian age; Anambra basin; Ajali formation; Nsukka formation; Pebble morphological analysis
Introduction
The Anambra Basin is said to be of Campano-Maastrichtian age (Figure 1) [1-8]. The paleoenvironment of the Maastrichtian Ajali Formation has been considered to be a fluvial set-up [9-11], while the Danian Nsukka Formation has been assigned a deltaic environment of deposition [12,13]. The net paleoenvironmental situation during the Maastrichtian – Danian times within the Anambra Basin have been discussed by researchers and this piece of work is an added literature in evaluating the net paleoenvironmental settings within the Maastrichtian-Danian times in the basin. Geological field studies were carried out in Owerre-Ezukala, Nkwuli, Olo, Umuogele, and Isuochi areas of southeastern Nigeria. Lithologic sections were located and logged following the standard methods for geological field studies. The observed lithologies consist mainly of unconsolidated sands usually friable, at times pebbly intervals and ferruginized representing the Maastrichtian (Ajali Formation) and an alternating sequence of consolidated sands, silts, shale and occasionally pebbly representing the Danian (Nsukka Formation). Well-rounded and unbroken pebbles were picked from about three locations (Olo, Owerre-Ezukala and Nkwuli), for pebble morphological analysis. The study area lies between Longitudes 07° 151 E and 07° 271 E and Latitudes 06° 001 N and 06° 051 N (Figure 2) and covers a total surface area of 56 Km2. This paper reports the results of the study of pebbles from these locations as obtained from pebble form indices and is herein used to evaluate the paleoenvironment of deposition of the Maastrichtian – Danian age around the Owerre- Ezukala area in Anambra Basin of southeastern Nigeria.


Figure 2: Litho-stratigraphic framework for the early cretaceous-Paleocene period in the Benue trough (Modified after [6]).
Physiography and Drainage
The Nsukka-Okigwe cuesta is the major landform in the study area. The topographic character of the area is produced mainly by the differential weathering and erosion arising from differences in hardness, composition and permeability of the underlying rocks. The Ajali Formation forms a westward dip slope of the cuesta. The Nsukka Formation has undulating terrain characterized by a network of valleys and sharp-crested hills (Figure 3). River, springs and streams drain the study area. Major surface water includes Ngiridi stream, Isi-imo stream, Iyinwopia spring, Ogbu-okwa spring, and Mamu River. The volume of water changes with the seasons with rise and fall in water level during the rainy and dry seasons respectively. Most of the streams in the study area flow in a northeast, southeast, southwest direction. Numerous springs found in the area develop between the permeable sandstone and impermeable clay beds. The Mamu River is the major water body that define the drainage system; a dendritic pattern.

Figure 3: Topographic map of the study area. (Source: Modified from [15]).
Climate and Vegetation
The study area falls within the Humid Tropical Belt of the World. The wet season begins in April and lasts up to September while the dry season spans from October to March. The annual rainfall varies between 1500 mm and 2000 mm with the driest month recording less than 30 mm of rainfall. The temperature values average 27°C. The relative humidity is usually higher in the rainy season and lower in the dry season. The vegetation is an evergreen rainforest type. The heavy rainforest belt is characterized by growth of tall trees that have luxuriant foliage. Amidst tall trees are thick undergrowths that include climbers and epiphytes forming complex tangles that hinder movement. Oil palm trees dominate the landscape. Other species found are Iroko, Mahogany, Obeche and Oil bean. The soil is fertile for agriculture.
Geologic Setting
The study area falls within the Anambra Basin. The basin is a Cretaceous depocenter that received Campanian to Tertiary sediments [6,11]. The Anambra Basin results from the Santonian upliftment of the Abakaliki region, of the Benue Trough (Figure 4). The Anambra Basin is roughly triangular in shape, covering an area of about 40,000 Km2. The Eocene age was characterized by regressive phase that led to deposition of Ameki Group; Nanka Sands and Ameki Formation [14,15]. The Ameki Group is overlain by the Oligocene Ogwashi-Asaba Formation [16]. The Benin Formation (Miocene to Recent) progrades unto the surface of the Anambra Basin [17].

Figure 4: Tectonic framework of the Benue trough. Study area encircled [6].
Facies Analysis
In this study, five outcrops were located and logged systematically. Two geologic units were encountered (Figure 5). Unit I represent the Maastrichtian Ajali Formation while the Unit II represents the Danian Nsukka Formation.

Figure 5: Geologic map of the study area.
Geologic Unit I
The unit I have a high incidence of quartz and feldspar pebbles. It consist of cross bedded sandstone (Figure 6a), friable, white-yellow in color, small degree of ferruginization, fine – medium grained, occasionally coarse grained. A coarsening upward sequence is observed (Figure 6b). The cobbles are deposited on top of the pebbles, and the pebbles on top of fine-grained sandstone.

Figure 6a: Lithologic profile of outcrop at Umuogele in Ajali formation.

Figure 6b: Lithologic profile of outcrop at Olo in Ajali formation.
Geologic Unit II
This unit consists of alternating series of consolidated sandstones intercalated with siltstones. They occur sometimes as boulders. The sandstone is usually fine – medium grained occasionally coarse – pebbly at some places (Figure 6c). It is poorly sorted. The sandstone and siltstones are red - brown due to ferruginization. The unit also consist of silty shale and clays, which are pink - white (Figure 6d), occasionally dark in color (Figure 6e).

Figure 6c: Lithologic profile of outcrop at Owerre-Ezukala in Nsukka formation.

Figure 6d: Lithologic profile of outcrop at Isuochi in Nsukka formation.

Figure 6e: Lithologic profile of outcrop at Nkwuli in Nsukka formation.
Methodology Adopted
Pebbles were picked from the study area in large numbers and a total number of hundred and thirty (130) pebbles were selected. In selecting the pebbles, homogenous pebbles were picked avoiding broken pebbles with overgrowth. Standard sized pebbles were selected for measurements, following the grain size scale for pebbles (Table 1). The pebbles were measured with Vernier calipers to obtain the values of the long, intermediate and the short axis as suggested by Dobkins and Folk [18]. During sampling, all pebbles with distinct fresh breaks, obvious primary elongation or flatness, and those that show strong lithologic in homogeneities were discarded to assure true values of the desired parameters [19]. The pebbles were washed thoroughly before the analysis and labeled according to type-localities and mixed up afterwards. Pebble shape is the function of three mutually related properties: Form, Roundness, Surface texture. Pebble form describes the relationship between long (L), intermediate (I), and the short (S) axes of the pebble. The values of the long, intermediate and short axes were loaded into the excel spreadsheet. The following formulae were imputed and used in computing the form indices for the 130 pebbles (Tables 2-4).
| Variables | Mm | Phi | Class Term |
|---|---|---|---|
| Mean | 48 – 64 | > - 5.5 | Pebble |
| 32 – 48 | > - 5.0 | ||
| 24 – 32 | > - 4.5 | ||
| 16 – 24 | > - 4.0 | ||
| 12 – 16 | > - 3.5 | Granule | |
| 8 – 12 | > - 3.0 | ||
| 6 – 8 | > - 2.5 | ||
| 4 – 6 | > - 2.0 |
Mean of the morphometric indices were computed using some known statistical formulae as given; Mean = Σx ∕ n
Table 1: Grain size scales for pebbles (Modified from [20]).
| L | I | S | S/L | FI | L-I/L-S | OPI | MPS | Form |
|---|---|---|---|---|---|---|---|---|
| 3.61 | 2.97 | 0.98 | 0.271468 | 27.14681 | 0.243346 | -0.945 | 0.451 | P |
| 3.43 | 2.11 | 1.31 | 0.381924 | 38.19242 | 0.622642 | -0.321 | 0.622 | CB |
| 4.18 | 2.82 | 1.42 | 0.339713 | 33.97129 | 0.492754 | -0.021 | 0.558 | B |
| 4.37 | 3.16 | 1.51 | 0.345538 | 34.55378 | 0.423077 | -0.223 | 0.552 | B |
| 3.18 | 2.81 | 1.04 | 0.327044 | 32.7044 | 0.172897 | -1.00 | 0.498 | P |
| 3.91 | 1.81 | 1.11 | 0.283887 | 28.38875 | 0.75 | 0.88 | 0.562 | CE |
| 3.07 | 2.13 | 1.41 | 0.459283 | 45.92834 | 0.566265 | 0.144 | 0.675 | CB |
| 3.85 | 2.53 | 1.16 | 0.301299 | 30.12987 | 0.490706 | -0.0299 | 0.514 | B |
| 3.84 | 2.62 | 1.31 | 0.341146 | 34.11458 | 0.482213 | 0.053 | 0.558 | CB |
| 2.95 | 2.46 | 1.88 | 0.637288 | 63.72881 | 0.457944 | -0.066 | 0.789 | C |
| 3.35 | 2.84 | 0.78 | 0.232836 | 23.28358 | 0.198444 | -1.296 | 0.404 | VP |
| 3.68 | 1.96 | 1.11 | 0.30163 | 30.16304 | 0.669261 | 0.562 | 0.558 | CE |
| 2.76 | 2.15 | 0.77 | 0.278986 | 27.89855 | 0.306533 | -0.692 | 0.468 | P |
| 3.66 | 2.36 | 1.17 | 0.319672 | 31.96721 | 0.522088 | 0.069 | 0.544 | P |
| 3.05 | 2.35 | 1.46 | 0.478689 | 47.86885 | 0.440252 | -0.125 | 0.670 | CB |
| 2.79 | 2.15 | 1.11 | 0.397849 | 39.78495 | 0.380952 | 0.152 | 0.593 | CB |
| 3.28 | 2.19 | 1.34 | 0.408537 | 40.85366 | 0.561856 | -0.302 | 0.633 | CB |
| 3.13 | 2.37 | 1.22 | 0.389776 | 38.97764 | 0.397906 | 0.152 | 0.589 | B |
| 3.51 | 3.04 | 2.48 | 0.706553 | 70.65527 | 0.456311 | -0.262 | 0.834 | C |
| 2.87 | 2.17 | 0.89 | 0.310105 | 31.01045 | 0.353535 | -0.062 | 0.506 | B |
| 3.65 | 2.27 | 1.16 | 0.317808 | 31.78082 | 0.554217 | -0.471 | 0.549 | B |
| 3.38 | 2.14 | 1.55 | 0.45858 | 45.85799 | 0.677596 | 0.169 | 0.695 | CE |
| 3.09 | 1.85 | 0.67 | 0.216828 | 21.68285 | 0.512397 | 0.384 | 0.432 | B |
| 3.21 | 1.84 | 1.22 | 0.380062 | 38.00623 | 0.688442 | 0.005 | 0.635 | CE |
| 2.85 | 1.19 | 1.06 | 0.37193 | 37.19298 | 0.927374 | 0.495 | 0.695 | CE |
| 4.15 | 1.82 | 1.32 | 0.318072 | 31.80723 | 0.823322 | 1.148 | 0.616 | CE |
| 1.94 | 1.12 | 0.91 | 0.469072 | 46.90722 | 0.796117 | 1.016 | 0.727 | E |
| 2.92 | 2.25 | 1.38 | 0.472603 | 47.26027 | 0.435065 | -0.137 | 0.665 | B |
| 2.17 | 1.87 | 1.55 | 0.714286 | 71.42857 | 0.483871 | -0.022 | 0.841 | CE |
| 2.57 | 1.86 | 1.22 | 0.474708 | 47.47082 | 0.525926 | 0.053 | 0.680 | E |
| 2.29 | 1.87 | 1.43 | 0.624454 | 62.44541 | 0.488372 | -0.019 | 0.784 | CB |
| 2.71 | 1.94 | 0.97 | 0.357934 | 35.79336 | 0.442529 | -0.159 | 0.567 | B |
| 3.14 | 2.25 | 1.27 | 0.404459 | 40.44586 | 0.475936 | -0.059 | 0.614 | B |
| 3.08 | 1.82 | 1.55 | 0.503247 | 50.32468 | 0.823529 | 0.643 | 0.756 | E |
| 2.53 | 1.62 | 0.62 | 0.245059 | 24.50593 | 0.47644 | -0.093 | 0.458 | VB |
| 3.72 | 2.54 | 1.43 | 0.384409 | 38.44086 | 0.515284 | 0.039 | 0.603 | B |
| 3.47 | 1.95 | 1.49 | 0.429395 | 42.93948 | 0.767677 | 0.623 | 0.692 | VE |
| 3.32 | 1.69 | 1.57 | 0.472892 | 47.28916 | 0.931429 | 0.912 | 0.762 | E |
| 3.53 | 1.67 | 1.24 | 0.351275 | 35.12748 | 0.812227 | 0.889 | 0.642 | VE |
| 2.56 | 2.07 | 1.14 | 0.445313 | 44.53125 | 0.34507 | -0.348 | 0.629 | VP |
| 3.49 | 1.72 | 1.28 | 0.366762 | 36.67622 | 0.800905 | 0.433 | 0.651 | VE |
| 2.54 | 1.74 | 1.53 | 0.602362 | 60.23622 | 0.792079 | 0.485 | 0.811 | CE |
| 3.19 | 2.28 | 1.91 | 0.598746 | 59.87461 | 0.710938 | 0.352 | 0.796 | CE |
| 2.62 | 1.89 | 1.59 | 0.60687 | 60.68702 | 0.708738 | 0.343 | 0.801 | CE |
| 3.35 | 1.84 | 1.06 | 0.316418 | 31.64179 | 0.659389 | 0.503 | 0.570 | VE |
| 2.68 | 1.74 | 1.02 | 0.380597 | 38.0597 | 0.566265 | 0.173 | 0.609 | VB |
| 2.34 | 1.62 | 0.93 | 0.397436 | 39.74359 | 0.510638 | 0.027 | 0.614 | VB |
| 3.38 | 2.08 | 0.71 | 0.210059 | 21.00592 | 0.486891 | -0.062 | 0.419 | VB |
| 2.25 | 1.76 | 1.05 | 0.466667 | 46.66667 | 0.408333 | -0.197 | 0.655 | B |
| 2.25 | 1.24 | 0.89 | 0.395556 | 39.55556 | 0.742647 | -0.015 | 0.660 | VE |
Table 2: Results of pebble form indices for Location 1.
| L | I | S | S/L | FI | L-I/L-S | OPI | MPS | Form |
|---|---|---|---|---|---|---|---|---|
| 3.24 | 2.13 | 1.31 | 0.404321 | 40.4321 | 0.57513 | 0.186 | 0.631 | B |
| 2.12 | 1.27 | 0.78 | 0.367925 | 36.79245 | 0.634328 | 0.364 | `0.612 | B |
| 2.84 | 1.88 | 1.37 | 0.482394 | 48.23944 | 0.653061 | 0.317 | 0.708 | E |
| 2.66 | 1.64 | 1.18 | 0.443609 | 44.3609 | 0.689189 | 0.427 | 0.686 | VE |
| 2.59 | 1.86 | 1.11 | 0.428571 | 42.85714 | 0.493243 | -0.016 | 0.637 | B |
| 2.63 | 1.64 | 1.14 | 0.43346 | 43.34601 | 0.66443 | 0.379 | 0.673 | E |
| 2.29 | 1.62 | 1.21 | 0.528384 | 52.83843 | 0.62037 | 0.227 | 0.735 | B |
| 2.23 | 1.67 | 1.48 | 0.663677 | 66.36771 | 0.746667 | 0.372 | 0.839 | CE |
| 1.85 | 1.43 | 0.79 | 0.427027 | 42.7027 | 0.396226 | -0.244 | 0.671 | B |
| 4.5 | 2.66 | 2.42 | 0.537778 | 53.77778 | 0.884615 | 0.715 | 0.789 | CE |
| 3.72 | 2.64 | 1.37 | 0.36828 | 36.82796 | 0.459574 | -0.111 | 0.579 | B |
| 2.48 | 1.78 | 0.9 | 0.362903 | 36.29032 | 0.443038 | -0.157 | 0.571 | B |
| 3.02 | 2.72 | 2.16 | 0.715232 | 71.52318 | 0.348837 | -0.213 | 0.829 | CP |
| 2.36 | 1.77 | 0.91 | 0.385593 | 38.55932 | 0.406897 | -0.242 | 0.586 | B |
| 2.18 | 1.78 | 0.96 | 0.440367 | 44.0367 | 0.327869 | -0.390 | 0.614 | P |
| 2.47 | 1.93 | 1.42 | 0.574899 | 57.48988 | 0.514286 | 0.024 | 0.823 | CB |
| 2.74 | 1.47 | 0.93 | 0.339416 | 33.94161 | 0.701657 | 0.593 | 0.601 | VE |
| 2.33 | 1.58 | 0.86 | 0.369099 | 36.90987 | 0.510204 | 0.027 | 0.558 | B |
| 2.36 | 1.79 | 1.34 | 0.567797 | 56.77966 | 0.558824 | 0.102 | 0.754 | CB |
| 2.36 | 1.3 | 0.97 | 0.411017 | 41.10169 | 0.76259 | 0.639 | 0.677 | E |
| 2.28 | 1.74 | 0.72 | 0.315789 | 31.57895 | 0.346154 | -0.487 | 0.510 | VP |
| 1.92 | 1.31 | 0.82 | 0.427083 | 42.70833 | 0.554545 | 0.129 | 0.647 | B |
| 2.48 | 1.83 | 1.36 | 0.548387 | 54.83871 | 0.580357 | 0.146 | 0.743 | B |
| 1.95 | 1.56 | 1.06 | 0.54359 | 54.35897 | 0.438202 | -0.114 | 0.719 | B |
| 1.79 | 1.32 | 0.64 | 0.357542 | 35.75419 | 0.408696 | -0.256 | 0.560 | B |
| 2.39 | 1.67 | 1.08 | 0.451883 | 45.18828 | 0.549618 | 0.109 | 0.666 | B |
| 2.36 | 2.11 | 1.27 | 0.538136 | 53.81356 | 0.229358 | -0.504 | 0.689 | P |
| 2.38 | 1.71 | 0.93 | 0.390756 | 39.07563 | 0.462069 | -0.097 | 0.599 | B |
| 2.75 | 1.52 | 0.88 | 0.32 | 32 | 0.657754 | 0.494 | 0.573 | VB |
| 2.13 | 1.21 | 0.91 | 0.42723 | 42.723 | 0.754098 | 0.595 | 0.687 | E |
| 2.31 | 1.69 | 1.36 | 0.588745 | 58.87446 | 0.652632 | 0.259 | 0.781 | CB |
| 2.15 | 1.76 | 1.02 | 0.474419 | 47.44186 | 0.345133 | -0.327 | 0.653 | P |
| 2.28 | 1.87 | 1.12 | 0.491228 | 49.12281 | 0.353448 | -0.299 | 0.667 | B |
| 3.73 | 2.39 | 1.96 | 0.525469 | 52.54692 | 0.757062 | 0.489 | 0.757 | CE |
| 1.93 | 1.74 | 1.25 | 0.647668 | 64.76684 | 0.279412 | 0.0341 | 0.776 | CP |
| 2.76 | 2.27 | 1.45 | 0.525362 | 52.53623 | 0.374046 | -0.24 | 0.697 | B |
| 2.12 | 1.93 | 1.06 | 0.5 | 50 | 0.179245 | -0.642 | 0.652 | P |
| 3.27 | 3.05 | 2.19 | 0.669725 | 66.97248 | 0.203704 | -0.442 | 0.785 | CP |
| 2.06 | 1.49 | 1.07 | 0.519417 | 51.94175 | 0.575758 | 0.145 | 0.772 | P |
| 1.97 | 1.59 | 0.96 | 0.48731 | 48.73096 | 0.376238 | -0.253 | 0.667 | B |
| 2.21 | 2.17 | 1.76 | 0.79638 | 79.63801 | 0.088889 | 0.448 | 0.865 | P |
| 3.36 | 1.98 | 1.04 | 0.309524 | 30.95238 | 0.594828 | 0.306 | 0.549 | C |
| 3.67 | 2.14 | 1.49 | 0.405995 | 40.59946 | 0.701835 | 0.497 | 0.659 | B |
| 2.78 | 2.01 | 1.48 | 0.532374 | 53.23741 | 0.592308 | 0.173 | 0.734 | E |
| 2.97 | 2.09 | 0.93 | 0.313131 | 31.31313 | 0.431373 | -0.219 | 0.521 | CB |
| 3.08 | 2.14 | 1.63 | 0.529221 | 52.92208 | 0.648276 | 0.280 | 0.740 | VB |
| 2.77 | 1.94 | 1.68 | 0.606498 | 60.64982 | 0.761468 | 0.431 | 0.808 | B |
| 3.44 | 2.52 | 1.22 | 0.354651 | 35.46512 | 0.414414 | -0.241 | 0.559 | CE |
| 2.78 | 2.1 | 1.36 | 0.489209 | 48.92086 | 0.478873 | -0.043 | 0.684 | B |
| 2.6 | 1.78 | 0.96 | 0.369231 | 36.92308 | 0.5 | 0.0 | 0.587 | B |
Table 3: Results of pebble form indices for Location 2.
| L | I | S | S/L | (L-S)/(L-S) | MPS | OPI | FI | Form |
|---|---|---|---|---|---|---|---|---|
| 2.06 | 2.05 | 1.15 | 0.56 | 0.01 | 0.25 | - 8.75 | 56 | CP |
| 1.92 | 1.52 | 0.71 | 0.37 | 0.33 | 0.12 | - 4.59 | 37 | B |
| 1.97 | 1.81 | 0.61 | 0.31 | 0.12 | 0.20 | - 12.26 | 31 | P |
| 1.99 | 1.84 | 0.76 | 0.38 | 0.12 | 0.26 | -10.00 | 38 | P |
| 2.47 | 2.25 | 0.92 | 0.37 | 0.14 | 0.17 | - 9.73 | 37 | P |
| 1.82 | 1.54 | 0.84 | 0.46 | 0.29 | 0.32 | - 4.57 | 46 | P |
| 2.04 | 1.81 | 0.50 | 0.25 | 0.15 | 0.17 | - 14.00 | 25 | VP |
| 2.02 | 1.93 | 1.03 | 0.51 | 0.10 | 0.26 | - 7.84 | 51 | CP |
| 2.53 | 2.45 | 0.93 | 0.37 | 0.05 | 0.15 | - 12.16 | 37 | P |
| 1.72 | 1.65 | 1.26 | 0.73 | 0.15 | 0.41 | - 4.79 | 73 | CP |
| 2.28 | 2.03 | 1.07 | 0.47 | 0.21 | 0.23 | - 6.17 | 47 | P |
| 1.83 | 1.62 | 0.81 | 0.44 | 0.21 | 0.29 | - 6.59 | 44 | P |
| 2.01 | 1.72 | 1.25 | 0.62 | 0.38 | 0.34 | - 1.94 | 62 | CB |
| 1.82 | 1.51 | 0.90 | 0.49 | 0.34 | 0.34 | - 3.27 | 49 | B |
| 2.20 | 2.04 | 0.94 | 0.43 | 0.13 | 0.21 | - 8.60 | 43 | P |
| 2.06 | 1.83 | 0.95 | 0.46 | 0.21 | 0.27 | - 6.30 | 46 | P |
| 2.38 | 2.15 | 0.62 | 0.26 | 0.13 | 0.14 | - 14.23 | 26 | VP |
| 2.14 | 2.91 | 0.85 | 0.40 | 0.18 | 0.22 | - 6.00 | 40 | P |
| 1.96 | 1.76 | 1.01 | 0.52 | 0.21 | 0.29 | - 5.58 | 52 | CP |
| 2.17 | 2.08 | 0.51 | 0.24 | 0.05 | 0.14 | - 16.75 | 24 | VP |
| 1.74 | 1.6 | 1.01 | 0.58 | 0.19 | 0.36 | - 5,34 | 58 | CP |
| 2.21 | 2.05 | 1.05 | 0.48 | 0.14 | 0.23 | - 7.50 | 48 | P |
| 1.64 | 1,50 | 0.98 | 0.60 | 0.21 | 0.40 | - 4.83 | 60 | CP |
| 2.16 | 1.91 | 1.09 | 0.50 | 0.23 | 0.26 | - 5.40 | 50 | P |
| 2.15 | 1.96 | 0.87 | 0.40 | 0.15 | 0.22 | - 8.75 | 40 | P |
| 2.39 | 2.08 | 1.25 | 0.52 | 0.27 | 0.23 | - 4.42 | 52 | CP |
| 2.10 | 1.82 | 0.74 | 0.35 | 0.21 | 0.21 | - 8.29 | 35 | P |
| 2.03 | 1.80 | 0.54 | 0.27 | 0.15 | 0.18 | - 10.96 | 27 | VP |
| 1.98 | 1.82 | 1.11 | 0.56 | 0.18 | 0.30 | - 5.71 | 56 | CP |
| 2.12 | 2.01 | 1.05 | 0.50 | 0.10 | 0.24 | - 8.00 | 50 | P |
Table 4: Results of pebble form indices for Location 3.
• Maximum Projection Sphericity (MPS)
MPS = (S2 / LI )1/3
Or 
• Oblate Prolate Index (OPI)
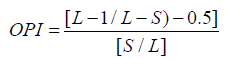
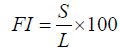
• Flatness Index (FI)
Results and Discussion
Pebble form indices
Several pebble morphometric studies have shown that pebble form indices are a very useful indicator of the depositional environments. Bivariate plots of maximum projection sphericity against oblate prolate index and coefficient of flatness against maximum projection sphericity [18-20] were plotted to discriminate fluvial and beach processes. The parameters were also plotted on the sphericity form diagram to determine the form classes as described by Sneed and Folk [21]. The plots of co-efficient of flatness against sphericity and the plots of sphericity against oblate-prolate index (Figures 7a-7f) indicate that the pebbles are deposited in fluvial but predominantly beach environment. The sphericity form diagrams (Figures 8a-8c), showed that most of the pebbles fall within the CP (compact platy), P (platy), E (elongate), B (bladed), and CB (compact bladed) and this suggests that the pebbles of the study area were largely shaped by beach and fluvial action, but a predominance of the bladed form suggests a transition from fluvial to beach environment. Tables 5 and 6 showed mean value of maximum projection sphericity is (0.789), Oblate-prolate index (-0.066) and coefficient of flatness (44.7%) in correlation with Table 5 showed that they were deposited in fluvially agitated shallow marine environment (Estuarine) [22].

Figure 7a: A plot of co-efficient of flatness against sphericity for Table 3.

Figure 7b: A plot of co-efficient of flatness against sphericity for Table 4.

Figure 7c: A plot of co-efficient of flatness against sphericity forT able 5.

Figure 7d: A plot of sphericity against oblate-prolate index for Table 3.

Figure 7e: A plot of sphericity against oblate-prolate index for Table 4.

Figure 7f: A plot of sphericity against oblate-prolate index for Table 5.

Figure 8a: Sphericity-form diagram for Table 3.

Figure 8b: Sphericity-form diagram for Table 4.

Figure 8c: Sphericity-form diagram for Table 5.
| Indices | Fluvial | Shallow marine | References |
|---|---|---|---|
| MPS | > 0.65 | < 0.65 | [18] |
| OPI | >-1.5 | <-1.5 | [18] |
| FI | > 45% | < 45% | [22] |
Table 5: Critical values of form indices for fluvial and shallow marine processes
| Variables | Pebble | MPS | OPI | FI |
|---|---|---|---|---|
| Value | 1-130 | 0.789 | -0.066 | 44.7% |
| Interpretation | --- | Fluvial | Shallow marine | Shallow marine |
Table 6: Limit of form Indies for pebbles in the study area.
Facies indication
The sedimentary structures and facies association of the Maastrichtian to Danian age in the area are suggestive of deposition in a fluvially agitated estuarine environment with tidal crosscuts. The Unit I which consist of cross bedded friable sandstone, white - yellow in color, ferruginized, medium to fine grained and occasionally pebbly to cobbly intervals suggest fluvial deposition. The Unit II consisting of intercalation of medium to coarse grained, locally pebbly, reddish brown, poorly sorted sandstone and siltstone clays suggest a tidal-estuarine deposition. The deposition of clay to shale and to sandstone within the unit, indicate a coarsening upwards sequence which suggest shoreface deposition.
Conclusion
The flatness index, oblate-prolate index and maximum projection sphericity mean values for the pebbles of Maastrichtian to Danian age in the study area are indicative of fluvio-estuarine environment. Plots of sphericity against oblate-prolate index and coefficient of flatness (flatness index) against sphericity indicate a fluvio-estuarine origin for the pebbles. The sphericity form diagram showed that the pebbles lie within a transitional setting (probably fluvial to estuarine environment). The sedimentary facies analysis suggests a fluvially agitated estuarine system characterized by shoreface, tidal-estuarine, and fluvial deposits.
References
- Murat RC (1972) Stratigraphy and paleogeography of the cretaceous and lower tertiary in Southern Nigeria. Ibadan University Press, Ibadan Nigeria. pp: 251-266.
- Nwachukwu SO (1972) The tectonic evolution of southern portion of Benue Trough. Nigerian Geological Magazine 109: 411-419.
- Kogbe CA (1976) Paleographic history of Nigeria from Albian times. In: Geology of Nigeria, Kogbe, C.A. (Ed.). Elizabethan Publishers, Lagos Nigeria pp: 237-252.
- Petters SW (1978) Stratigraphic evolution of the Benue Trough and its implication for the Upper Cretaceous paleogeography. West African J Geol 86: 311-322.
- Hoque M, Nwajide CS (1985) Tectono-sedimentogical evolution of elongate intracratonic basin (aulacogen): The case of the Benue Trough of Nigeria. Journal of Mining Geology 21: 19-26.
- Nwajide CS (1990) Cretaceous sedimentation and paleogeography of the Central Benue Trough. In: Ofoegbu, C.O. (Ed). The Benue Trough structural and evolution. International monograph series, Braunschweigh pp: 19-38.
- Obi GC, Okagbue CO, Nwajide CS (2001) Evolution of the Enugu Cuesta: A tectonically driven erosional process. Global Journal of Pure and Applied Sciences 7: 321-330.
- Nwajide CS (2013) Geology of Nigeria’s sedimentary basins. CSS Bookshop Limited, Lagos Nigeria pp: 565.
- Hoque M (1976) Significance of textural and petrographic attributes of several cretaceous sandstone. Southeastern Nigeria. J Geol Soc India 17: 514-521.
- Hoque M, Ezepue MC (1977) Petrology and paleogeography of the Ajali Sandstone. J Geol Min Res 14: 16-22.
- Obi GC (2000) Depositional model for the Campanian-Maastrichtian Anambra Basin, Southeastern, Nigeria. PhD Thesis, Department of Geology, University of Nigeria, Nsukka. p: 286.
- Ekwueme BN (1985) The chemical composition and industrial quality of limestone, southeastern Nigeria. Nigerian Journal of Mining and Geology 22: 51-56.
- Ephraim BE, Odumodu CFR (2015) Petrological and geochemical analysis with insights into the uses of the Upper Maastrichtian-Paleocene limestone deposits in parts of Southeastern Nigeria. Comminicacoes Geologicas 10: 1-12.
- Balogun OY (2009) Senior Secondary Atlas (2nd edn). Lagos: Longman Nigeria Plc. p: 123.
- Federal Surveys of Nigeria (1981) Okigwe 312 Sheet. (2nd edn). Lagos, Nigeria.
- Reyment RA (1965) Aspects of the geology of Nigeria. Ibadan University Press, Nigeria. p: 145.
- Odumodu CFR (2014) Pebble form indices as signatures of the depositional environment of the Benin Formation along Atamiri River, Uli, South-eastern Nigeria. Int J Sci Res 3: 23-32.
- Dobkins JE, Folk RL (1970) Shape development of Tahiti – Nui J Sed Petrol 40: 1167-1203.
- Sames CW (1966) Morphometric data of some recent pebbles associations and their application to ancient deposits. J Sed Petrol 36: 126-142.
- Tucker ME (1981) Sedimentary petrology: An introduction. John Wiley and Sons Inc., New York, USA. pp: 350.
- Sneed ED, Folk RL (1958) Pebbles in the lower Colorado River, Texas; a study of particle morphogenesis. J Geol Soc 66: 114-150.
- Stratten T (1974) Notes on the application of shape parameters to differentiate between beach and river deposits in southern Africa. Trans GeoL Soc S Afr 77: 59-64
Citation: Chidera Ikechukwu V, Okpoko Ephraim I, Egbunike Michael E (2019) Evaluation of Pebble form Indices as Paleoenvironmental Signatures of the Maastrichtian - Danian Age Using Quartz Clasts in Owerre-Ezukala Area, Southeast of Nigeria. J Earth Sci Clim Change 10: 504.
Copyright: © 2019 Chidera Ikechukwu V, et al. This is an open-access article distributed under the terms of the Creative Commons Attribution License, which permits unrestricted use, distribution, and reproduction in any medium, provided the original author and source are credited.
Select your language of interest to view the total content in your interested language
Share This Article
Recommended Journals
Open Access Journals
Article Usage
- Total views: 4695
- [From(publication date): 0-2019 - Dec 19, 2025]
- Breakdown by view type
- HTML page views: 3709
- PDF downloads: 986