Experimental Analysis of Parabolic Trough Concentrating Collector Using Ethylene Glycol Based Mixture
Received: 11-May-2017 / Accepted Date: 25-May-2017 / Published Date: 31-May-2017 DOI: 10.4172/2576-1463.1000157
Abstract
There are various different experiments going on all around the world to achieve the high efficiency of collector and this research paper is based on experimental study on the performance evaluation of Parabolic Trough Collector (PTC), which is associated with the use of ethylene glycol and distilled water based mixture as working fluid. It has been observed from experimental studies that the overall thermal efficiency of PTC with the use of a mixture at 100 L/h found to be 6.4%, which is much higher than the efficiency outcome at 160 L/h around 5.89%. Moreover, this paper also demonstrates the experimental evaluation of thermo physical properties like thermal conductivity, density or specific gravity and viscosity of the ethylene glycol and distilled water based mixture.
Keywords: Solar energy; Parabolic trough collector; Ethylene glycol; Thermal efficiency; Thermo physical properties
22738Nomenclature
Cpm=Specific heat of mixture contain ethylene glycol and distilled water in  .
.
Cp1=Specific heat of water in .
Cp2=Specific heat of ethylene glycol in .
X1=Mole fraction of water.
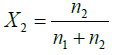
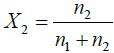
X2=Mole fraction of ethylene glycol.
Qu=Useful heat gain in watt.
Tout=Outlet temperature of mixture in °C.
Tin=Inlet temperature of mixture in °C.
Aaper=Aperture area of the solar parabolic collector.
m=Mass flow rate of mixture containe ethylene glycol and water.
GT=Solar intensity in W/m2.
t=Time period in second.
Rb=Bond resistance and taken as ‘1’.
W=Width of the collector.
L=Length of the collector.
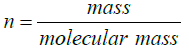
m=Mass of mixture (i.e., m=(ρ × v).
K (capillary constant)=0.02672 mm2/s2.
ηth=Thermal efficiency of the mixture.
Eint=Instantaneous energy production.
ηot =Overall thermal efficiency (average) of the mixture.
Introduction
The utilization of solar energy is a possible and effective way to reduce the shortage of the energy and for the conservation of the environment. It has been seen that energy provided by renewable energy sources up to 19.1% of total energy consumption globally. Today solar heating systems are widely known throughout the world for hot water supply in the domestic areas and the total solar hot water heating capacity based on solar thermal collector was estimated at 373 GW globally up to the end of 2013 and it expands up to 406 GW by the end of year 2014 [1]. There are abundant researches going on throughout the globe in the area of low temperature and medium temperature solar thermal technologies like solar refrigeration and air conditioning, solar power generation by concentrating and non concentrating solar thermal technologies especially for industrial process heating. Therefore, further studies and developments in the solar thermal collector technology to enhance the growth of solar thermal applications are necessary.
Solar radiations are directed toward solar thermal collectors, which are captured and absorbed by the selective coating on the collector’s receiver tube and finally transferred to the Heat-Transfer Fluid (HTF) flowing inside the tube. There are many studies regarding the formulation of the performance of solar thermal collectors and optical properties of the nano-fluid mixture in which nano-particles are suspended in water or ethylene glycol. The efficiency of flat plate collector could be improved up to 5% by using a mixture of the water and various nano particles like carbon nanotubes, graphite and silver [2]. In another study formulation of the optical behavior of single-wall carbon nanohorns and ethylene glycol based mixture for solar heat absorption applications were discussed [3]. Multiwall carbon nanotubes (MWCNTs), poly (ethylene glycol) (PEG) and inorganic SiO2 can be used to fabricate the high thermal conductivity carbon nanotube, Poly Ethylene glycol and inorganic SiO2 composites. Therefore, these composites can be effectively utilized for the efficiency improvement of solar devices [4]. Furthermore study related to investigating the performance of nanofluid based low temperature Direct Absorption Solar Collector (DAC) by using water and aluminum nanoparticles mixture. Finally, the results of the study concluded that with 1% volume fraction of aluminum nanoparticles in water considerably improves the solar absorption capacity and also found that the minimal effect of particle size on the optical properties of nanofluid [5]. On the other hand, performance of a gas-based type nanofluid using solar parabolic trough collector coupled with transparent receiver can be formulated for the achievement of high-temperature around 650°C [6]. Moreover, theoretical and experimental investigation of novel Nanofluid-based Direct Absorption Solar Collector (NDASC) and its operating characteristics for medium-temperature solar collection concluded that the temperature distribution of the CuO/oil nanofluid in the NDASC was much more uniform and higher efficiency than that in the Indirect Absorption Solar Collector (IASC) [7].
Solar Parabolic Trough Collector (SPTC) is a prominent and promising way to generate the electricity along with used for other applications with 400°C operating temperatures [8]. An experiment is conducted to determine the performance of different components of the parabolic trough collector and all research programs was performed at Mangosuthu Technikon’s STAR Lab for low temperature testing by using water as working fluid for PTC system. In this research program, evacuated and non evacuated glass covered receiver tube were tested. At high temperature, glass covered receiver tube brings out better results from research work [9]. After reviewing all these past researches, it has been observed that many types of studies are available and going on today related to enhance the performance of the solar thermal collectors. The aim of current research is also to enhance the performance of solar parabolic trough collector by using ethylene glycol in different proportions with distilled water along with evaluation of the thermo physical properties experimentally. Therefore the current study is original and valuable according to research point of view.
Methodology Of Experimental Work
Experimental set up
Parabolic trough collector’s experimental set up includes the stainless steel collector sheet in a parabolic shape, mirror strips are used as a parabolic reflector, glass tube for vacuum creation and most importantly receiver tube which is made up of copper to absorb the highest amount of solar flux apart from these thermometer used to sense inlet and outlet temperature, ball valve for variation of volume flow rate, insulated storage tank with the capacity of 8 L, piping to flow the mixture of distilled water and ethylene glycol, manual tracking system for tracking the solar collector in east to west direction with the movement of sun, proper insulation used on the piping system to prevent heat loss from working fluid and a pump of 18 W power used to circulate the water through the pipes and from the copper tube at certain height.
Mixture preparation
The ethylene glycol’s IUPAC name is Ethane-1,2-diol and its formation are due to the chemical reaction of ethylene (ethene) oxide with of a water Mixture of ethylene glycol and distilled water prepare are in the ratio 40 to 60. The total amount of mixture is decided as 6 L, which means the amount of ethylene glycol is 2.4 L and amount of distilled water is 3.6 L. The sonication process is not required because both the liquids are completely soluble or miscible with each other.
Experimental study about properties of ethylene glycol and distilled water based mixture
A device used to measure the thermal conductivity of the mixture of ethylene glycol and distilled water is KD2 PRO. KD2PRO can be used to measure thermal conductivity as well as thermal diffusivity after an interval at some certain temperature according to requirement and KD2PRO works on the principle of the transient hot wire.
Furthermore device used to measure density of ethylene glycol and water based mixture experimentally is density meter (AntonPaar-DMA 4500) and also known by U-Tube oscillating apparatus (Figures 1-6). This device can be used to measure density as well as specific gravity of the liquid at certain temperature and liquid is injected in the density meter up to approximately 4 ml amount (Tables 1-4).
| Variables | Value |
|---|---|
| Length of Collector | 1.2 m |
| Breadth of Collector | 0.915 m |
| Thickness | 2 mm |
| Aperture area | 1.0188 m2 |
| Receiver tube inside diameter | 0.027 m |
| Receiver tube outside diameter | 0.028 m |
| Glass tube inside diameter | 0.064 m |
| Glass tube outside diameter | 0.066 m |
| Volume flow rate | 160L/h & 100L/h |
Table 1: Design and fabrication data of parabolic trough collector [11].
| S. No. | Time Interval | Temperature (In) (°C) |
Temperature Out (°C) |
Solar Intensity (W/m2) |
Wind speed (m/s) |
Temperature Difference (°C) |
|---|---|---|---|---|---|---|
| 1 | 9:30-10:00 | 20.2 | 26 | 764.71 | 0.6 | 5.8 |
| 2 | 10:00-10:30 | 25.9 | 33.6 | 831.01 | 0.8 | 7.7 |
| 3 | 10:30-11:00 | 33.4 | 41.2 | 894.34 | 1.2 | 7.8 |
| 4 | 11:00-11:30 | 40.8 | 48.2 | 912.96 | 0.4 | 7.4 |
| 5 | 11:30-12:00 | 47.6 | 53.3 | 967.35 | 0.6 | 5.7 |
| 6 | 12:00-12:30 | 53 | 56.6 | 994.17 | 0.5 | 3.6 |
| 7 | 12:30-1:00 | 57.5 | 59.3 | 983.74 | 0.8 | 1.8 |
| 8 | 1:00-1:30 | 59.2 | 60.6 | 946.49 | 1.6 | 1.4 |
| 9 | 1:30-2:00 | 58.1 | 58.9 | 931.59 | 2 | 0.8 |
| 10 | 2:00-2:30 | 59.6 | 58.9 | 901.79 | 1.8 | -0.7 |
Table 2: Variation in temperature difference with change in time at 160l/h.
| S. No. | Time Interval | Temperature (In) (°C) |
Temperature (Out) (°C) |
Solar Intensity (W/m2) |
Wind speed (m/s) |
Temperature Difference (°C) |
|---|---|---|---|---|---|---|
| 1 | 9:30-10:00 | 18.5 | 24 | 755.034 | 0.3 | 5.5 |
| 2 | 10:00-10:30 | 23.6 | 29.6 | 880.939 | 0.8 | 6 |
| 3 | 10:30-11:00 | 29.2 | 34.5 | 749.074 | 1.7 | 5.3 |
| 4 | 11:00-11:30 | 34.4 | 40.1 | 864.549 | 1.1 | 5.7 |
| 5 | 11:30-12:00 | 39.9 | 45 | 903.289 | 1 | 5.1 |
| 6 | 12:00-12:30 | 45 | 48.2 | 785.579 | 0.5 | 3.2 |
| 7 | 12:30-1:00 | 48.2 | 51.3 | 855.609 | 1.5 | 3.1 |
| 8 | 1:00-1:30 | 51.3 | 54.7 | 842.199 | 0.4 | 3.4 |
| 9 | 1:30-2:00 | 54.7 | 56.4 | 747.584 | 0.9 | 1.7 |
| 10 | 2:00-2:30 | 56.4 | 57.3 | 702.139 | 1.2 | 0.9 |
Table 3: Variation in temperature difference with change in time at 100l/h.
| H2O+C2H6O2 (60:40) |
Thermal conductivity (W/m-k) |
Room Temperature (°C) |
Error occurred |
|---|---|---|---|
| 0.434 | 23.97 | 0.0066 | |
| 0.397 | 22.82 | 0.0048 | |
| 0.400 | 22.79 | 0.0041 | |
| 0.414 | 22.75 | 0.0048 | |
| 0.416 | 22.74 | 0.0048 | |
| 0.405 | 22.73 | 0.0043 | |
| 0.406 | 22.72 | 0.0037 | |
| Average=0.4102 | |||
Table 4: Experimental thermal conductivity data at various room temperatures.

Figure 1: Parabolic Trough Collector (PTC).

Figure 2: Sample of ethylene glycol.

Figure 3: Mixture of ethylene glycol and distilled water.

Figure 4: Shows the conductivity meter (KD2 PRO).

Figure 5: Shows density meter (Anton Paar-DMA 4500).

Figure 6: Shows the kinematic viscometer (Petrotest Viscobath).
In addition, the viscosity of the mixture can be determined by automated kinematic Viscometer and known by petrotest viscobath Viscometer is used to evaluate the kinematic viscosity of Newtonian liquids. The kinematic viscosity of liquids can be calculated by using the following equation:
Kinematic viscosity=K × T
Where K (capillary constant)=0.02672 mm2/s2 and T is flow time period of the liquid.
Formula used for determination of theoretical properties and performance of parabolic trough collector system
(A) Specific heat for mixture of ethylene glycol and water based mixture:
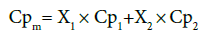
Where
Note: By volume (60:40) means total mixture amount of 6 L contain 3.6 L amount of water and 2.4 L of ethylene glycol
Therefore n1=199.8223 mole and n2=42.91 mole.
We know Cp1 (for water) is 4.186 and Cp2 (for ethylene glycol) is 2.2 .
X1=0.8232; X2=0.17677
Finally the specific heat of mixture by using all the relative data.
(B) Useful heat gain by the parabolic trough collector [10].
Mass flow rate of mixture=Experimental density of mixture × Volume flow rate
Therefore,
m=46.8201 g/s [if volume flow rate=160 L/h]
m=29.2625 g/s [if volume flow rate =100 L/h]
(C) Thermal efficiency (ηth) of the mixture of ethylene glycol and water [11].
(D) ηth=mCPmixture(Tout-Tin)/AaperGTt.
(E) Instantaneous energy production (Eint) of the mixture of ethylene glycol and water [11].
Eint=qu / GTRb W L
(F) Overall thermal efficiency (ηot) (average) of the mixture of ethylene glycol and water [11].
(G) ηot =mCPmixture(Tmax-Tmini)/AaperGavt
Results And Discussion
Figure 7 shows the variations in temperature difference With respect to time is more for 160 L/h as compared to the 100 L/h up to day time 1:00 PM. After 1:00 PM graph shows a sudden change in the temperature difference for 100 L/h, which is more with respect to temperature difference for 160 L/h. The temperature difference is directly dependent upon variation in solar intensity throughout the span of experimental work, as solar intensity increases both inlet and outlet temperature are also tend to increase and corresponding increasing in temperature difference noticed during the experimental study. Figures 8 and 9 shows variation in inlet and outlet temperature of mixture flowing through parabolic trough solar collector with respect to solar intensity. Table 2 show maximum outlet temperature of mixture contain ethylene glycol and water comes out 60.6°C for 160 L/h, which is more than 57.3°C for 100 L/h shown in Table 3. Maximum solar intensity for 160 L/h volume flow rate is 994.17 W/m2, which is a little bit more as compared to 903.289 W/m2 for 100 L/h. Tables 5 and 6 shows experimental variations in density and kinematic viscosity whose values continuously decrease with increase in temperature of the mixture. Tables 7 and 8 show variations in useful heat gain, thermal efficiency, instantaneous energy production comes out from parabolic trough solar collector using a mixture of ethylene glycol and distilled water. Experimental results show maximum useful heat gains by parabolic solar collector 1400.456 W in case of 160 L/h volume flow rate. While in case of 100 L/h maximum useful heat gain by solar collector is 673.278 W, which is small in amount as compare to 1400.456 W. Maximum thermal efficiency comes out 12.24% at 160 L/h in the time interval 10:00-10:30 AM which is more in amount as compared to 9.6% maximum thermal efficiency at 100 L/h in the time interval 9:00-9:30 AM. Overall thermal efficiency of parabolic solar collector in the case of 160 L/h is 5.89%, which is less than the overall thermal efficiency of solar collector using mixture contain ethylene glycol and distilled water at 100 L/h comes out 6.4%. Figure 10 shows useful heat gains for same mixture at a different volume flow rate. Experimental data shows useful heat gain for 160 L/h give impressive results as compare to 100 L/h. Figure 11 shows changes in thermal efficiency for same mixture contain ethylene glycol and distilled water at a different volume flow rate at 160 L/h and 100 L/h. Thermal efficiency majorly connected to mass of mixture flowing through the absorber of collector system and further also directly proportional to the temperature difference and there is a considerable effect of variation in temperature difference in thermal efficiency and the graph of Thermal efficiency for 160 L/h shows better results as compare to results outcome from 100 L/h. After 12:00 pm mixture shows different results, i.e., mixture at 100 L/h show better thermal efficiency as compared to thermal efficiency achieved from the mixture at 100 L/h.
| H2O+C2H6O2 (60:40) |
Density (g/cm3) | Specific gravity | Temperature (°C) |
|---|---|---|---|
| 1.05589 | 1.0568 | 15.02 | |
| 1.05274 | 1.0549 | 20.98 | |
| 1.05173 | 1.0543 | 22.97 | |
| Average=1.053453 |
Table 5: Shows change in experimental density with change in temperature.
| H2O+C2H6O2 (60:40) |
Kinematic viscosity (mm2/s) | Time taken (s) | Temperature (°C) |
|---|---|---|---|
| 2.11088 | 79 | 30.3 | |
| 1.79024 | 67 | 38.8 | |
| 2.24448 | 84 | 28.2 | |
| Average=2.04853 |
Table 6: Experimental kinematic viscosity at different temperature.
| S. No. | Time Interval | Temperature difference Δt=(tout-tin) |
Useful Heat Gain (qu) watt | Thermal Efficiency (ηth) |
Overall Thermal Efficiency (ηot) |
|---|---|---|---|---|---|
| 1 | 9:30-10:00 | 5.8 | 1041.365 | 10.02% | 5.89% |
| 2 | 10:00-10:30 | 7.7 | 1382.502 | 12.24% | |
| 3 | 10:30-11:00 | 7.8 | 1400.456 | 11.52% | |
| 4 | 11:00-11:30 | 7.4 | 1328.638 | 10.71% | |
| 5 | 11:30-12:00 | 5.7 | 1023.410 | 7.7% | |
| 6 | 12:00-12:30 | 3.6 | 646.364 | 4.7% | |
| 7 | 12:30-1:00 | 1.8 | 323.182 | 2.4% | |
| 8 | 1:00-1:30 | 1.4 | 251.364 | 1.95% | |
| 9 | 1:30-2:00 | 0.8 | 143.636 | 1.13% | |
| 10 | 2:00-2:30 | -0.7 (heat loss) | 0 | 0 |
Table 7: Variation in useful heat gain, thermal efficiency, and overall thermal efficiency with temperature difference at 160L/h.
| S. No. | Time Interval | Temperature difference Δt=(tout-tin) |
Useful Heat Gain (qu) | Thermal Efficiency (ηth) |
Overall Thermal Efficiency (ηot) |
|---|---|---|---|---|---|
| 1 | 9:30-10:00 | 5.5 | 617.17 | 9.6% | 6.4% |
| 2 | 10:00-10:30 | 6 | 673.278 | 9% | |
| 3 | 10:30-11:00 | 5.3 | 594.728 | 9.3% | |
| 4 | 11:00-11:30 | 5.7 | 639.614 | 8.71% | |
| 5 | 11:30-12:00 | 5.1 | 572.286 | 7.46% | |
| 6 | 12:00-12:30 | 3.2 | 359.081 | 5.38% | |
| 7 | 12:30-1:00 | 3.1 | 347.860 | 4.78% | |
| 8 | 1:00-1:30 | 3.4 | 381.524 | 5.33% | |
| 9 | 1:30-2:00 | 1.7 | 190.762 | 3% | |
| 10 | 2:00-2:30 | 0.9 | 100.991 | 1.69% |
Table 8: Variation in useful heat gain, thermal efficiency, and overall thermal efficiency with temperature difference at 100L/h.

Figure 7: Variation in temperature difference with time interval of half an hour.

Figure 8: Variation in inlet and outlet temperature and solar intensity with change in the day for 160l/h.

Figure 9: Variation in inlet and outlet temperature and solar intensity with the change of the day for100l/h.

Figure 10: Variation in useful heat gain of ethylene glycol and distilled water based mixture at 160L/h and 100L/h.

Figure 11: Shows the variation in thermal efficiency of ethylene glycol and distilled water based mixture at 160L/h and 100L/h.
Conclusion
1. Useful heat gain and instantaneous energy production show same results for both 160 L/h and 100 L/h but thermal efficiency for 160 L/h shows better results as compared to 100 L/h up to the middle of the day.
2. Overall efficiency for a mixture of ethylene glycol and water based mixture is best for 100 L/h as compared to overall efficiency comes from mixture at 160 L/h.
3. Density and kinematic viscosity of mixture decreases as well as temperature increases.
4. Solar intensity increases with increase the temperature difference and this temperature difference also affected by wind speed during the experimental work, which in turn effect of the useful heat gain, instantaneous energy production and overall thermal efficiency.
5. Solar intensity is inversely proportional to instantaneous energy production and thermal efficiency. Therefore, with increase in solar intensity during the experiment, the instantaneous efficiency and thermal efficiency will be decreased.
Acknowledgement
This research acknowledge the funding support of Department of mechanical, industrial and automobile engineering of Delhi Technological university, New Delhi. In addition as an author, I am very grateful to Dr. Kundan lal, Assistant Professor of Thapar University (Patiala) for allows me to conduct experimental work on the PTC collector system and also thankful for his guidance throughout the experimental procedure.
References
- Otanicar TP, Phelan PE, Prasher RS, Rosengarten G, Taylor RA (2010) Nanofluid-based direct absorption solar collector. J Ren Sustain Energ 2: 033102.
- Sani E, Mercatelli L, Barison S, Pagura C, Agresti F, et al. (2011) Potential of carbon nanohorn-based suspensions for solar thermal collectors. Solar Energ Mat Solar Cells 95: 2994-3000.
- Tang B, Wang Y, Qiu M, Zhang S (2014) A full-band sunlight-driven carbon nanotube/PEG/SiO2 composites for solar energy storage. Solar Energ Mat Solar Cells 123: 7-12.
- Saidur R, Meng TC, Said Z, Hasanuzzaman M, Kamyar A (2012) Evaluation of the effect of nanofluid-based absorbers on direct solar collector. Int J Heat Mass Trans 55: 5899-5907.
- De Risi A, Milanese M, Laforgia D (2013) Modelling and optimization of transparent parabolic trough collector based on gas-phase nanofluids. Renew Energ 58: 134-139.
- Xu G, Chen W, Deng S, Zhang X, Zhao S (2015) Performance evaluation of a nanofluid-based direct absorption solar collector with parabolic trough concentrator. Nanomaterials 5: 2131-2147.
- Fernandez-Garcia A, Zarza E, Valenzuela L, Pérez M (2010) Parabolic-trough solar collectors and their applications. Renew Sustain Energ Rev 14: 1695-1721.
- Brooks MJ, Mills I, Harms TM (2006) Performance of a parabolic trough solar collector. J Energ Southern Afr 17: 71-80.
- Sukhatme SP (2007) Principles of thermal collection and storage. McGraw Hill, New Delhi, India.
- Kumar S, Lal K, Sharma S (2014) Performance evaluation of a nanofluid based parabolic solar collector-an experimental study. Twelveth IRF International Conference 2014, Chennai, India.
Citation: Singh H, Mishra RS (2017) Experimental Analysis of Parabolic Trough Concentrating Collector Using Ethylene Glycol Based Mixture. Innov Ener Res 6: 157. DOI: 10.4172/2576-1463.1000157
Copyright: © 2017 Singh H, et al. This is an open-access article distributed under the terms of the Creative Commons Attribution License, which permits unrestricted use, distribution, and reproduction in any medium, provided the original author and source are credited.
Select your language of interest to view the total content in your interested language
Share This Article
Recommended Journals
Open Access Journals
Article Tools
Article Usage
- Total views: 5440
- [From(publication date): 0-2017 - Aug 29, 2025]
- Breakdown by view type
- HTML page views: 4404
- PDF downloads: 1036