Fetuin-A as a Possible Marker of Nonalcoholic Fatty Liver Disease in Patients with Non-Surgical Weight Loss
Received: 01-Aug-2017 / Accepted Date: 14-Aug-2017 / Published Date: 25-Aug-2017 DOI: 10.4172/2165-7904.1000350
Abstract
Objective: Overweight and obesity are ranked as the fifth leading cause for global deaths and significantly contribute to nonalcoholic fatty liver disease (NAFLD), a common comorbidity finally leading to end-stage liver disease. The diagnostic tool for confirming NAFLD is liver biopsy, an invasive procedure known to cause complications. Results from transient elastography are not reliable in obese patients. Therefore, alternative diagnostic approaches are necessary. One putative biomarker is fetuin-A, also known as α2-Heremans-Schmid Glycoprotein (AHSG), which has been proposed for the diagnosis of NAFLD. We therefore aimed to examine the role of fetuin-A in severely obese patients and its value in predicting NAFLD.
Methods: 62 obese patients with a body mass index of at least 30 kg/m2 undergoing a medically supervised weight loss program were analysed at time points T0 (before weight loss), T1 (after non-surgical weight loss within 12 weeks), and T2 (after 52 weeks). Anthropometrical parameters, laboratory values for NAFLD, fetuin-A, “Fatty Liver-index” (FLI), and NASH-Score were determined.
Results: 38 out of 62 patients completed the program. These patients showed a significant decrease in BMI (T0: 41.5 ± 7.1 kg/m2; T2: 33.5 ± 7.0 kg/m2; p<0.001 each). While markers of NAFLD improved from T0 to T2, no significant change was observed in fetuin-A (p=0.36). FLI and NASH-Score significantly improved over time (p ≤ 0.001; p=0.03). Both scores failed to show a correlation with fetuin-A at baseline or during the program.
Conclusion: Fetuin-A does not appear to be suitable for diagnosis and follow-up of NAFLD in patients with severe obesity.
Keywords: α2-Heremans-Schmid glycoprotein; Steatohepatitis; Obesity
Abbreviations
AAR: AST/ALT Ratio; AHSG: α2-Heremans-Schmid Glycoprotein; ALT: Alanine Amino Transferase; BMI: Body Mass Index; EDTA: Ethylene Diamine Tetra Acetic Acid; FLI: Fatty Liver Index; GGT: Gamma-Glutamyl Transferase; HOMA-IR: Homeostasis Model Assessment Insulin Resistance Index; IL-33: Interleukin-33; kcal: Kilo Calories; kD: Kilo Dalton; kg: Kilo Gramms; m2: Square Meter; NAFLD: Non-Alcoholic Fatty Liver Disease; NASH: Non- Alcoholic Steato Hepatitis; WHO: World Health Organization; T2DM: Type 2 Diabetes Mellitus
Introduction
According to the World Health Organization (WHO) overweight and obesity are the fifth leading cause for global deaths [1]. Worldwide obesity has more than doubled over the last thirty years [1]. In 2012, about 65% of the world's population lived in countries where overweight and obesity killed more people than underweight [1].
Obesity comorbidities include multiple diseases, for example type 2 diabetes mellitus (T2DM), coronary heart disease, and dyslipidemia [2]. Another disease strongly correlated with obesity is “Nonalcoholic Fatty Liver Disease” (NAFLD). The prevalence of NAFLD is 10 to 24% in various countries and it increases up to 74% in obese persons [3-6]. In return, prevalence of obesity in patients with NAFLD varied between 30 and 100% [3,7-12]. Moreover, patients with NAFLD show an increased risk of cardiovascular disease [13,14].
NAFLD includes different stages of liver damage such as steatosis, NASH, and advanced fibrosis, which may progress to cirrhosis and end-stage liver disease [3,15]. NAFLD has gained importance over the last years in the donor selection process for liver transplantation and in the post-transplant period given the high recurrence rate of disease [16]. However, prevalence of NAFLD is underestimated as diagnosis is difficult, especially in patients without elevated liver function tests.
NAFLD is usually diagnosed in patients with persisting asymptomatic elevation of aminotransferase levels after exclusion of other causes, or by radiologic signs of fatty liver disease found incidentally [17-19]. Lately, transient elastography has proven to be a well validated method for diagnosis of liver fibrosis of different causes, and can be used for diagnosis and follow-up examinations in NAFLD as well [20]. However, in obese patients, results can still be unreliable [21]. Therefore, the gold standard in terms of sensitivity and specificity for confirming NAFLD remains liver biopsy, although it is an invasive procedure, which can cause complications [19,22].
Up to now, different approaches of non-invasive score-systems or biochemical markers to predict the probability of NAFLD or NASH have been proposed. Two of these are the “Fatty Liver-index” (FLI) and NASH-Score. FLI is an algorithm based on Body-Mass-Index (BMI), waist circumference, triglycerides, and gamma-glutamyltransferase (GGT) while the NASH-Score predicts NASH by total cholesterol, alanine aminotransferase (ALT), AST/ALT ratio (AAR), and GGT [23,24].
Furthermore, fetuin-A has been discussed as a possible biochemical marker for detection of NAFLD. Fetuin-A is a 60 kD plasma protein predominantly synthesized in the liver which is known for inducing insulin resistance by inhibiting the insulin stimulated insulin receptor kinase activity [25] and by mediating the lipid induced insulin resistance as a ligand of toll-like receptor 4 [26].
The fetuin-A gene is located at chromosome 3q27, a susceptibility locus for type 2 diabetes and metabolic syndrome [27,28]. The absence of fetuin-A in fetuin-null mice protects against obesity and insulin resistance associated with aging [29]. High plasma levels of fetuin-A are associated with high carotid intima-media thickness, an early marker of atherosclerosis, and with an increased risk for myocardial infarction as well as ischemic stroke [30,31]. Several studies have shown a significantly higher serum concentration of fetuin-A in moderately obese patients and its reduction after weight loss [4]. Our aim was to examine the role of fetuin-A in severely obese patients before and after non-surgical weight loss and its value in predicting NAFLD correlating it to the aforementioned scores.
Materials And Methods
Protocol and subjects
The study had been approved by the Ethics Committee of the University of Heidelberg. All patients gave written informed consent. The study included 62 patients who participated in a low calorie weight loss program at the University of Heidelberg from July 2008 until March 2010. 24 participants did not complete the program. At the end of the study a total of 38 patients were included for further analysis. The low calorie weight loss program used is a medically lead interdisciplinary ambulant therapy program for obese patients with a BMI of at least 30 kg/m2.
The goal is a significant weight loss and its stabilization by changing nutritional habits and physical activity patterns in a group therapy consisting of 10 to 15 participants as well as doctors, nurses, physical therapists, psychologists, and nutritionists on a regular basis [32]. Divided into four parts, the first week is spent with medical and psychological analysis (T0) while the next 12 weeks comprise an optimized diet with 800 kcal/die combined with sports and behaviour therapy (T1). Part three contains change from formula diet to fatreduced food and finally, the fourth part concentrates on integrating the acquired skills into daily routine over 33 weeks to ensure a long lasting success (T2). Other underlying causes of liver disease than NAFLD were excluded.
Analysis
Data was collected at time points T0 (before weight loss), T1 (after weight loss within 12 weeks), and T2 (after 52 weeks). Clinical data included height, weight, waist circumference, ALT, AST, GGT, total cholesterol, triglycerides, fasting insulin, and blood glucose levels. Routine laboratory tests were performed by the Department of Clinical Chemistry of the University of Heidelberg according to standardized protocols. For fetuin-A analysis, citrated plasma was used, whereas adiponectin levels were measured in EDTA-plasma. Samples were centrifuged and frozen at -20°C. Both fetuin-A and adiponectin concentrations were evaluated using commercially available ELISA kits (Human Fetuin-A ELISA Kit, BioVendor GmbH, Heidelberg, Adiponectin total ELISA Kit, Immundiagnostik AG, Bensheim).
Statistical analysis
Scoring systems used to detect NAFLD were the FLI = (e 0.953 × ln (triglycerides in mg/dl) + 0.139 × BMI in kg/m2 + 0.718 × ln (GGT in U/l) + 0.053 waist circumference in cm – 15.745) / (1 + e 0.953 × ln (triglycerides in mg/dl) + 0.139 × BMI in kg/m2 + 0.718 × ln (GGT in U/l) + 0.053 × waist circumference in cm – 15.745) × 100 [23] and the NASH-Score by gaining one point each for triglycerides ≥ 200 mg/dl, AST/ALT ≤ 1, ALT ≥ 30 IU/l and GGT ≥ 30 IU/ while NASH is probable at ≥ 3 points [24]. The Homeostasis model assessment insulin resistance index (HOMA-IR) was calculated by Insulin [μU/ml] X Glucose [mmol/l] / 22.5 [33]. Statistical analysis was performed using Microsoft™ Office® Excel® 2003 (MicrosoftTM Deutschland GmbH, Munich) and IBMTM SPSS Statistics 19 (IBMTM Deutschland GmbH, Ehningen). Changes from T0 to T1, from T0 to T2, and from T1 to T2 were analysed by Student's t-test. For correlation analysis of specific parameters at T0 and analysis of correlation of changes in parameters at T0 and T2, Pearson’s correlation was used. P-values
Results
In our study, 62 patients undergoing the weight loss program were included for analysis of possible improvements in NAFLD. Twentyfour patients suspended the program early. Clinical characteristics of the 38 remaining patients at T0 are shown in (Table 1) and portray a homogeneous group of 38 adults with 43.4 ± 12.6 years of age and a BMI of 41.5 ± 7.1 kg/m2. First, potential associations between studied parameters for NAFLD at baseline (T0) were analysed. Therefore, we examined the association of FLI and NASH-Score to BMI at T0.
| Gender male / female | 16 / 22 |
| Age [y] | 43.4 ± 12.6 |
| Height [m] | 1.74 ± 0.10 |
| Waist circumference [cm] | 121 ± 15 |
| Arterial hypertension yes / no | 23 / 15 |
| Diabetes mellitus yes / no | May-33 |
| LDL-cholesterol [mg/dl] | 128 ± 32 |
| HDL-cholesterol [mg/dl] | 49 ± 10 |
| Fasting blood glucose [mg/dl] | 111 ± 34 |
Table 1: Patients clinical and laboratory parameters before weight loss at time point 0 (T0). y=years; m=meters; cm=centimeters; mg=milligrams; dl=deciliters.
A significantly positive correlation could be detected between FLI and BMI (p=0.001) but not between NASH-Score and BMI at baseline (p=0.24). Furthermore, we examined whether fetuin-A correlates to BMI at baseline. No association could be detected (p=0.20). We also explored possible associations between fetuin-A and FLI as well as between fetuin-A and NASH-Score at baseline. Again no association could be detected (p=0.71; p=0.28).
Second, we studied whether weight reduction is associated with a change in parameters. From T0 to T2 considerable weight loss (124.7 ± 21.9 kg to 100.3 ± 19.0 kg; p<0.001) and decrease of BMI (41.5 ± 7.1 kg/m2 to 33.5 ± 7.0 kg/m2; p<0.001) were observed. ALT and triglycerides significantly decreased from T0 to T2 (p=0.02; p<0.001). Also, FLI (p<0.001) and NASH-Score (p=0.03) significantly improved from T0 to T2. However, fetuin-A did not change significantly from T0 to T2 (p=0.36). (Table 2) shows the analysed parameters at the different time points. In addition, as parameters for insulin sensitivity, adiponectin significantly increased from T0 to T2 (p<0.001), whereas HOMA-IR significantly decreased (p=0.001).
| Parameters | T0 | p-value | T1 | p-value | T2 | p-value |
|---|---|---|---|---|---|---|
| T0 to T1 | T1 to T2 | T0 to T2 | ||||
| Weight [kg] | 124.7 ± 21.9 | <0.001 | 102.5 ± 19.2 | 0.21 | 100.3 ± 19.0 | <0.001 |
| BMI [kg/m2] | 41.5 ± 7.1 | <0.001 | 34.2 ± 6.9 | 0.19 | 33.5 ± 7.0 | <0.001 |
| Fetuin-A [µg/ml] | 289.2 ± 90.1 | 0.01 | 275.6 ± 95.7 | 0.19 | 284.2 ± 102.5 | 0.36 |
| Adiponectin [µg/ml] | 6.4 ± 2.6 | 0.01 | 7.3 ± 2.4 | <0.001 | 9.3 ± 3.5 | <0.001 |
| ALT [U/l] | 31 ± 11 | 0.44 | 30 ± 14 | 0.13 | 26 ± 11 | 0.02 |
| Triglycerides [mg/dl] | 146 ± 83 | <0.001 | 92 ± 40 | 0.78 | 93 ± 50 | <0.001 |
| Fatty-Liver-Index | 93.8 ± 7.9 | <0.001 | 58.0 ± 29.6 | 0.14 | 57.1 ± 29.0 | <0.001 |
| NASH-Score | 2.2 ± 1.0 | 0.05 | 1.6 ± 0.9 | 1 | 1.6 ± 1.3 | 0.03 |
| HOMA-IR-Index | 5.3 ± 3.7 | <0.001 | 2.6 ± 1.6 | 0.34 | 3.4 ± 5.3 | 0.001 |
Table 2: Patients clinical and laboratory parameters in a longitudinal analysis over the 52 weeks of commercial weight loss program at time point 0 (T0) before weight loss, time point 1 (T1) after dramatic weight loss within 12 weeks and time point 2 (T2) after 52 weeks. BMI=Body mass index; ALT=Alanine aminotransferase; NASH=Nonalcoholic steatohepatitis; HOMA-IR=Homeostasis model assessment insulin resistance; kg=Kilograms; m2=Square meters; μg=Micrograms; ml=Milliliters; mg=Milligrams; dl=Deciliters.
Third, we studied changes in the analyzed parameters during the program. We observed a positive correlation between delta (Δ) FLI (Δ determinants as a term of change in the analysed parameters from T0 to T2) and ΔBMI (p=0.02) but not between ΔNASH-Score and ΔBMI (p=0.88). Next, we explored whether Δfetuin-A correlates to ΔBMI. No correlation could be detected (p=0.28). Finally, we could neither detect an association between Δfetuin-A and ΔFLI (p=0.3) nor between Δfetuin-A and ΔNASH-Score (p=0.82).
Discussion and Conclusion
The weight loss program led to considerable weight reduction of 19.3%, with 81.6% of participants able to reduce weight at least 10% of their baseline weight, being in line with previously published weight loss programs including 8296 patients from 37 German centres [34].
The achieved weight loss led to a reduction in ALT and triglyceride levels at the end of the study comparable to related studies showing a parallel reduction in triglyceride uptake and liver-storage after a 6 week period of calorie restriction [35]. These results suggest a reduction in liver fat content in our patients as well. Furthermore, longitudinal studies show a reduction in FLI and NASH-Scores at the end of the study period suggesting a decrease of NAFLD and NASH in various participants due to the achieved weight loss [23,24].
However, our results show that fetuin-A is not altered after 52 weeks although weight and single values as well as scores of NAFLD suggest that the disease has improved. Several studies have shown a link between serum concentrations of fetuin-A and weight loss. Our results are not in line with previous studies as fetuin-A is only reduced after 12 weeks of formula diet but not at the end of the study although a marked weight loss was achieved. Elevated fetuin-A concentrations in obese patients compared with non-obese healthy control subjects and their reduction after weight loss by gastric bypass surgery was reported [4]. This might be explained by the fact that these studies were performed in less obese subjects. Despite considerable weight loss, subjects of our cohort remained obese at the end of the study due to the highly elevated baseline weight in most cases. Additionally, with respect to the surgical group, further metabolic effects, which might derive from the altered gastrointestinal tract after surgery needs to be discussed. These alterations are not present in a non-surgical approach. Moreover, reduction of fetuin-A in obese patients after non-surgical weight loss in adults and in children has been shown in former studies [36-38]. Comparing these results, the much lower initial weight (102 ± 6 kg) as well as BMI (33.4 ± 1.4 kg/m2) [36] and the fact that subjects were children of about 11 years of age [37] have to be taken into account. A 6-week aerobic exercise training in non-diabetic obese women did not affect serum fetuin-A levels [39].
In our cohort we observed a reduction of fetuin-A only after 12 weeks, which was not present at the end of the study although patients kept their weight stable and no major weight regain was documented. Possibly explaining the significant reduction of fetuin-A after 12 weeks but not after 52 weeks is the fact that weight loss within the first 12 weeks from 124.7 ± 21.9 kg to 102.5 ± 19.2 kg corresponds to an obvious weight reduction after formula diet with 800 kcal/day. Alimentary influence on fetuin-A needs to be discussed, as niacin treatment has been shown to lower serum total- and phosphofetuin-A concentrations in individuals with metabolic syndrome [40]. Niacin levels in our formula diet were lower compared to the aforementioned studies but still 11-20% higher than the recommended minimum daily niacin intake. Therefore, the protein-based, niacin enriched diet might have caused this rather artificial effect on fetuin-A.
Correlation analysis of FLI, NASH-Score, and fetuin-A to BMI confirmed a positive correlation between BMI and FLI and of ΔBMI and ΔFLI at T0 while no correlation was found between NASH-Score and fetuin-A with BMI (Figure 1). Previous studies showing a decrease in fetuin-A after weight loss were not able to show a positive correlation between BMI and fetuin-A either [4,37]. However, the positive correlation between BMI and FLI might be caused by the reduction of BMI itself as one of the main variables in calculating FLI [23]. Our results neither show a positive correlation between FLI and NASH-Score to fetuin-A at T0 nor over time from T0 to T2 supporting the controversial results of former studies [36,41,42]. Few studies were able to show a significant correlation between serum fetuin-A levels to fat accumulation in the liver by magnetic resonance spectroscopy [41] while liver fat content was not associated with serum fetuin-A levels in other studies [36]. Additionally, an association of serum fetuin-A levels with liver fibrosis score index but not with histological NASH-Score was shown [42].
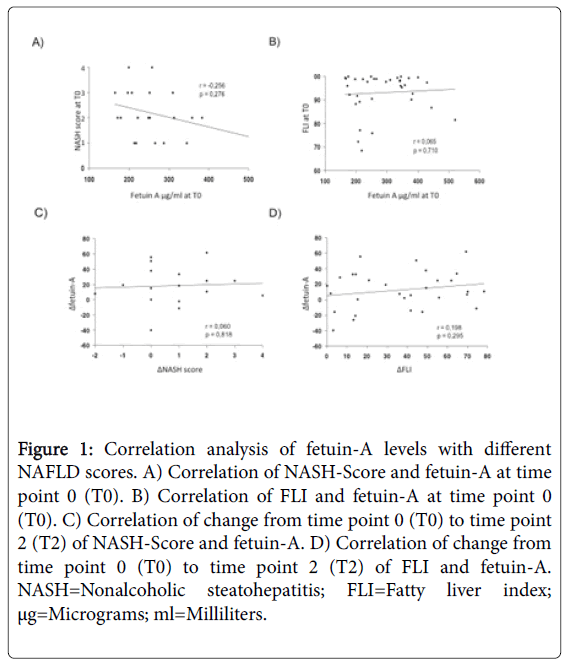
Figure 1: Correlation analysis of fetuin-A levels with different NAFLD scores. A) Correlation of NASH-Score and fetuin-A at time point 0 (T0). B) Correlation of FLI and fetuin-A at time point 0 (T0). C) Correlation of change from time point 0 (T0) to time point 2 (T2) of NASH-Score and fetuin-A. D) Correlation of change from time point 0 (T0) to time point 2 (T2) of FLI and fetuin-A. NASH=Nonalcoholic steatohepatitis; FLI=Fatty liver index; μg=Micrograms; ml=Milliliters.
Although fetuin-A has been shown to mediate lipid induced insulin resistance as an endogenous ligand of toll-like receptor 4, our data confirms this with a significant decrease in HOMA-IR from T0 to T2 independent of fetuin-A reduction, suggesting different mechanisms of insulin resistance [26].
However, our study has several limitations. Firstly, sample size is rather small. Therefore, potential effects of weight loss on fetuin-A levels could have been missed. Our main endpoint was the correlation of fetuin-A levels with FLI during the weight loss program. Since fetuin-A levels only dropped by 1.7% from baseline, it is highly unlikely that a larger sample size would have led to clinically relevant outcomes. To rule out potential confounders on fetuin-A changes, a linear regression analysis correcting for age, gender, and changes in BMI and FLI was performed and showed no significant influence (R2 0.157). Furthermore, we did not confirm the presence of NAFLD or NASH by liver biopsy, magnetic resonance imaging, or even by transient elastography since results may still be unreliable in obese patients [21]. Due to broadly available evidence concerning the correlation of obesity and NAFLD, the first two methods did not seem ethically justified in our patients. Potential alternative markers for liver fibrosis could be IL-33 and its receptor ST2, which were found to be highly expressed in human liver fibrosis [43,44]. However, in the context of liver fibrosis, these markers have only been evaluated by immunhistochemistry in liver biopsies, not from blood [43]. Moreover, when measuring in serum, both IL-33 and ST2 seem to be elevated in rheumatic diseases like ankylosing spondylitis [44,45]. Therefore, these molecules do not seem to be specific for liver fibrosis, which dies not make them feasible as specific routine markers in this context.
In conclusion we observed partially elevated levels of ALT, triglycerides, fetuin-A, FLI, and NASH-Score in extremely obese patients and their reduction after non-surgical weight loss urgently suggesting NAFLD and possibly even NASH in several patients and a partial recovery after weight loss. However, while other markers of NAFLD improved, fetuin-A did not change significantly. Therefore, our results suggest that fetuin-A is neither a suitable marker for NAFLD in extremely obese patients, nor a functional indicator for recovery due to therapeutic interventions.
Acknowledgement
All authors declare no conflicts of interest.
References
- (2000) Obesity: preventing and managing the global epidemic. Report of a WHO consultation. World Health Organ Tech Rep Ser 894. 1-253.
- Angulo P (2002) Nonalcoholic fatty liver disease. N Engl J Med 346: 1221-1231.
- Brix JM, Stingl H, Hollerl F, Schernthaner GH, Kopp HP, et al. (2010) Elevated Fetuin-A concentrations in morbid obesity decrease after dramatic weight loss. J Clin Endocrinol Metab 95: 4877-4881.
- Luyckx FH, Desaive C, Thiry A, Dewe W, Scheen AJ, et al. (1998) Liver abnormalities in severely obese subjects: Effect of drastic weight loss after gastroplasty. Int J Obes Relat Metab Disord 22: 222-226.
- Nomura H, Kashiwagi S, Hayashi J, Kajiyama W, Tani S, et al. (1988) Prevalence of fatty liver in a general population of Okinawa, Japan. Jpn J Med 27: 142-149.
- Adler M, Schaffner F (1979) Fatty liver hepatitis and cirrhosis in obese patients. Am J Med 67: 811-816.
- Bacon BR, Farahvash MJ, Janney CG, Neuschwander-Tetri BA (1994) Nonalcoholic steatohepatitis: An expanded clinical entity. Gastroenterology 107: 1103-1109.
- Itoh S, Yougel T, Kawagoe K (1987) Comparison between nonalcoholic steatohepatitis and alcoholic hepatitis. Am J Gastroenterol 82: 650-654.
- Lee RG (1989) Nonalcoholic steatohepatitis: A study of 49 patients. Hum Pathol 20: 594-598.
- Lonardo A, Bellini M, Tondelli E, Frazzoni M, Grisendi A, et al. (1995) Nonalcoholic steatohepatitis and the "bright liver syndrome": should a recently expanded clinical entity be further expanded? Am J Gastroenterol 90: 2072-2074.
- Powell EE, Cooksley WG, Hanson R, Searle J, Halliday JW, et al. (1990) The natural history of nonalcoholic steatohepatitis: A follow-up study of forty-two patients for up to 21 years. Hepatology 11: 74-80.
- Targher G, Day CP, Bonora E (2010) Risk of cardiovascular disease in patients with nonalcoholic fatty liver disease. N Engl J Med 363: 1341-1350.
- Cleary P, Crofford O, Davis M, Rand L, Siebert C, et al. (1993) The effect of intensive treatment of diabetes on the development and progression of long-term complications in insulin-dependent diabetes mellitus. The Diabetes Control and Complications Trial Research Group. N Engl J Med 329: 977-986.
- Schaffner F, Thaler H (1986) Nonalcoholic fatty liver disease. Prog Liver Dis 8: 283-298.
- Angulo P (2006) Nonalcoholic fatty liver disease and liver transplantation. Liver Transpl 12: 523-534.
- Festi D, Colecchia A, Sacco T, Bondi M, Roda E, et al. (2004) Hepatic steatosis in obese patients: Clinical aspects and prognostic significance. Obes Rev 5: 27-42.
- Saadeh S, Younossi ZM, Remer EM, Gramlich T, Ong JP, et al. (2002) The utility of radiological imaging in nonalcoholic fatty liver disease. Gastroenterology 123: 745-750.
- Sass DA, Chang P, Chopra KB (2005) Nonalcoholic fatty liver disease: A clinical review. Dig Dis Sci 50: 171-180.
- Mikolasevic I, Orlic L, Franjic N, Hauser G, Stimac D, et al. (2016) Transient elastography (FibroScan®) with controlled attenuation parameter in the assessment of liver steatosis and fibrosis in patients with nonalcoholic fatty liver disease - Where do we stand? World J Gastroenterol 22: 7236-7251.
- Chen J, Yin M, Talwalkar JA, Oudry J, Glaser KJ, et al. (2016) diagnostic performance of MR elastography and vibration-controlled transient elastography in the detection of hepatic fibrosis in patients with severe to morbid obesity. Radiology: 160685.
- Van Ness MM, Diehl AM (1989) Is liver biopsy useful in the evaluation of patients with chronically elevated liver enzymes? Ann Intern Med 111: 473-478.
- Bedogni G, Bellentani S, Miglioli L, Masutti F, Passalacqua M, et al. (2006) The Fatty Liver Index: A simple and accurate predictor of hepatic steatosis in the general population. BMC Gastroenterol 6: 33.
- Pulzi FB, Cisternas R, Melo MR, Ribeiro CM, Malheiros CA, et al. (2011) New clinical score to diagnose nonalcoholic steatohepatitis in obese patients. Diabetol Metab Syndr 3: 3.
- Auberger P, Falquerho L, Contreres JO, Pages G, Le Cam G, et al. (1989) Characterization of a natural inhibitor of the insulin receptor tyrosine kinase: cDNA cloning, purification, and anti-mitogenic activity. Cell 58: 631-640.
- Pal D, Dasgupta S, Kundu R, Maitra S, Das G, et al. (2012) Fetuin-A acts as an endogenous ligand of TLR4 to promote lipid-induced insulin resistance. Nat Med 18: 1279-1285.
- Siddiq A, Lepretre F, Hercberg S, Froguel P, Gibson F (2005) A synonymous coding polymorphism in the alpha2-Heremans-schmid glycoprotein gene is associated with type 2 diabetes in French Caucasians. Diabetes 54: 2477-2481.
- Vionnet N, Hani EH, Dupont S, Gallina S, Francke S, et al. (2000) Genomewide search for type 2 diabetes-susceptibility genes in French whites: evidence for a novel susceptibility locus for early-onset diabetes on chromosome 3q27-qter and independent replication of a type 2-diabetes locus on chromosome 1q21-q24. Am J Hum Genet 67: 1470-1480.
- Mathews ST, Rakhade S, Zhou X, Parker GC, Coscina DV, et al. (2006) Fetuin-null mice are protected against obesity and insulin resistance associated with aging. Biochem Biophys Res Commun 350: 437-443.
- Rittig K, Thamer C, Haupt A, Machann J, Peter A, et al. (2009) High plasma fetuin-A is associated with increased carotid intima-media thickness in a middle-aged population. Atherosclerosis 207: 341-342.
- Weikert C, Stefan N, Schulze MB, Pischon T, Berger K, et al. (2008) Plasma fetuin-a levels and the risk of myocardial infarction and ischemic stroke. Circulation 118: 2555-2562.
- Matthews DR, Hosker JP, Rudenski AS, Naylor BA, Treacher DF, et al. (1985) Homeostasis model assessment: Insulin resistance and beta-cell function from fasting plasma glucose and insulin concentrations in man. Diabetologia 28: 412-419.
- Bischoff SC, Damms-Machado A, Betz C, Herpertz S, Legenbauer T, et al. (2012) Multicenter evaluation of an interdisciplinary 52-week weight loss program for obesity with regard to body weight, comorbidities and quality of life: A prospective study. Int J Obes (Lond) 36: 614-624
- Viljanen AP, Iozzo P, Borra R, Kankaanpaa M, Karmi A, et al. (2009) Effect of weight loss on liver free fatty acid uptake and hepatic insulin resistance. J Clin Endocrinol Metab 94: 50-55.
- Chan DC, Watts GF, Gan S, Wong AT, Ooi EM, et al. (2010) Nonalcoholic fatty liver disease as the transducer of hepatic oversecretion of very-low-density lipoprotein-apolipoprotein B-100 in obesity. Arterioscler Thromb Vasc Biol 30: 1043-1050.
- Reinehr T, Roth CL (2008) Fetuin-A and its relation to metabolic syndrome and fatty liver disease in obese children before and after weight loss. J Clin Endocrinol Metab 93: 4479-4485.
- Choi KM, Han KA, Ahn HJ, Lee SY, Hwang SY, et al. (2012) The effects of caloric restriction on fetuin-a and cardiovascular risk factors in rats and humans: a randomized controlled trial. Clin Endocrinol (Oxf) 79: 356-63.
- Schultes B, Frick J, Ernst B, Stefan N, Fritsche A (2010) The effect of 6-weeks of aerobic exercise training on serum fetuin-A levels in non-diabetic obese women. Exp Clin Endocrinol Diabetes 118: 754-756.
- Kaushik SV, Plaisance EP, Kim T, Huang EY, Mahurin AJ, et al. (2009) Extended-release niacin decreases serum fetuin-A concentrations in individuals with metabolic syndrome. Diabetes Metab Res Rev 25: 427-434.
- Stefan N, Hennige AM, Staiger H, Machann J, Schick F, et al. (2006) Alpha2-Heremans-Schmid glycoprotein/fetuin-A is associated with insulin resistance and fat accumulation in the liver in humans. Diabetes Care 29: 853-857.
- Yilmaz Y, Yonal O, Kurt R, Ari F, Oral AY, et al. (2010) Serum fetuin A/alpha2HS-glycoprotein levels in patients with non-alcoholic fatty liver disease: Relation with liver fibrosis. Ann Clin Biochem 47: 549-553.
- Marvie P, Lisbonne M, L Helgoualc'h A, Rauch M, Turlin B, et al. (2010) Interleukin-33 overexpression is associated with liver fibrosis in mice and humans. J Cell Mol Med 14: 1726-1739.
- Ciccone MM, Cortese F, Gesualdo M, Riccardi R, Di Nunzio D, et al. (2013) A novel cardiac bio-marker: ST2: A review. Molecules 18: 15314-15328.
- Li GX, Wang S, Duan ZH, Zeng Z, Pan FM (2013) Serum levels of IL-33 and its receptor ST2 are elevated in patients with ankylosing spondylitis. Scand J Rheumatol 42: 226-231.
Select your language of interest to view the total content in your interested language
Share This Article
Recommended Journals
Open Access Journals
Article Tools
Article Usage
- Total views: 5490
- [From(publication date): 0-2017 - Nov 19, 2025]
- Breakdown by view type
- HTML page views: 4545
- PDF downloads: 945