Research Article Open Access
Full Three-dimensional Finite Element Analysis of the Stress Redistribution in Mine Structural Pillar
M.Sepehri, D.B. Apel* and J. SzymanskiDepartment of Civil and Environmental Engineering, School of Mining & Petroleum Engineering, 3-045 Markin/CNRL Natural Resources Engineering Facility, University of Alberta, Edmonton, AB T6G 2W2, Canada
- *Corresponding Author:
- D.B. Apel
Professor, Department of Civil and Environmental Engineering
School of Mining & Petroleum Engineering
3-045 Markin/CNRL Natural Resources Engineering Facility
Edmonton, AB T6G 2W2, Canada
Tel: 780-492-3379
E-mail: dapel@ualberta.ca
Received Date: November 18, 2013; Accepted Date: December 24, 2013; Published Date: December 31, 2013
Citation: Sepehri M, Apel DB, Szymanski J (2013) Full Three-dimensional Finite Element Analysis of the Stress Redistribution in Mine Structural Pillar. J Powder Metall Min 3: 119. doi: 10.4172/2168-9806.1000119
Copyright: © 2013 Sepehri M, et al. This is an open-access article distributed under the terms of the Creative Commons Attribution License, which permits unrestricted use, distribution, and reproduction in any medium, provided the original author and source are credited.
Visit for more related articles at Journal of Powder Metallurgy & Mining
Abstract
The assessment of the magnitudes and directions of the in situ and mining induced stresses is a vital part of an underground excavation design. In this study, the finite element method is used to develop and establish a full three-dimensional numerical model using Abaqus/Standard (Dassault Systèmes) software to evaluate the stress redistribution and the ground stability in main production level of an underground hard rock mine located in Northern Canada. The in-situ stresses are calculated based on the unit weight of the overburden rock. The ratio of the average horizontal stress to vertical stress is assumed to be 1.5. This value is selected based on the average stress ratios obtained from the neighboring mines. The behavior of the rock is assumed to be elasto-plastic. To verify and calibrate the numerical model, the obtained displacements values are compared with the values obtained from the ground movement monitors installed in this area. Based on the results of the numerical model, it was concluded that benching of the floor in the 7340E access drift by an additional 2m would increase the zones of failure in the studied pillar. Moreover, the zones of failure in the adjacent tunnels which were inside of the zone of influence of the 7340E access drift would be increased dramatically.
Keywords
Rock mechanics; Numerical modelling; Finite element method; Induced stress; Underground design; Stress redistribution
Introduction
The stress distribution in rock masses is a great concern for the rock mechanics engineer. Prediction of the magnitudes and directions of the in situ and induced stresses is a vital part of the underground excavation design process. These calculations can be used to identify the areas in which the strength of the rock is exceeded. Moreover, they can be used to design the support system for these failure areas [1]. There are three major approaches commonly used for evaluation of stability of underground excavations: analytical, empirical and numerical methods. The validation of the results of these methods can be achieved by comparing them with the results obtained from ground movement monitors. During the past three decades, numerical methods have become popular, due to the rapid development of both software and advancements in computer technology. The suitability of these methods for analysis and design of very complex problems is another reason why they are that popular. Many conventional methods (empirical and analytical methods) in rock mechanics used for evaluation of excavation stability are applicable only for excavations with simple shapes and for cases which are similar to the ones for which they were developed; however, there are many problems for which no past experience is available [2]. In these cases, numerical methods are valuable tools for the assessment of the underground stability.
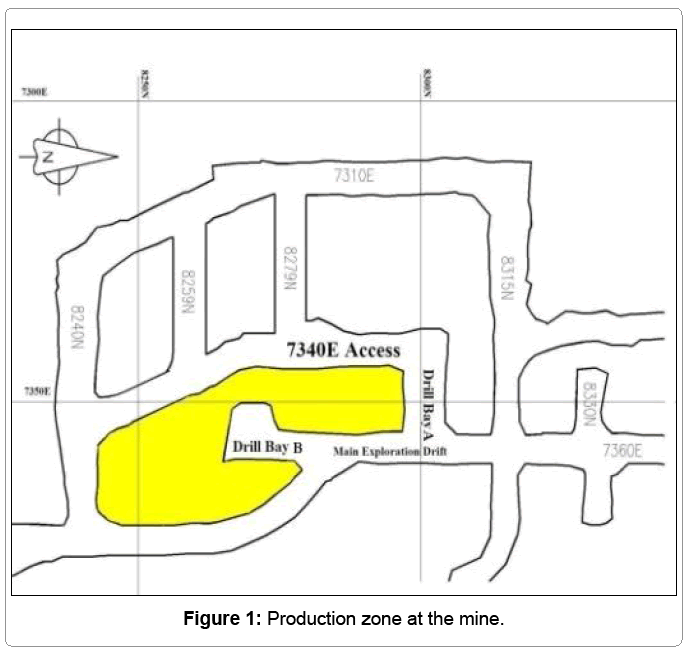
The main objective of this paper is to illustrate how a threedimensional finite element model can be used to assist in planning of the underground development. In this paper the stress redistribution and the ground stability of the pillar between the drill bay B and 7340E access drift (Figure 1) were modeled using two following scenarios:
• First, the current excavation geometry and current stress conditions were recreated
• Second, the geometry of the 7340E Access drift was altered trying to simulate the planned floor benching by additional 2 meters depth.
To develop the three dimensional numerical model, a finite element program called “Abaqus” [3] was used. The three dimensional model was selected to better simulate the mine induced stresses around very complex excavations at the production zone shown in Figure 1.The Finite Element Method (FEM) is a well-recognized numerical method which can be used for simulation of mine induced stresses around underground excavations. This method can deal with the complex geometry of the excavations, nonlinear behavior of rocks, and heterogeneity of the rock [4]. Furthermore, Abaqus is a powerful general-purpose finite element simulation program which can solve a wide range of linear and nonlinear problems and it also has very good graphics which increases its ability as a visualization tool.
In general, the model which is trying to predict the behavior of the rock mass at underground mine is data limited. The reason for this is the nature of rock. According to Hudson and Harrison [5], the nature of rock which usually engineers have to deal with is a Discontinuous, Inhomogeneous, Anisotropic, Non-Elastic (DIANE) rock. Furthermore, due to the irregularity of the rock mass, it is difficult to predict the absolute behavior of the rock. Consequently, most numerical models need to make assumptions about many parameters and most of the times due to the complexity of the local geology need to simplify assumptions about some parameters. This can have a major impact on the accuracy and reliability of the numerical models. The model, which was created for this study, was calibrated and verified based on both visual inspection and the actual ground movement monitoring data which was done previously by [6] at this area.
Geometrical Model
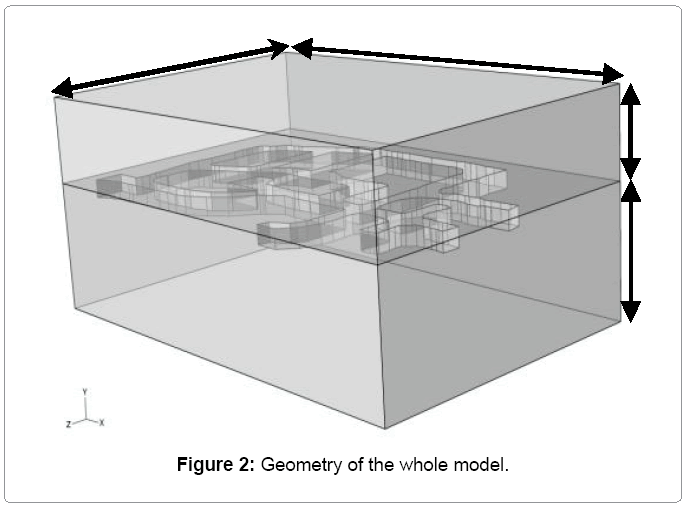
The following section illustrates a case study when numerical modeling was performed to determine whether or not the benching of a floor in the 7340 E access drift at the production area (Figure 1) was possible. The benching of this floor is necessary to create a passage for the operation equipment. The full three dimensional model is shown in Figure 2.
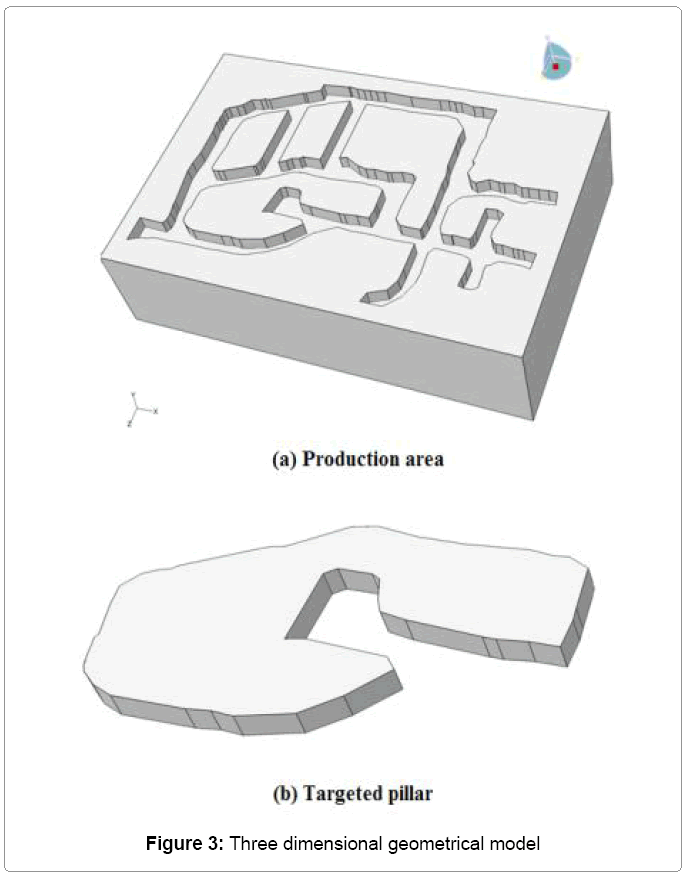
From Figure 2, the length, width and height of the model are 127 m, 81.5 m, and 50 m respectively. Geometry of the production area, including the targeted pillar and adjacent drifts, are shown in Figure 3. The height of all drifts are assumed to be 4.1 m for scenario before the floor benching. In the second scenario, the height of 7340E acces drift is increased by aditional 2 m. In total the height of this drift will be 6.1m. To simplify the model, the cross sections of all tunnels are assumed to be rectangular whereas the actual geometry of the majority of drifts varied from rectangular to arch shape. The numerical modeling was originally performed using Examine 3D which is a boundary element software which was developed by Rock Sciences of Toronto and more recently performed using the 3D finite element method software ABAQUS by Dassault Systèmes Simulia Corp [3]. This paper describes results of the more recent modeling using the ABAQUS software.
Numerical Model
The full three-dimensional finite element model of the targeted pillar is shown in Figure 4. The finite element mesh consists of 408,876 four-node linear tetrahedral elements (C3D4) with 74,046 nodes. In FEM, to insure that the results of the model are adequate, using an appropriate refined mesh is one of the most important parameters which should be considered. For this task, a mesh convergence study was performed to find a sufficient mesh size.
Basically, the influences of the mesh density on two particular results from the model were considered:
• The displacement at two locations, on the targeted pillar, where the Multi-Point Borehole Extensometers (MPBXs) were installed in reality. The results from the model were compared with the ground movement’s data recorded by these MPBXs.
• The stress redistribution on the targeted pillar, based on the visual observation and photos were available from different areas of the mine.
Input Data
In-situ stress components
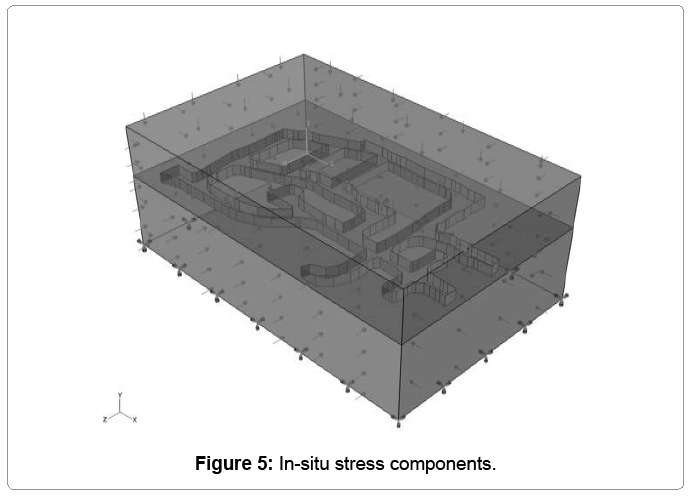
The in-situ state of stresses in the mine can be approximately calculated with equations 1 and 2. These components are shown in Figure 5.
σv =γ.H = 0.027 × 530 =14.31MPa (1)
σx =σz = K.σv =1.5×14.31 = 21.465MPa (2)
Where σv is the vertical stress, γ is the unit weight of the rock and H is depth. The average unit weight of the rock was assumed to be  . The depth of the production area in this model is 530m below the surface.
The σx , is the horizontal stress along the horizontal axis of the 7340E access drift and main exploration drift. The σz , is the horizontal stress perpendicular to the horizontal axis of the mentioned drifts. The dip of these horizontal in-situ stress components was assumed to be zero.
K is the ratio of the average horizontal stress to vertical stress which has been assumed to be between 1.5 and 1.0. The initial assumption of this value was based on the average stress ratios obtained from mines in northern Canada nearby this mine. After several numerical analyses, done previously by the mine engineers, it was decided to use the ratio of 1.5 for all the stress analyses at this mine [6].
Constitutive models and the rock mass properties
The behavior of the rock mass for this model is assumed to be governed by an elasto-plastic constitutive relation based on the elasticity theory and the Mohr-Coulomb plasticity criterion. The rock properties of the production area were obtained from laboratory tests conducted on intact rock samples from this area. These values are shown in table 1 below.
| UCS(MPa) | Young’s Modulus E(MPa) | Poisson’s ratio ν |
|---|---|---|
| 30-60 | 3000-17000 | 0.2 |
Table 1: The lab tests results for the rock properties.
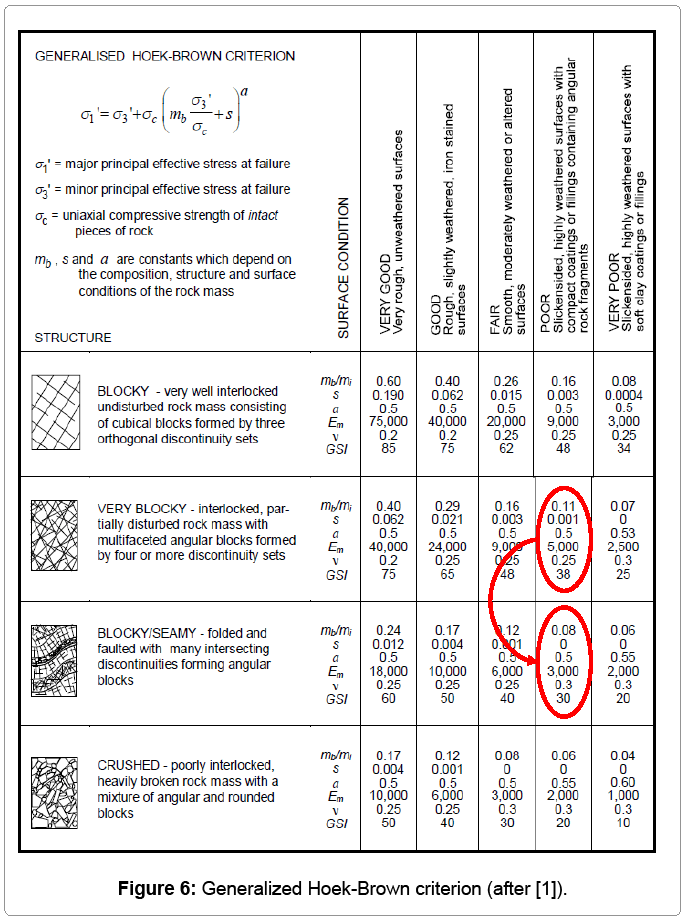
The model was first run using these values. It was found that the displacement values of the model did not correspond to the values obtained from the ground movement monitor instruments installed in this area. Consequently, it was decided to select the rock mass properties from the Hoek-Brown table for estimation of the geological strength index (GSI) [1] shown in Figure 6. Furthermore, by using this table, the rock structure for the production area was rated to be “Blocky/ SEAMY-folded and faulted with many intersecting discontinuities forming angular blocks” and the surface condition was assumed to be “POOR- Slickensided, highly weathered surfaces with compact coatings” [6]. According to the Hoek-Brown table,the GSI for this area was rated to be 30 (RMR about 35).
The mapping of the ground conditions at this mine was done using the 1980 version of Bieniawski’s Rock Mass Rating (RMR) system. Initially the value of GSI was estimated to be 38, since the structure was Very Blocky with Slickensided Joints surfaces. However, the first run of the model did not show ground displacement values which would correspond to the ground movements which were measured and observed in-situ. Therefore, the model was calibrated (Figure 6) and the chosen Hoek-Brown parameters for this area are shown in table 2.
 |
s | a | E (MPa) | ν |
|---|---|---|---|---|
| 0.08 | 0 | 0.5 | 3000 | 0.3 |
Table 2: Hoek- Brown Parameters.
Since the Abaqus software does not use the Hoek-Brown criterion, it was necessary to estimate an equivalent set of cohesion and friction angle parameters for these values. This issue is discussed in the next section.
Converting hoek-brown to mohr-coulomb parameters
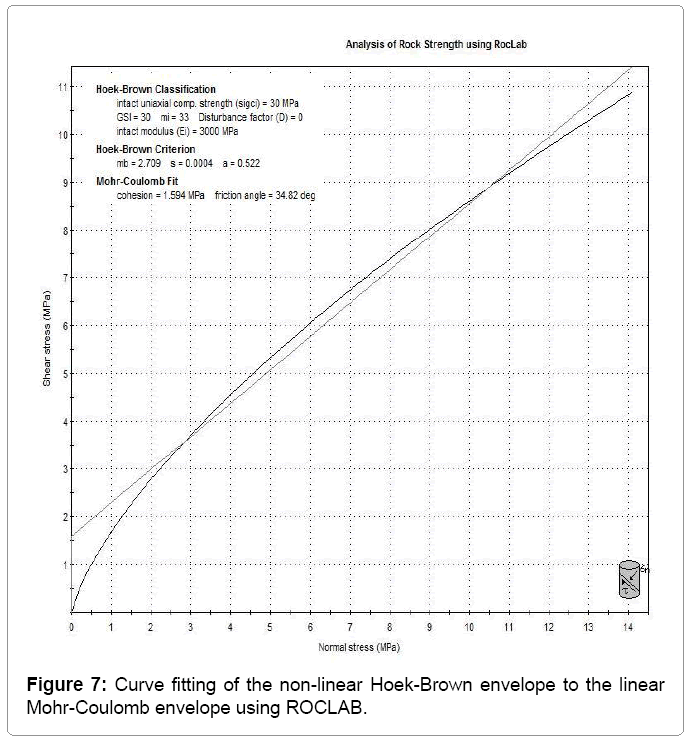
Since, the Mohr-Coulomb failure criterion was chosen for the Abaqus model, the Hoek-Brown Parameters were converted to the parameters required to perform the modeling using theMohr-Coulomb failure criterion. For this aim, the RocLab software from the Rocscience software package [7] was used. The calculation in this software is based on the latest version of the generalized Hoek-Brown criterion [8]. The results are shown in Table 3 and Figure 7. In conclusion, the main elasto-plastic material properties, which were used in Abaqus, are shown in Table 4.
| Cohesive Strength (MPa) | Friction Angle (o) |
|---|---|
| 1.59 | 34.82 |
Table 3: The Mohr-Coulomb parameters.
| Unit weight of the rock (MN/m3) | Young’s Modulus (MPa) | Poisson’s Ratio | Cohesion Strength (MPa) | Friction Angle (o) | Dilation Angle (o) |
|---|---|---|---|---|---|
| 0.027 | 3000 | 0.3 | 1.59 | 34.82 | 0 |
Table 4: Curve fitting of the non-linear Hoek-Brown envelope to the linear Mohr- Coulomb envelope using RocLab
Results
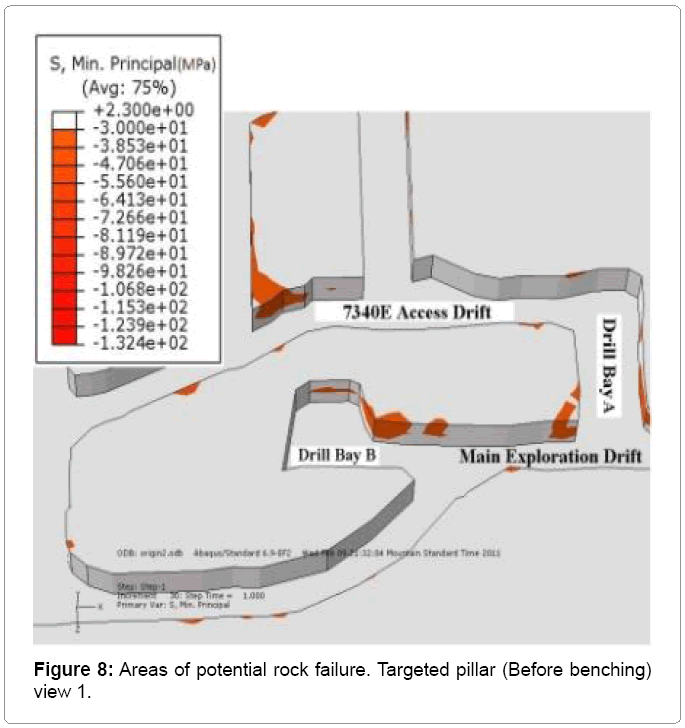
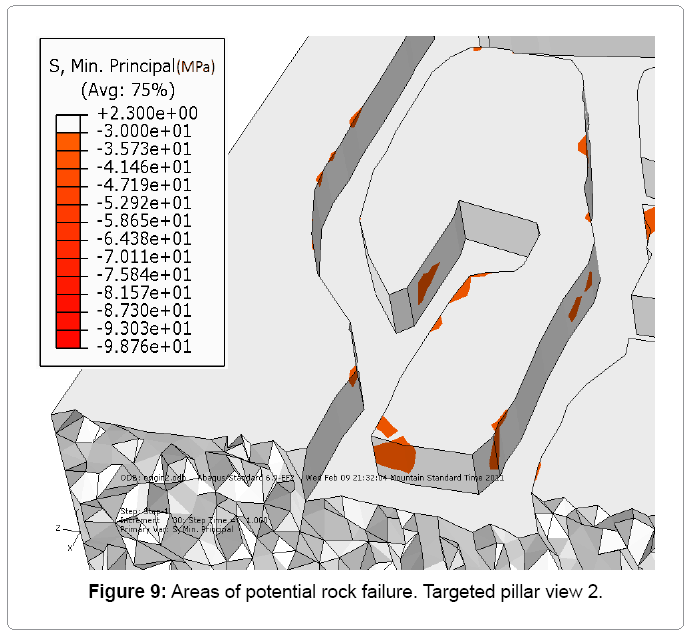
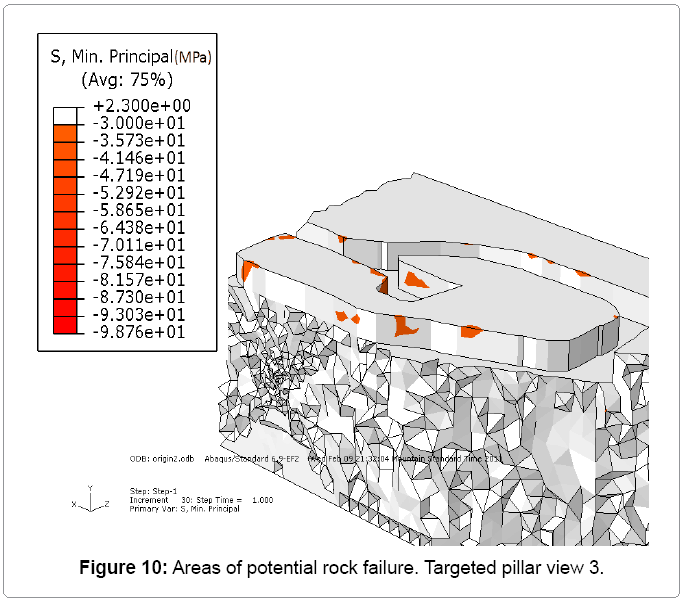
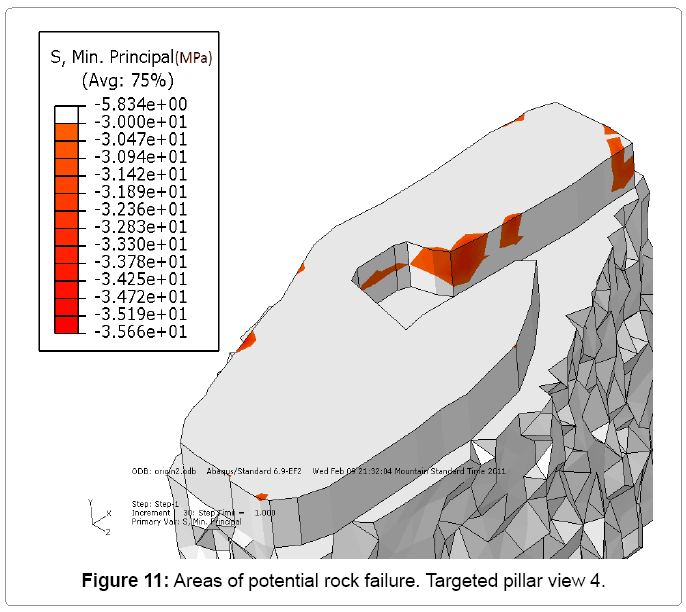
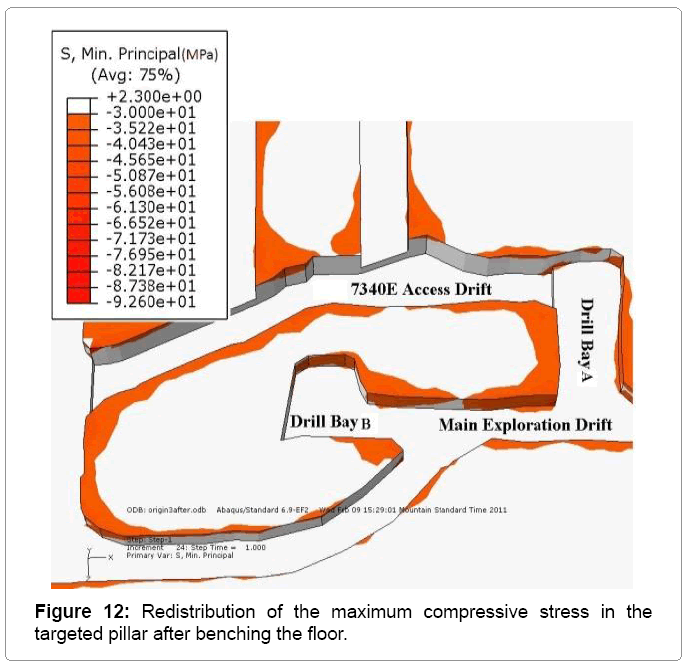
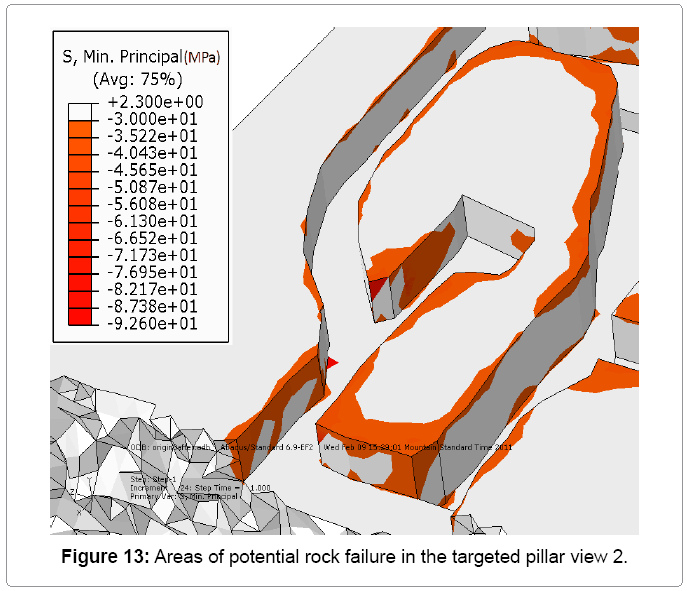
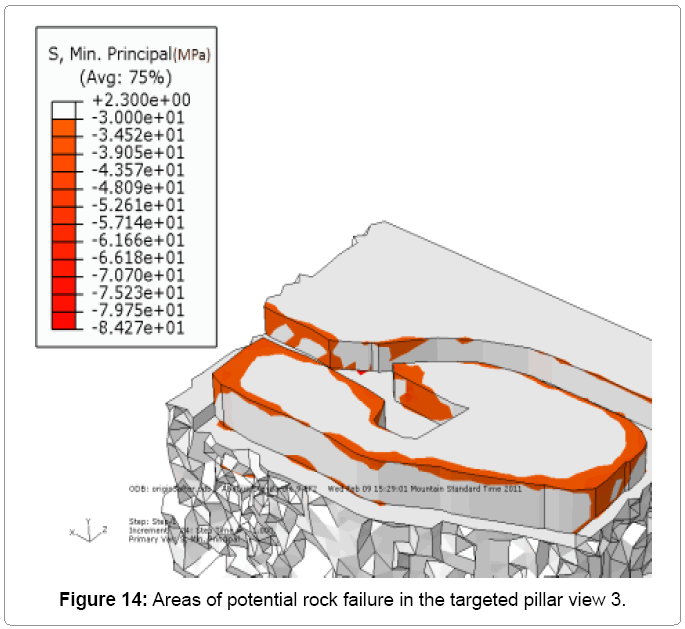
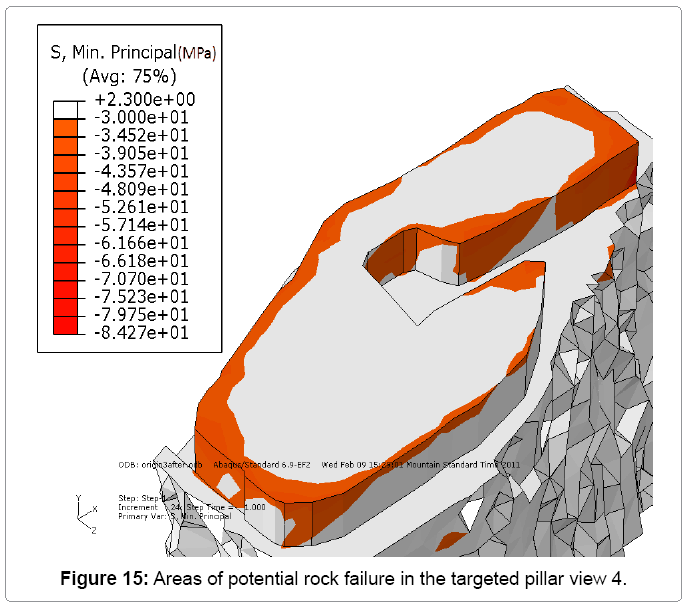
Before presenting the results, it should be noted that some conventions used in the Abaqus software differ from those generally used in rock mechanics. For example, the compressive stress in Abaqus is negative and the tensile stress is positive. Consequently, the minimum principal stress in Abaqus equals to the maximum compressive stress. The following results are based on the minimum principal stress (Or maximum compressive stress). Besides, since the maximum compressive strength of the rock is 30MPa, only the area with maximum compressive stress greater than 30MPa is shown.
Results for before benching
The results for the first scenario are shown in Figures 8 to 11. As shown, some areas of potential rock failure can be identified, between drill bay B, 7340 access drift and drill bay A. Load applied in these areas has reached the maximum compressive strength of the rock which 0MPa. However, the most of the pillar is intact[9,10].
Results for after benching
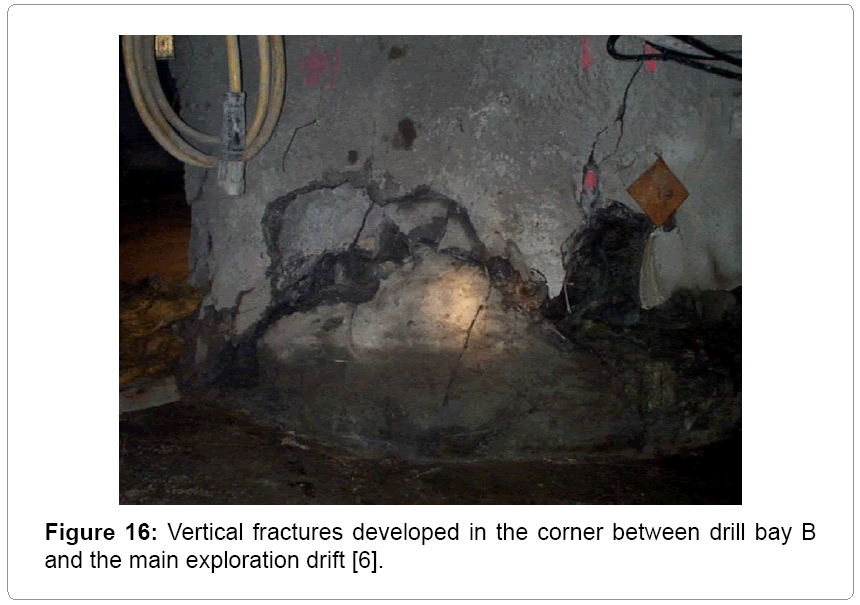
After benching the floor in the 7340E access drift by an additional 2m, the model predicted a large increase in the zones of failure in the targeted pillar, particularly in the corner between drill bay B and the main exploration drift. Figures 12 to 15 showed the redistribution of the stress for the targeted pillar after benching the floor. As shown in Figure 12 the zones of failure in the adjacent drifts were increased dramatically. These drifts were in the zone of influence of the 7340E access drift.
Verification of the results
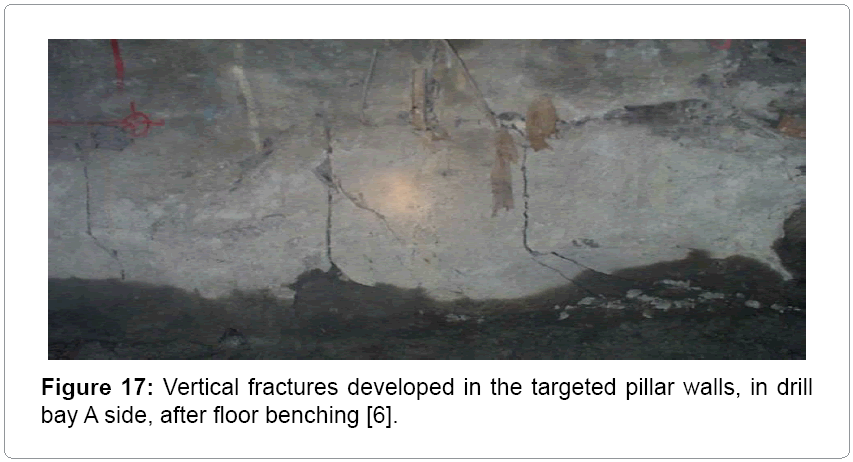
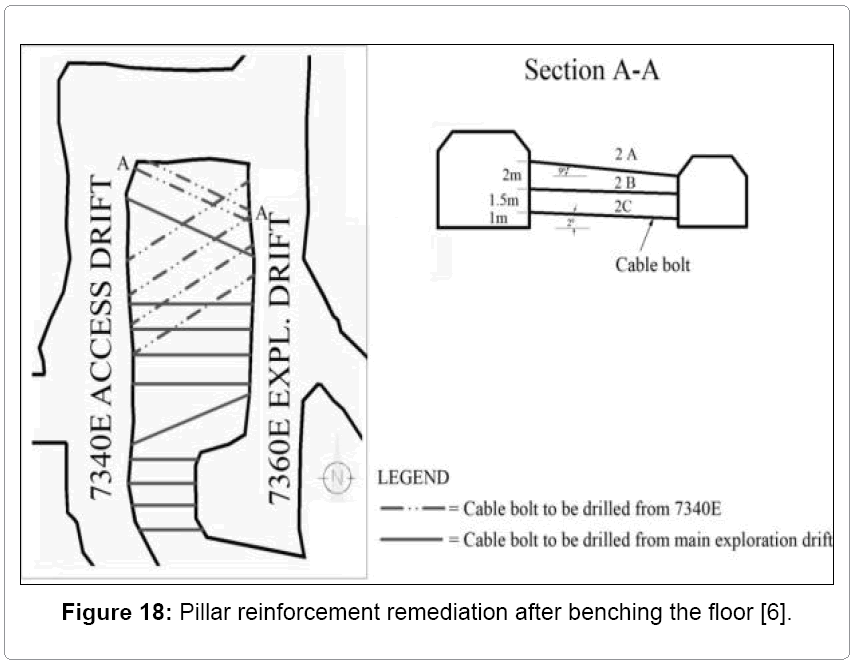
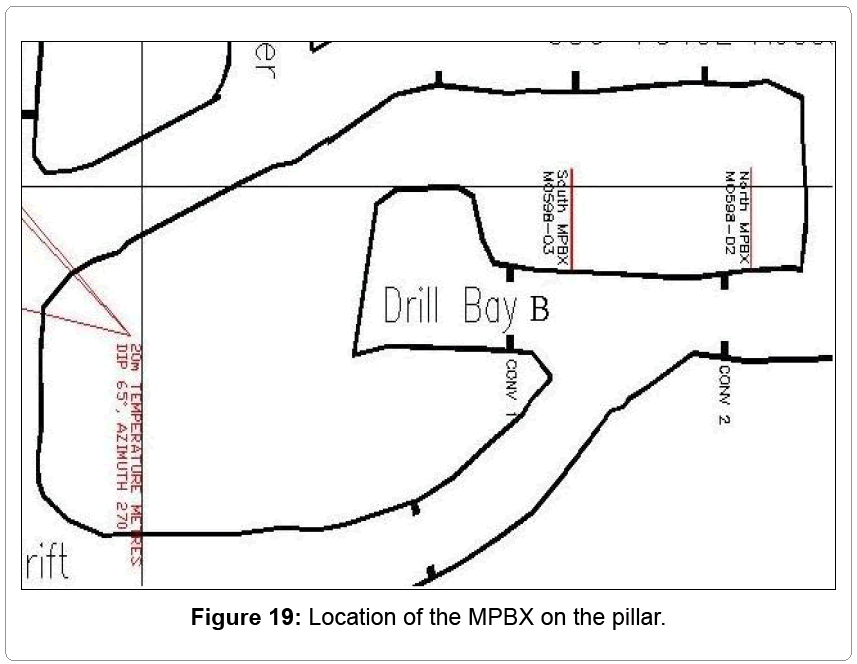
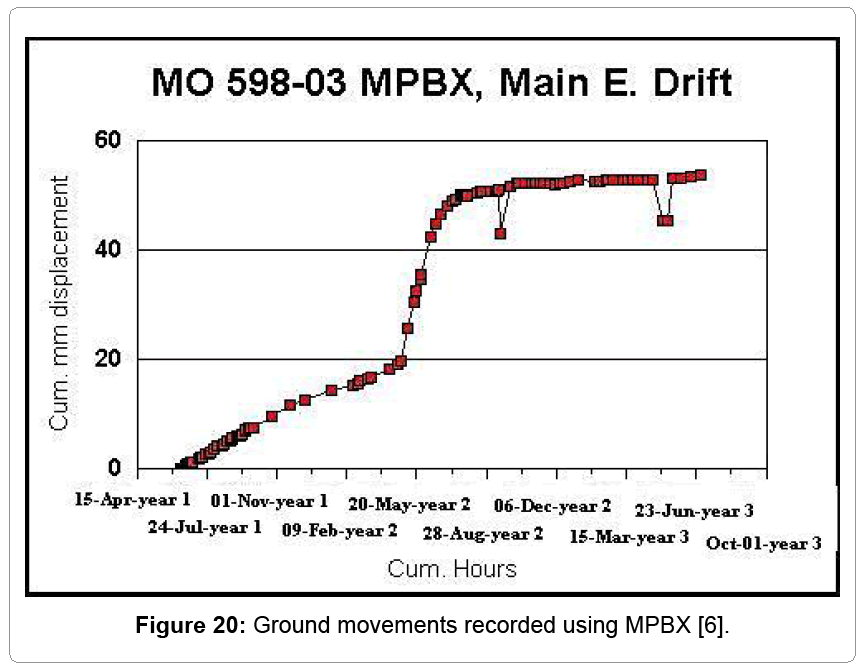
The model results are closely matched by the visual observation of the rock mass in the production area (Figures 16-18). The displacement value obtained from the model for before benching is 23mm. This value corresponds to the value obtained from the ground movement monitors installed in the pillar. The location of the multiple point borehole extensometers (MPBXs) is shown in Figures 19. The ground movement data recorded using south MPBX is shown in Figure 20. As it can be seen in Figure 20, after the decision was made and the benching of the 7340E access drift was started, the rate of ground movements was significantly increased. The final displacement value obtained from the model for after benching is 102 mm. Since the rock reinforcement system does not included in the model, this value is different from the value obtained from the MPBX.
Pillar reinforcement
The noticeable failures of the targeted pillar forced the mine to carry out a rock reinforcement program [6], which included:
• Installing cable bolts in the targeted pillar as shown in Figure 18.
• Employing passive rock support systems in the 7340E access drift
• Backfilling of the drill bay B
Conclusion
The main purpose of numerical modeling at the underground mines, which is also the ultimate purpose of this paper, is to predict the future behavior of the rock mass after the rock is excavated. The following are the main findings of this paper:
a) The results from numerical modeling predicted failure of the pillar between 7340E and 7360E. This prediction was later verified when the mine commenced with the floor benching.
b) After benching the floor in the 7340E access drift by an additional 2m, the zones of failure in the targeted pillar were significantly increased. To prevent further failure of the monitored pillar a rock reinforcement system (Figure18) consisting of fully grouted rockbolts, cable was designed and installed at the following zones:
• The corner between drill bay B and the main exploration drift was reinforced with 6 ft fully grouted rock bolts and 6 inch layer of steel mesh reinforced shotcrete.
• The drill bay B was backfiled with the cement “stabilized” rockfill (CRF)
• In the targeted pillar’s wall in drill bay Adrift
• Fully grouted steel cables were installed in the holes drilled through the monitored pillar.
• The 7340 E Access Drift was reinforced with steel girders which were covered with 6 inches of shotcrete
Throughout this study it was found that the numerical modeling is highly sensitive to the input data. After input data, the meshing has a serious influence on the final results, especially, the type and size of the element. Consequently, a mesh convergence study should be established to select the appropriate meshing size and elements.
References
- Hoek E, Kaiser PK, Bawden WF (1995) Support of Underground Excavation in Hard Rock. Taylor & Francis, Balkema.
- Pande GN, Beer G, Williams JR (1990) Numerical Methods in Rock Mechanics. John Wiley & Sons Ltd, England.
- ABAQUS/Standard User’s Manual Dassault Systemes Simulia Corp, 2010.
- Liu HY, Small JC, Carter JP (2008) Full 3D modeling for effects of tunneling on existing support systems in the Sydney region. Tunneling and Underground Space Technology 23: 399-420.
- Hudson JA, Harrison JP (1997) Engineering rock mechanics: An introduction to the principles, Imperial College of Science, Technology and Medicine, University of London, UK, Pergamon. Elsevier Science Ltd.
- Apel DB (2005) Design and development of underground mine with the assistance of rock mechanics software. SME Annual Transactions. SME Journal 61: 83-88.
- ROCLAB User’s Manual, Rocscience INC, 2002.
- Hoek E, Carranza-Torres C, Corkum B (2002) Hoek-Brown failure criterion-2002 Edition. Proc NARMS-TAC Conference, TORONTO 1: 267-273.
- Sepehri MA (2011) Prediction of Pillar Behavior at Underground Mine Using Numerical Modeling Methods, Master of Science thesis, University of Alberta.
- Examine 3D User’s Manual, Version 4.0, Rocscience Inc, Toronto, Canada, 2003.
Relevant Topics
- Additive Manufacturing
- Coal Mining
- Colloid Chemistry
- Composite Materials Fabrication
- Compressive Strength
- Extractive Metallurgy
- Fracture Toughness
- Geological Materials
- Hydrometallurgy
- Industrial Engineering
- Materials Chemistry
- Materials Processing and Manufacturing
- Metal Casting Technology
- Metallic Materials
- Metallurgical Engineering
- Metallurgy
- Mineral Processing
- Nanomaterial
- Resource Extraction
- Rock Mechanics
- Surface Mining
Recommended Journals
Article Tools
Article Usage
- Total views: 17044
- [From(publication date):
October-2014 - Aug 17, 2025] - Breakdown by view type
- HTML page views : 12153
- PDF downloads : 4891
