Review Article Open Access
Fundamentals and Applications of Impedimetric and Redox Capacitive Biosensors
Adriano Santos1, Jason J Davis2* and Paulo R Bueno1*
1Department of Physical Chemistry, Chemistry Institute, São Paulo State University (Unesp), São Paulo, Brazil
2Department of Chemistry, University of Oxford, Oxford, United Kingdom
- *Corresponding Author:
- Paulo R Bueno
Nanobionics research group, Department of Physical Chemistry
Chemistry Institute, São Paulo State University (Unesp)
55 Prof. Francisco Degni Street, ZIP Code 14800-060, Araraquara
São Paulo, Brazil
Tel: +55 16 3301 9642
Fax: +55 16 3322 2308
E-mail:prbueno@iq.unesp.br
Jason J Davis
Department of Chemistry, University of Oxford
South Parks Road, Oxford, OX1 3QX, UK
E-mail: jason.davis@chem.ox.ac.uk
Received Date: May 12, 2014; Accepted Date: May 29, 2014; Published Date: June 02, 2014
Citation:Santos A, Davis JJ, Bueno PR (2014) Fundamentals and Applications of Impedimetric and Redox Capacitive Biosensors. J Anal Bioanal Tech S7:016.doi: 10.4172/2155-9872.S7-016
Copyright: © 2014 Santos A, et al. This is an open-access article distributed under the terms of the Creative Commons Attribution License, which permits unrestricted use, distribution, and reproduction in any medium, provided the original author and source are credited.
Visit for more related articles at Journal of Analytical & Bioanalytical Techniques
Abstract
Electroanalyses have brought a huge amount to our understanding of interfaces generally. When applied to surfaces which have been specifically engineered so as to recruit targets from an analytical solution, potent sensors can be derived. These may be based on a multitude of different analytical methods all typified by specific requirements and surface configurations. This short review examines the application of amperometric and impedimetric methods to the detection of biomarkers of clinical relevance. Basic principles are introduced with examples at both planar and “nanofunctionalised” interfaces comprising immobilized antibodies/antigens and oligonucleotide receptors. A particular focus is made of new developments in impedance and impedance derived capacitance spectroscopy.
Keywords
Biosensor; Electrochemical impedance spectroscopy; Capacitance spectroscopy; Biomarker; Redox capacitive biosensor
Introduction
Biomarkers can be considered to be chemical or biological molecules present in tissues, blood, or other fluids at quantifiable levels that are relatable to physiological status. In their most practical form they may be used as indicators of trauma, infection, and disease onset or disease progression [1-3]. For this reason alone their reliable assay is of truly enormous healthcare benefit. There is currently a huge amount of interest in the possibility of protein or nucleic acid markers reliably reporting on disease onset many years before patients become symptomatic. An ability to aggressively intervene in disease progression early would be utterly game-changing in the combat of, for example, neurodegeneration and cancer. Although a diverse range of markers have been studied, including glycoproteins (specially for cancer detection [4]) and monocytes [5,6] (associated to bacterial infection), this review will be focused to a consideration of nucleic acid and protein markers specifically.
A wide range of strategies exist that enable the quantified assay of proteins or nucleic acids. These are, broadly speaking (though also see QCM and radioimmunoassays), [7-11] divisible into methods which are optical (Colorimetric, Surface Plasmon Resonance, Optical Microarray, ELISA, Interferometry, etc.) and those which are electrical (amperometric, impedimetric, capacitative, transistor based). If one ignores the very few biomarkers that natively possess well-defined and resolvable optical fingerprints, the majority of optical approaches require either target labeling, the utilization of an appropriate “sandwich” format or rely on specific induced change in excitable surface plasmons [12-15].
A quartz crystal microbalance (QCM) presents a piezoelectric technique able to detect nanogram levels of adsorbate [16,17] and have been applied to the detection of protein [18,19], nucleic acids [20] and biomolecular association constants [21-23]. Although natively label free, methodologies have been reported in which sensitivity has been boosted through nanoparticle modification of a secondary antibody binding agent [7,18]. Surface plasmon resonance methods operate through the sensitive detection of target induced change in refractive index at an appropriately modified sensor surface and, broadly speaking, spans the same general capabilities as presented by QCM [12,13,18,24].
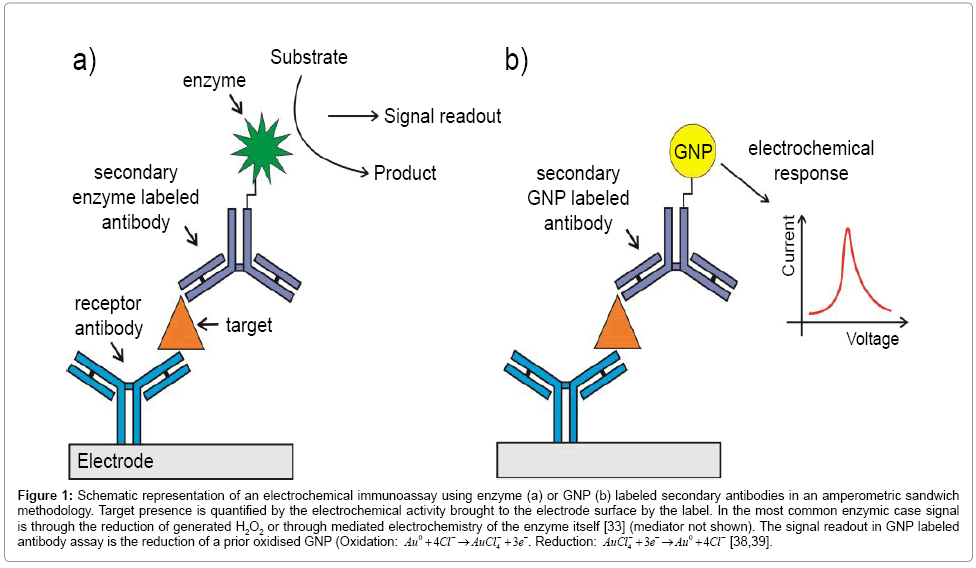
Electrical methods commonly possess a high innate sensitivity and are readily scaleable at low cost. A large number of amperometric approaches to biomarker detection have been detailed in recent years – these include the utilization of “sandwich” assays in which transducing signal is provided by appropriately labeled secondary antibodies or the use of redox tagged capture nucleic acid aptamers [25,26]. The former approach requires two antibodies per target (and, hence, two well-behaved antibody-target binding events per target), two reproducibly exposed non overlapping target epitopes and the use of secondary antibodies that are redox tagged (e.g. nanoparticles [27-31], quantum dots [32]), labeled with enzymes [26,33] or anchored, in multiples to particle surfaces, that generate a redox quantifiable output (Figure 1a). Despite these demands, this approach has been successfully demonstrated in a large number of case studies. For example, Dai and colleagues [33] have reported an electrochemical immunosensor to detect alpha fetoprotein (AFP), an important marker of testicular cancer [34]. The researchers used a prussian blue modified hydroxyapatite or HRP labelled secondary antibodies as signal generators with low limit of detection (LOD) (9 pg/mL). Yao and coworkers have used nanoparticle tethered secondary antibody HRP labels within an amperometric assay quantifying immunoglobulin G [35]. In this configuration, the researchers immobilized anti-IgG above a carbon glassy electrode functionalized with gold nanoparticles (GNPs) and HRP labeled secondary antibodies confined to Au/SiO2 nanoparticles. In this manner, multiple copies of peroxide generating HRP are brought to the interface per capture event (and signal amplification increased so that sub ng/ml levels target are quantifiable) [35].
Figure 1: Schematic representation of an electrochemical immunoassay using enzyme (a) or GNP (b) labeled secondary antibodies in an amperometric sandwich methodology. Target presence is quantified by the electrochemical activity brought to the electrode surface by the label. In the most common enzymic case signal is through the reduction of generated H2O2 or through mediated electrochemistry of the enzyme itself [33] (mediator not shown). The signal readout in GNP labeled antibody assay is the reduction of a prior oxidised GNP (Oxidation: Au0 +4Cl−4→AuCl−4 + 3e−. Reduction: AuCl−4 + 3e−→Au0 +4Cl− [38,39].
In addition to their use in increasing supporting electrode surface area, [27,30,36,37] GNPs have also been employed in tagging antibodies and aptamers in sandwich assays [30,36] where they are directly responsible for electrochemical signal generation (Figure 1b). Using this methodology, Ho et al. [38] for example, reported an immunosensor to detect a lung cancer biomarker, α-Enolase (ENO1), with a LOD of 2.38 pg/mL. In this case, the receptor antibody was physically adsorbed on a polyethylene glycol modified electrode. After the immunoreaction, antibody tagged GNP adducts facilitated target quantification across a range of 0.001-10 ng/mL [38]. An immunosensor to detect human IgG in a linear range of 10-500 ng/mL was designed by Chen et al. [39] The receptor antibody was adsorbed to a carbon paste electrode and, after antibody – target interaction, colloidal gold particle labeled antibody was used to detect indirectly the target with a limit of detection of 4 ng/mL [39].
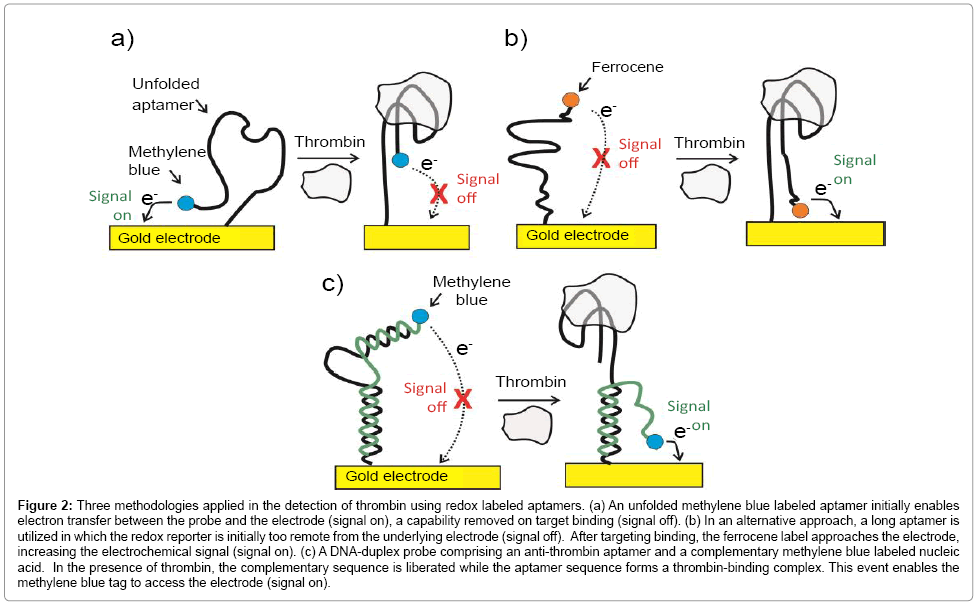
The use of redox labeled capture aptamers, in which an electrochemical signal is modulated by a large conformational change associated to a target capture, has been demonstrated in the quantification of both nucleic acids and proteins under specific controllable conditions [25,40,41]. For example, Xiao et al. have reported a sensor to quantify thrombin in blood serum in a linear nanomolar range [42] using methylene blue labeled aptamers on gold electrodes (Figure 2a). In what is now a common format, the methylene blue redox communication with the underlying electrode changes dramatically as thrombin target binds [42]. In most cases, however, communication decreases as the aptamer-target association “rigidifies” the former (turning off the flexibility required in order to bring the redox unit to the electrode surface). This “signal turn off” approach can potentially suffer from “false negatives” (i.e. where signal is lost through processes other than specific target recognition events). To overcome this problem, other approaches have been developed [25,43]. In one of them, ferrocene labeled thiolated aptamers were immobilized on gold surface in a manner such that the ferrocene probe was unable to access the solid surface below [44,45]. The conformational changes associated with target binding this time brings the redox reporter into closer approach to the electrode, yielding a positive amperometric readout signal (Figure 2b). In a related methodology, DNA-duplex probes comprising an anti-thrombin aptamer and a complementary methylene blue labeled nucleic acid component have been used (Figure 2c). In the presence of thrombin, the complementary sequence is liberated while the aptamer sequence binds the target. This event brought the methylene blue tag to the proximity of the electrode surface, generates a “turn on” signal and enables target quantification down to low nanomolar levels [46].
Figure 2: Three methodologies applied in the detection of thrombin using redox labeled aptamers. (a) An unfolded methylene blue labeled aptamer initially enables electron transfer between the probe and the electrode (signal on), a capability removed on target binding (signal off). (b) In an alternative approach, a long aptamer is utilized in which the redox reporter is initially too remote from the underlying electrode (signal off). After targeting binding, the ferrocene label approaches the electrode, increasing the electrochemical signal (signal on). (c) A DNA-duplex probe comprising an anti-thrombin aptamer and a complementary methylene blue labeled nucleic acid. In the presence of thrombin, the complementary sequence is liberated while the aptamer sequence forms a thrombin-binding complex. This event enables the methylene blue tag to access the electrode (signal on).
Although methods in which target analyte or secondary antibody are labeled are diverse, and can undoubtedly be potent, there are significant issues associated with the process of labeling, attaining reproducible changes at the surface and in the inherently multistep nature of analyses. Label free approaches benefit considerably from being (potentially) single step, fast and cheap. Unfortunately, the reliance of transduction on a single (“blind”) binding process brings with it commonly profound problems associated with nonspecific response. There is, nonetheless, a significant and growing body of work showing that high levels of selectivity can be achieved through controlled interfacial chemistry.
Field effects biosensors can be built on the back of highly evolved microelectronic fabrication principles and operate through an electrostatic modulation of charge carrier mobility in suitably prepared semiconductors. Most normally, this modulation is achieved through the use of an integrated “gate electrode”. In recent years the use of “electrolyte gating” has been explored where conductance modulation occurs through the electrostatic environment of the semiconductor surface exposed to solution. In some cases this can be at an “extended gate” electrode in order to maximize conductance response to target binding [47]. A derivative of this approach, in which a “nanogap” is mechanically engineered into the space between a gating electrode and the semiconducting channel, has also been applied to protein detection [48].
Surface impedance analyses (electrochemical impedance spectroscopy, EIS) can be low cost, low power, and highly sensitive with minimal hardware demand. Like all electrical approaches scaleability, miniaturization and multiplexing are strong positive points. Closely related capacitive biosensors possess similar features. In The Recognition Surface Section of this review we focus on the demands and strategies associated with developing impedimetric or capacitive interfaces that respond selectively to specific biomarkers. In EIS Based Biosensing Section, we introduce the fundamentals of EIS and discuss relevant applications. Yet in this section, we show how the same experimental configuration can be used to interrogate the capacitive fingerprints of electrode-confined capture interfaces. We progress from this to a summary of both “classical” capacitive biosensing and new developments of electrochemical capacitance spectroscopy (ECS). Finally, in ECS Biosensing Section, we discuss the perspectives and potential applications of the redox capacitive biosensors.
The Recognition Surface
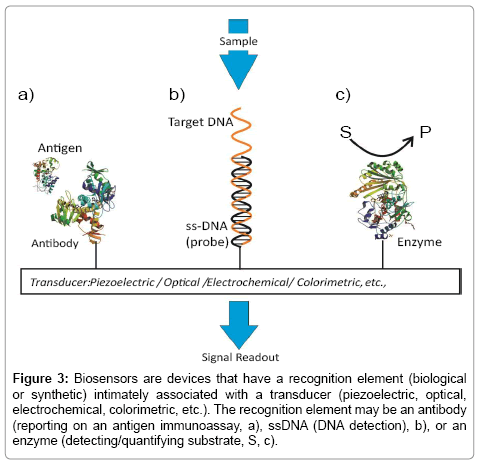
A biosensing configuration is essentially comprised of two components: an immobilized recognition element responsible for selective target recruitment, and a transducer capable of converting the biorecognition event to, ultimately, an electronic or optical signal (Figure 3). For many years now, electrode coupled enzymes have been used to assay a range of low molecular weight specific biomarkers [49,50]. Affinity-based biosensors integrate antibodies, antibody-fragments or aptamers into the transducer surface. Lectins, carbohydrate binding proteins, can also be used as recognition elements supporting the detection of carbohydrates or glycoproteins [51,52].
Figure 3: Biosensors are devices that have a recognition element (biological or synthetic) intimately associated with a transducer (piezoelectric, optical, electrochemical, colorimetric, etc.). The recognition element may be an antibody (reporting on an antigen immunoassay, a), ssDNA (DNA detection), b), or an enzyme (detecting/quantifying substrate, S, c).
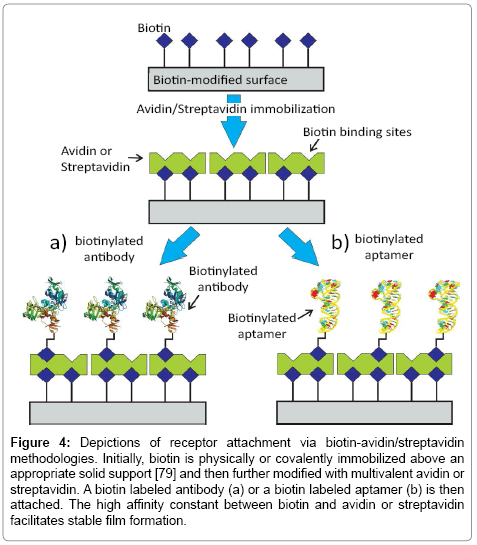
A consideration of the recognition surface is the first critically important step in biosensor design. Assay efficacy depends sensitively on the receptor-surface integration, issues of receptor availability, orientation, surface density and target binding efficacy. Ideally, the soprepared interface should also be highly specific in its response. The initial process of bioimmobilization has been explored via a diverse range of strategies [53-61]. For antibodies, a maximum retention of native target binding efficacy is desired as they are integrated into a surface architecture at a density that is also optimized for capture efficiency [62,63]. A broad range of physical adsorption and entrapment methods have been utilized [59,64,65]. Although these can be facile and generate high surface densities on cationic, anionic or hydrophobic interfaces, the resulting biological surface is often typified by instability and low binding efficacy [61,64]. Non-covalent immobilization of untreated antibodies can also be mediated by an intermediate protein directly coupled to an underlying surface (such as presented by protein A and protein G, resulting predominantly in tail-on orientation i.e. anchoring specifically via the Fc region) [53,58]. The high non-covalent affinity between avidin/streptavidin and biotin (Kd ~10-15 M) has also been very popular [53,66]. In this case, a biotin labeled antibody is immobilized, usually in a tail on-orientation, on a surface previously modified with avidin/streptavidin protein [53,67] (Figure 4a). Lee et al. [68] for example, reported a survey of experimental conditions needed to achieve the most effective immobilization of biotin labelled IgG mouse antibodies (anti-troponin and anti-NT-proBNP) on avidin modified surfaces in optimizing a fluorescent sandwich assay. Significantly, it was noted that higher antibody densities were associated with a steric hindrance that decreases capture probability and reduces assay sensitivity [56].
Figure 4: Depictions of receptor attachment via biotin-avidin/streptavidin methodologies. Initially, biotin is physically or covalently immobilized above an appropriate solid support [79] and then further modified with multivalent avidin or streptavidin. A biotin labeled antibody (a) or a biotin labeled aptamer (b) is then attached. The high affinity constant between biotin and avidin or streptavidin facilitates stable film formation.
Controllable and stable surface immobilization is most often achieved through the use of an intervening, highly chemically tailorable, self-assembled monolayer (SAM) [59,60,69,70]. Where the transducing electrode is metallic, these are very commonly organosulphur based with a range of terminal functionalities [69]. These SAM films may be single component or mixed. In this case, the mixed SAM is obtained from a solution comprising two different thiols with different end-groups and chain lengths. One of the groups is used to covalently tether the receptor while another, usually of reduced chain length, is used to minimize lateral steric hindrance to target recruitment [22,59,71]. In seeking to maximize both biocompatibility and low background (nonspecific surface association – a critical issue in label free assays), highly hydrated PEGylated or polymeric interfaces have been shown to be highly effective [72,73]. Depending on the thiol end group, it is possible to use a variety of protocols to facilitate covalent antibody attachment. For carboxylic terminal SAMs, standard carbodiimide reactions [59,60] using N-(3-dimethylaminopropyl)-N’- ethylcarbodiimide (EDC)/N-hydroxysuccinimide (NHS) protocols are ubiquitous in tethering proteins through their solution exposed lysine residues [74-76]. For example, an impedimetric biosensor with picomolar detection of insulin was designed by Xu et al. [72] using polyethylene glycol (PEG) containing thiol HS–(CH2)11–(EG)3– OCH2–COOH to both immobilize antibodies and drammatically reduce nonspecific surface interactions (non target protein-surface interactions). Amino modified surfaces can also be utilized in bioimmobilisation using a glutaraldehyde crosslinker [53,77,78].
Carbon-based electrodes, especially in those of nanoscale such as presented by carbon nanotubes (CNT) [80] and graphene sheets (GS), have received great attention in biosensing due partially to their high transducing surface area and associated enhanced electrochemical analytical signal [81]. Serafín et al. [82] have, for example, reported an amperometric immunosensor for the detection of insulin-like growth factor 1 (IGF1) using a multiwalled carbon nanotubes (MWCNT) and electropolymerized poly(pyrrole propionic acid) modified glassy carbon electrodes (GC). Monoclonal anti-IGF1 receptors were immobilized via EDC/NHSS (NHSS: N-hydroxysuccinimide sulfate) chemistry, and peroxidase labeled polyclonal antibodies applied in detecting the target with a linear range of 0.5 to 1000 pg/mL and LOD of 0.25 pg/mL [82]. Graphene interfaces have also been utilized; a voltammetric immunosensor was designed and reported by Eissa et al. [83] for example, to detect allergen ovalbumin with LOD of 0.83 pg/ mL. In this case, the authors immobilized antibodies on aryl diazonium functionalized graphene.
Due to the high surface area and electronic conductivity, associated to the well-organized and featuring packed vertical oriented film, single-walled carbonnanotubes (SWCNT forests) have been explored in design sensitive assays (picogram levels LODs) [84,85], since SWCNT forests can facilitate electron transfer between the underlying electrode surface and immobilized biomolecules [86,87]. Often, carboxylated SWCNTs are assembled on iron hydroxide coated substrate, creating a high ordered vertical SWCNT forest [85-87]. The receptor antibody is then attached covalently to the end of the nanotube and, after immunoreaction between the receptor and target (antigen), an enzyme labeled secondary antibody is added to complex the antigen. The electrochemical signal of the label allows the quantification of the target. Using this approach, Rusling and coworkers [87] developed an amperometric sensor to detect HSA (human serum albumin). The authors immobilized anti-HSA on a SWNT forest via an EDC/NHS protocol. After exposing the sensor to HSA, HRP labeled secondary antibody was used to detect the target in a linear range of 0.075 to 7.5 nM with a LOD of 75 nM (without a mediator) and a better LOD (~1pM) using mediating hydroquinone [87]. Malhotra et al. [88] designed an electrochemical immunosensor to detect interleukin-6 (IL- 6), which is a cancer biomarker, immobilizing anti-IL-6 on a SWCNT. Using secondary antibodies attached to HRP decorated carboxylated multiwall carbon nanotubes, the assay was able to detect picogram levels of IL-6 (0.5 pg/mL).
The extensive use of antibodies in biosensor configurations has been accompanied by a concern about cost, stability and reproducibility in surface performance, a concern that amplifies as progress is made towards viable “real world devices” [79]. The development of nucleic acid or peptide nucleic acid receptors has grown exponentially during the past decade in partial combat of this. These aptamers can, additionally, be prepared by low cost, facile in vitro preparation (SELEX methods [89]), easily modified with functionalized groups and labels, and have binding affinities that can be comparable to that typically associated with antibodies [25,43]. In many cases aptamers can be integrated with electrode surfaces (native or nanoparticle modified) using terminal thiol functionalities [79]. Alternatively, surface immobilization can be achieved through terminal amine anchoring to pre-carboxylate modified solid surfaces, or through biotin-streptavidin protocols [79]. For example, Yao et al. develop a piezoelectric biosensor to detect IgE, immobilizing a biotin-labeled aptamer above avidin film previously prepared on gold [90]. The authors used 3,3’-dithiodipropionic acid di(N-succinimidylester) (DSP) to obtain a SAM on gold and covalently coupled avidin to this through reaction with the activated ester.
A very important issue related to surface design in the development of reliable label free point-of-care devices is the problem of biofouling [91]. Label free techniques for clinical applications suffer, often terminally, when attempts are made to detect low marker concentrations in real samples (blood, blood serum, saliva, plasma, urine, cerebrospinal fluid, etc.). Such samples generate high background signal (noise) specifically because of their high protein content. For example, HSA is present in blood at 107 ng/mL levels [92]. When compared to the clinically relevant levels of cardiac biomarkers, such as myoglobin, cTnI (Troponin I) and CRP (C-reactive protein), for example, all at 10-2 to 103 ng/mL, the demands are clear [93]. One methods of addressing this 104-109 concentration differential is the use of “blocking” proteins (serum albumin) [91] or the use of polymers coatings, such as polyethylene glycol (PEG) [73,91]. It is known that the latter films form highly hydrated surfaces [94] that have very low levels of protein interaction. The idea is that the introduction of specific capture antibodies (or aptamers) into such surfaces should, ideally, generate an interface that recruits only that antibody-specific target. Bryan and colleagues [76] have, for example, developed a faradaic impedimetric biosensor to detect CRP (with a LOD of ~300 pM) in blood serum using receptive antibodies immobilised on a PEG containing thiol film. In a similar approach, Xu et al. [72] reported a faradaic impedimetric immunosensor to detect insulin in a 50% blood serum/buffer (phosphate buffered saline with Tween-20, pH 7.4) with an LOD of 4.77 pM.
Very effective non-fouling surfaces can be achieved using zwitterionic polymers [95-97], such as sulfobetaine methacrylate (SBMA) or poly-(carboxybetaine methacrylate) (PCBMA), and zwitterionic alkanethiolates [98]. These films produce charged but net neutral surfaces that are associated with high levels of hydration [94,96]. Using PCBMA, Yang et al. [99] developed a sensor to detect glucose in both diluted (10% and 50% in PBS) and neat human blood serum. The methodology comprises a hydrogel coating on a conventional amperometric glucose sensor, yielding an approach to detect glucose in a linear range of 4-20 mM. Luo et al. [100] applied chemisorbed zwitterionic polymer supports (PCBMA) in underpinning the detection of insulin in neat blood serum. In this case, CBMA monomer was pre-immobilized at the electrode surface and a mixture of CMBA, ethylene glycol dimethracrylate and 2-hydroxy- 2-methylpropiophenone irradiated (λ=254 nm) to initiate the polymerization across the surface. The antibody was then covalently tethered. Using this approach, the non-faradaic immunosensor was able to detect insulin in a linear range of 0.1-200 pM with a staggering LOD of 42.6 fM [100]. A SPR biosensor using a zwitterionic coating on SiO2/Au surfaces to detect activated leukocyte cell adhesion molecule (ALCAM – a cancer marker) was developed by Yu and coworkers [101]. The authors immobilized the antibody covalently above the zwitterionic polymer without “blocking” agents, yielding a sensor able to detect the biomarker in nanogram levels (64 ng/mL) in undiluted human serum [101]. Miyahara and coworkers developed a one-step synthesis of a zwitterionic alkanethiolate using 2-methacryloyloxyethyl phosphorylcholine (MPC) as a building block [98]. The authors functionalized one mercapto group in 1,6-hexanedithiol with MPC via Michael-type addition, allowing the remaining mercapto group to chemisorb to a gold surface. This methodology yielded a non-fouling protein and cell resistant SAM [98].
Once a suitably selective interface has been prepared, there exist a variety of methods by which target recruitment can be quantified (as noted above). Of the electroanalytical methods available, those based on EIS are the most sensitive of those applicable in a label free format. These may or may not utilize an initial pre-doping of the analytical solution with redox probe and accordingly are faradaic or otherwise. Though the vast majority of published works utilize changes in charge transfer resistance, capacitive approaches (faradaic or not – see below) can also be powerful [72,74,102-104] (Table 1). In the next sections, we will discuss the principles and applications of these approaches [105-118].
| Target | Associated disease or state | Impedance approach | Linear range | Limit of Detection | Ref. |
|---|---|---|---|---|---|
| Alpha-synuclein autoantibody | Parkinson’s disease | Faradaic | 75 - 1500 ng/mL | 8.2 ng/mL | [105] |
| Antibodies against hemmaglutinin (HA) | Influenza A (virus H5N1) | Faradaic | 0.004 - 0.020 ng/mL | 0.002 ng/mL | [106] |
| C-reactive Protein (CRP) | Cardiac events and inflammation | Non-faradaic | 0.025 - 25 ng/ml | 0.032 ng/mL | [107] |
| Faradaic | 12-230 ng/mL | 31 ng/mL | [74] | ||
| Redox-capacitive | 1.2-2300 ng/mL | 3.3 ng/mL | [108] | ||
| D-dimer | Thrombosis | Faradaic | 0.0001 - 2000 ng/mL | 0.0001 ng/mL | [109] |
| Human epidermal growth factor receptor-3 (HER-3) | Tumor breast and non-small-cell lung carcinoma | Faradaic | 0.0002 - 0.0014 ng/mL | N/A | [110] |
| Human hepatocellular carcinoma cells (Bel-7404) | Liver cancer cell | Faradaic | 1000-1000000 cells/mL | 234 cells/mL | [111] |
| Immunoglobulin A | Immune system disorders | Faradaic | 0.01 - 100 ng/mL | 0.01 ng/mL | [112] |
| Insulin | Diabetes | Non-faradaic | 0.0006 - 1.20 ng/mL | 0.0003 ng/mL | [100] |
| Faradaic | 0.029-290 ng/mL | 0.007 ng/mL | [72] | ||
| Interleukin-6 (IL-6) | Cancer and inflammation | Faradaic | 0.00000001 - 0.0001 ng/mL | 0.00000001 ng/mL | [113] |
| Non-faradaic | 0.025 - 25 ng/ml | 0.32 ng/mL | [107] | ||
| Human breast adenocarcinoma cell line (MCF-7) | Breast cancer | Faradaic | 100 – 10000 cells/mL | N/A | [114] |
| Murine double minute 2 (MDM2) | Brain tumor | Faradaic | 0.001 – 1000 ng/mL | 0.00029 ng/mL | [115] |
| Myoglobin | Acute myocardial infarction | Faradaic | 10 - 650 ng/mL | 5.2 ng/mL | [116] |
| Prostate specific antigen (PSA) | Prostate cancer | Faradaic | 0.001 - 0.1 ng/mL | 0.001 ng/mL | [117] |
| Prostatic acid phosphatase (PAP) | Prostate cancer | Redox-capacitive | 5-1000 ng/mL | 1 ng/mL | [108] |
| Streptococcus piogenes cells | Bacterial infection | Faradaic | 10 – 10000 cells/µL | N/A | [118] |
| Tumor necrosis factor-alpha (TNFα) | Cardiac events and inflammation | Non-faradaic | 0.025- 25 ng/ml | 0.32 ng/mL | [107] |
Table 1: Examples of impedance and redox capacitive biosensors.
EIS Based Biosensing
Fundamentals of EIS
EIS is a powerful interfacial analytical tool and has been applied extensively to corrosion studies [119-121], the characterization of charge transport across membranes [122] and battery development [123-125]. Its utility in detection interfacial binding events has been known for some two decades [126-129].
The impedance of an interface is generally determined by applying a sinusoidal voltage perturbation whilst tracking the current response [130]. To obtain a linear voltage-current response, which is essential to impedimetric measurements, only small (~10 mV peak to peak) [126] perturbations are typically applied. The linearity of the voltage-current response in the range of frequencies studied can be evaluated by fitting the experimental data using a special equivalent circuit comprising a series of resistance and capacitance in parallel (described by Kronig- Kramers relations [131]). It is, additionally, worth noting that small amplitudes are non perturbatory in terms of underpinning receptive film chemistry and biochemistry.
A typical experimental set up configuration in impedance measurements consists of three electrodes. The current response is measured at the working electrode, at which the receptive film is constrained [129]. A reference electrode, such as Ag/AgCl (KCl saturated or 3 M) or calomel is used to maintain a fixed and reproducible absolute electrical potential [132]. A counter electrode (a platinum plate with area typically ten times larger than the working electrode [129,133]) allows electron flux between it and working electrode [126]. The instrumentation is essentially composed of a potentiostat/ galvanostat and a frequency response analyzer (FRA). The FRA sends a sine wave of a particular AC amplitude voltage to the potentiostat and, simultaneously, imposes a command voltage and measures the current response [126,127].
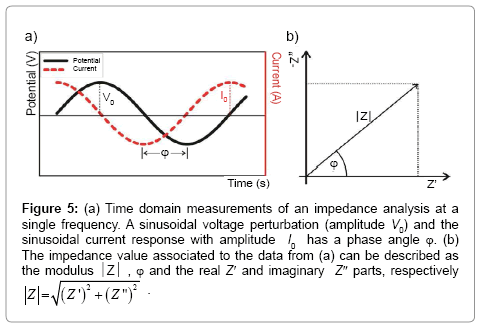
Mathematically, the complex impedance (Z*) is the ratio between the voltage time-function (V(t)=V0 sin(ωt)) and the resulting currenttime response function (I(t)=I0 sin(ωt+Ï┬?)) (Equation 1):
 (1)
(1)
Where V0 and I0 are the maximum voltage and current signals, ω is the angular frequency (ω = 2πf), f is the frequency, t the time, Ï┬? is the shift phase and Y* is the complex admittance (related to the conductance). The impedance is generally determined at different frequencies, obtaining an impedance spectrum (Z*(ω)). The Z* function is described as a complex number, Z*(ω) = Z′+jZ″, where  and Z″ are the real and imaginary parts, respectively. The Z* value can be represented by the modulus
  , the phase shift Ï┬?, Z′ and Z″ (Figure 5). To interpret the impedance results, the data can be analyzed in two different ways: a Blode plot, which plots log
  and Ï┬? as a function of log f, or a Nyquist plot that plots -Z″ versus Z′ (by convention in electrochemistry they just referred as Z″ versus Z′ plot and the minus signal in -Z″ is implicit).
Figure 5: a) Time domain measurements of an impedance analysis at a single frequency. A sinusoidal voltage perturbation (amplitude V0) and the sinusoidal current response with amplitude I0 has a phase angle Ï┬?. (b) The impedance value associated to the data from (a) can be described as the modulus  , Ï┬? and the real Z′ and imaginary Z″ parts, respectively
The impedance characteristics of a modified electrode interface can be innate or probed through the addition to solution of a diffusing redox probe. For example, electrochemical reactions on metallic surfaces can be monitored by an alternating current that is forced to pass through the interface metal/solution. A redox probe, such as an iron or cobalt complexe [91,127], are oxidized or reduced on the surface depending on the applied potential. A change in the interfacial properties, such as that caused by adsorption of a specific target analyte, will disturb the electrochemical reaction and a more resistive behavior (higher impedance) can be expected. Alternatively, innate capacitive/ dielectric features of the interfaces can be used analytically [128]. The association of a biomolecule with a bare of modified solid electrode surface will lead to a displacement of water and hydrated ions from the immediate region, changes detectable through associated change in capacitance and, consequently, the impedance [128]. The former approach, which is by far the more common, is known as “faradaic” and includes an amplification of any changes at the interface as sensed (sterically or electrostatically) by the solution probe [91,126,129]. The latter “capacitive” approach does not require the pre-doping of analytical solution with a large excess (usually several mM) of redox probe is the “non-faradaic” approach [91,126,128]. Though somewhat less predictable in terms of change expected on target recruitment from solution, this approach can also be exceedingly sensitive [128,134]. As described in Table 1 both approaches have been successfully applied to the sensitive detection of clinically relevant targets.
Faradaic impedance
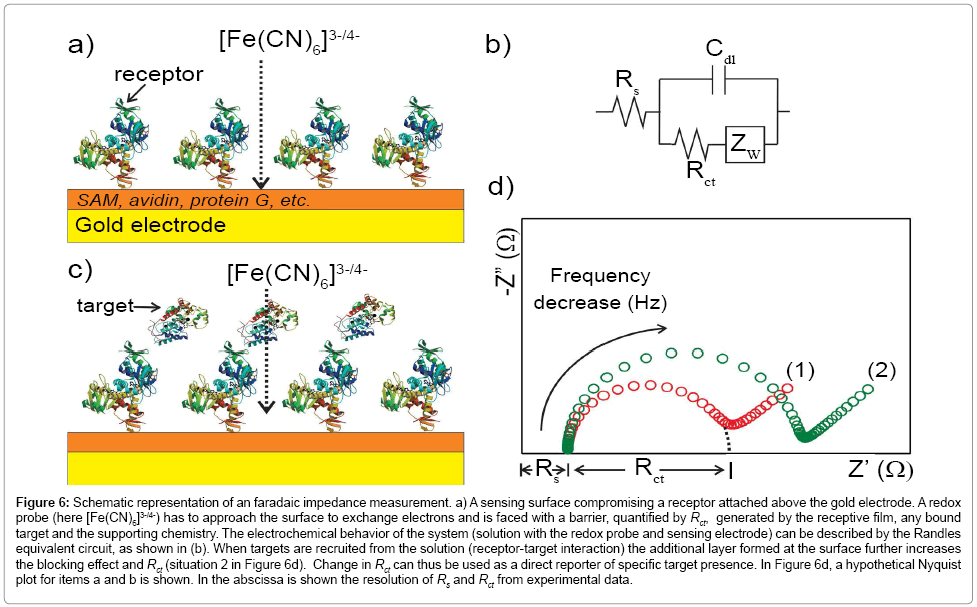
In all forms of impedance, as noted above, the data acquirement is that of current as a function of time as the voltage waveform is applied. The relationship between applied oscillating voltage and observed oscillating current is analyzed by considering the experimental configuration (that is, the surface and its associated solution) to be composed of circuitry elements (an “equivalent circuit” of resistors and capacitors, typically called the Randles circuit – (Figure 6b)). Four elements are used to understand the relationship between current and voltage: the current impediment in an AC potential. These are solution resistance (RS), double layer capacitance (Cdl), electron transfer resistance (Rct) and Warburg impedance (Zw) [126,127,129,135,136]. The solution resistance is related to the conductivity/mobility of the redox probe in solution and is not affected by biorecognition events at the electrode surface [91]. The double layer capacitance is an intrinsic feature of polarized electrodes immersed in electrolyte solution. Depending on the potential applied to the electrode, ions of opposite charge will approach the surface, forming a separated double layer [126]. The capacitive element is usually replaced by a constant phase element (CPE) to reflect the non-ideality of the surface capacitance [126]. The electron transfer resistance quantifies the electrostatic and/ or steric barrier presented to the redox probe at the surface (Figure 6). The Warburg impedance, which is not used for analytical proposes, represents the unperturbed diffusion of the redox probe in bulk solution towards the electrode, down a diffusion gradient [127].
Figure 6: Schematic representation of an faradaic impedance measurement. a) A sensing surface compromising a receptor attached above the gold electrode. A redox probe (here [Fe(CN)6]3-/4-) has to approach the surface to exchange electrons and is faced with a barrier, quantified by Rct, generated by the receptive film, any bound target and the supporting chemistry. The electrochemical behavior of the system (solution with the redox probe and sensing electrode) can be described by the Randles equivalent circuit, as shown in (b). When targets are recruited from the solution (receptor-target interaction) the additional layer formed at the surface further increases the blocking effect and Rct (situation 2 in Figure 6d). Change in Rct can thus be used as a direct reporter of specific target presence. In Figure 6d, a hypothetical Nyquist plot for items a and b is shown. In the abscissa is shown the resolution of Rs and Rct from experimental data.
The capacitive element (double layer capacitance) in the Randles circuit is well described by the Gouy−Chapman−Stern (GCS) theory [132]. In this approach, the electrode immersed in a solution containing ions (modeled as spherical charges embedded in a solvent dielectric continuum) raises a capacitance that is a series combination of two capacitances: the Helmholtz capacitance (CH) and diffuse-layer capacitance (CD) (Equation 2):
 (2)
(2)
This “native” double layer capacitance is affected by an introduction of a monolayer film (dielectric layer) between the electrode and the solution, generating a new term, the monolayer capacitance Cm [137] (Equation 3):
 (3)
(3)
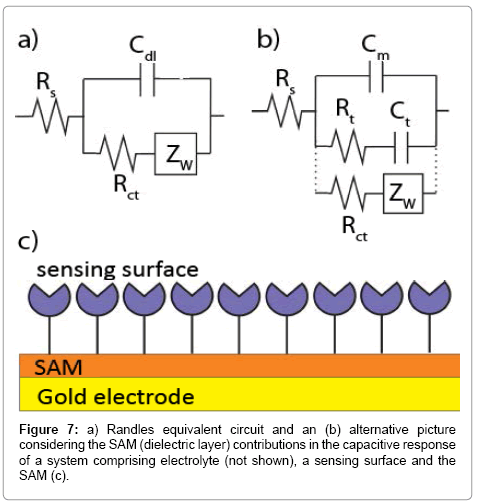
where Cb is the capacitance of the film without ionic ingress in the monolayer and is primarily composed of field induced dipoles. Additional ingress of ions into the film creates new charging elements and two terms, Rt and Ct, used to quantify the SAM dipolar relaxation characteristics [137]. Since Cm > Cb (Cb dominates the capacitive interfacial response) [137], the capacitive response in the Randles circuit can be replaced to a series resistive (Rt) and capacitive (Ct) terms in parallel to Cm (Figure 7).
As noted, the Rct parameter is predominantly used in faradaic impedance sensors to signal transduction. Elshafey et al. [115] for example, have reported an impedimetric immunosensor with a low LOD (0.29 pg/mL in buffer and 1.3 pg/mL in mouse brain tissue homogenate) for Murine double minute 2 protein (cancer biomarker). Within this work the authors immobilized the antibody on a polycrystalline gold electrode functionalized with cysteamine via a cross-linking agent. The measurements were carried out using PBS solution containing [Fe(CN)6]3-/4- probe redox. The target associated Rct increase yielded a linear relation with logarithm of concentration.
Johnson et al. [138] have reported a faradaic impedimetric biosensor to detect CRP (a cardiovascular marker) in serum. In this work, a carboxylate terminal thiol film on gold was used to tether specific receptive protein affimers or antibodies, with, again, Rct determined by the equivalent circuit shown in Figure 7b [137]. Using a similar approach, Bryan et al. [76] constructed an impedimetric sensor for CRP quantification in dilute blood serum with an LOD at picomolar concentration levels. Fernandes et al. [74], in physically immobilizing anti-CRP at a mixed SAM functionalized electrode, designed an impedimetric sensor to quantify CRP in a linear range of 0.5-10 nM and LOD of 0.3 nM [74].
Barton et al. [117] developed a sensitive faradaic impedimetric assay for prostate specific antigen (PSA) detection (the most commonly utilized prostate cancer marker; at 4-10 ng/ml, there is a documented ~20% cancer probability, with this rising to ~70% when levels exceed 10 ng ml-1) [139,140]. Here, the authors immobilized biotin anti-PSA using the previously outlined biotin/avidin protocol and, achieved target detection with a linear range of 1-100 pg/mL and a LOD of 1 pg/mL [117]. Chiriacò et al. [141] using a different immobilization approach, reported two different impedimetric arrays to quantify free and complexed forms of PSA. In this work anti-free PSA or anti-total PSA capture agents were electrode immobilized via protein A, itself pre-immobilized on a functionalized carboxylic thiol electrode. The authors reported assays with a linear range of 1-10 ng/mL and LOD of 1 ng/mL.
A sensor to detect thrombin was developed by Xu et al. [142] using a histidine labeled thrombin aptamer (His-TBA). For this work, the authors electrogenerated a poly(pyrrole- nitrilotriaceticacid) film at a Pt electrode surface prior to recruiting the aptamer through its HIStag mediated copper ligation (this methodology also allows facile surface regeneration using imidazole). The sensor developed an LOD of 4.4 pM and a linear range of 4.7 pM-0.5 nM. Ocaña and del Vale designed a faradaic impedimetric sandwich type biosensor to detect thrombin even more sensitively (LOD of 0.2 pM) [143]. In the first step, they immobilized the biotin labeled aptamer (AptThrBio1) onto an electrode functionalized with avidin and blocked unspecific sites with poly(ethylene glycol). After incubation with target, the sensors were exposed to a second biotin labeled aptamer (AptThrBio2) with subsequently reaction with gold-streptavidin nanoparticle and silver enhancement via catalytic reduction. This approach yields a sensitive sensor to thrombin in a linear range of 0.1-100 pM.
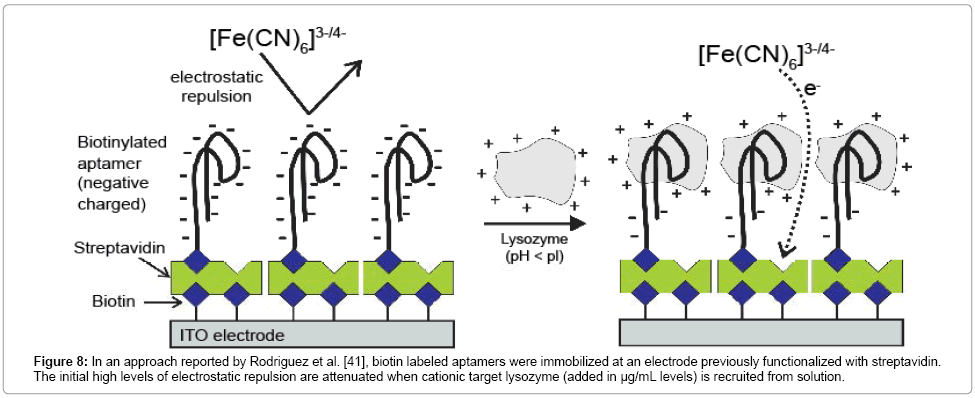
Although the summary in Table 1 is necessarily only a representative survey of faradaic EIS sensor examples, the vast majority of Rct signal transductions are associated with an (conceptually expected) increase in this parameter with target surface recruitment. However, Rodriguez et al. [41] reported an assay in which biorecognition is associated with a decrease in Rct. The basis of this was the strong electrostatic repulsion initially set up between the recognizing nucleic acid aptamer capture agent and the anionic (Fe[CN)6]3-/4-) solution probe. The capture of a cationic target (where experimental conditions are such that pH<pI) attenuate the repulsive charge, and, consequently, Rct [41]. Here an effective assay of lysozyme was achieved [41] (Figure 8).
Figure 8: In an approach reported by Rodriguez et al. [41], biotin labeled aptamers were immobilized at an electrode previously functionalized with streptavidin. The initial high levels of electrostatic repulsion are attenuated when cationic target lysozyme (added in μg/mL levels) is recruited from solution.
In addition to its extensive application to the quantification of proteins, EIS has been used successfully to detect cells, including bacteria [118] and cells related to specific disease states [114]. Impedimetric biosensors have, for example, been applied to the detection of monocytes with CD14+ and CD16+ expression [6]. Monocytes are a type of white blood cell responsible for organism defense against infectious pathogens and inflammation [144]. An increase in the blood level of monocytes with CD14+ and CD16+ expression represents evidence of severe bacterial infection [5]. In achieving an effective assay, Montrose et al. [6] immobilized the anti CD14 or CD16 antibodies at a protein G functionalized gold electrode prior to running a relatively standard faradaic EIS assay.
In an application to cancer cell detection, Hu et al. [111] immobilized concanavalin A (Con A), a mannose specific lectin, on gold electrode prior to a faradaic assay. The device was able to detect selectively human hepatocellular carcinoma cells (Bel-7404, a liver cancer cell) in a linear range of 103-106 cells/mL with LOD of 234 cells/ mL [111]. Seven et al. [114] designed an impedimetric immunosensor to detect MCF-7 cells (102 – 104 cells/mL) with overexpressed c-erbB-2 receptors (markers of breast cancer). In this case, experimental Rct data were obtained using hydroquinone as a redox probe after incubation with cell samples, with an achieved limit of quantification (LOQ) of 100 cell/mL.
Interdigitated array microelectrodes (IDAM) have also been applied to impedance based biosensing. These electrodes present several advantages, such as the rapid establishment of steady-state, facile rapid reaction kinetics, and associated increases in sensitivity (although equivalent circuits can be somewhat more complex than those typically associated with single planar electrodes) [112,145,146]. In one application, Ohno et al. [112] used a gold interdigitated electrode to build a label-free human immunoglobulin A (IgA) immunosensor. The electrodes were first functionalized with 3-mercaptopropionic acid, the antibody covalently tethered and the surface then backfilled with BSA solution. A linear response in Rct was obtained for a concentration range of 0.01-100 ng/mL, yielding an assay with LOD of 0.01 ng/mL. Bhansali and coworkers [145] developed an assay to detect cortisol (a stress-related biomarker) in saliva by an immobilizing a monoclonal antibody covalently onto a gold electrode previously functionalized with dithiobis(succinimidyl propionate) (DTSP) selfassembled monolayer, and then used glycine/ethanolamine solution mixture to block unspecific sites. The assay was able to detect cortisol in a linear range of 1 pM to 10 nM and LOD of 1 pM [145]. In another example, Xu et al. [147] designed an interdigitated gold electrode assay to detect IgE. In this case, the authors immobilized an IgE thiolmodified aptamer, consisting of single-stranded DNA containing a hairpin loop, directly on gold surface. This methodology was able to detect IgE in a linear range of 2.5-100 nM with LOD of 0.1 nM.
Non-faradaic impedance
The main difference between non-faradaic and faradaic impedance approaches is the need for a redox active probe. In nonfaradaic impedance, transduction occurs not through changes in the impediment presented to a solution phase probe but to surface dielectric, charge distribution or local conductance, most commonly assessed through capacitance [128]. The capacitance arises when an electrode is immersed in an electrolyte solution and a certain potential is applied. In this condition, charged species and dipoles will be oriented on the interface electrode/solution, generating the previously mentioned electrical double layer capacitance, a physically measureable quantity potentially very sensitive to interfacial change. This change may be induced when a protein target binds to the receptor, previously attached in the electrode, displacing water and ions from the surface [148], or due a changing in protein conformation [128].
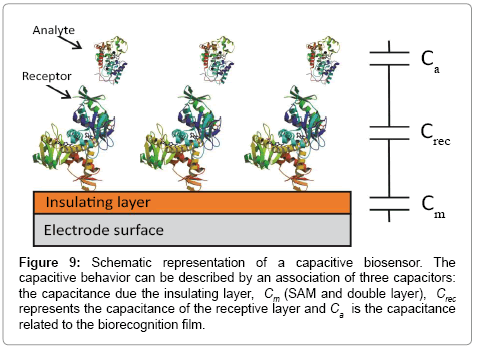
The capacitance of a biorecognition surface in non-faradaic approach can be described as a combination of two capacitances (Figure 9). The first capacitance consists of an insulating layer, comprised by a SAM on gold and double layer (Cm). The second capacitance (Crec) is related to the formation of a receptor biofilm (biorecognition layer). The binding event (target-receptor biorecognition) generates a third layer, (Ca). The total capacitance (C) obtained by the combination in series of these three components: (Equation 4)
Figure 9: Schematic representation of a capacitive biosensor. The capacitive behavior can be described by an association of three capacitors: the capacitance due the insulating layer, Cm (SAM and double layer), Crec represents the capacitance of the receptive layer and Ca is the capacitance related to the biorecognition film.
 (4)
(4)
From Equation 4, the total capacitance is dominated by the lowest component and this observation is important in capacitance sensor design, in which the capacitance of the insulating layer has to be high as possible to allow detect changes in the system caused by target binding [128]. This means that the insulating layer has to be impermeable to ions from solution, otherwise this will lead to a decrease or absence of the signal [128].
The total capacitance can be experimentally obtained by two methodologies: electrochemical impedance spectroscopy (EIS) or potential step amperometry. The EIS, as discussed previously in Fundamentals of EIS Section, measures the current response due an application of a perturbative sinusoidal voltage. The range of frequencies commonly used is around 10 kHz [128]. In the potential step amperometry, it is measured the response current due a potential perturbation step (around 50 mV) in a same frequency [128]. Measuring the current in low electrolyte concentrations, condition where the time constant (τ = RS C) is high and hence measurable, the current response is given by: (Equation 5)
 (5)
(5)
Where i(t) is the current in the circuit in function of time, U the pulse potential (the magnitude) applied, RS the solution resistance, t the time elapsed after the potential step application and C the total capacitance (in other words, the equivalent capacitance) measured at the working electrode/solution interface [128]. This function can be easily linearized as follows: (Equation 6)
 (6)
(6)
Then, C and RS can be extract from the slope and intercept of the linear least-square fitting of ln i(t).
Capacitive approaches have invested in the use of both aptamers and antibodies as recognition elements [149-152]. For example, Dijksma et al. [153] immobilized a specific antibody (MD-2) above SAM modified gold electrode to detect interferon-γ (biomarker for autoinflammatory and autoimmune disease). The authors used a flow cell, injecting controlled amounts of target followed by buffer washes (PBS). The methodology adopted was able to detect the target across a range of 0-0.00000014 ng/mL and LOD of 0.00000002 ng/mL [153].
Thavarungkul and coworkers [151] compared the target recruiting performance of covalently tethered anti-alpha-fetoprotein at thiourea, thioctic acid and 3-mercaptopropionic acid SAM interfaces. The three interfaces exhibited the same linear range (0.01-10 μg/mL) with very comparable sensitivities and detection limits [151]. Using a similar thiourea SAM gold modified electrode, Limbut et al. [152] developed an immunosensor able to detect carcinoembryonic antigen (cancer biomarker) in a linear range of 0.01-10 ng/mL and LOD of 10 pg/mL with an apparent ability to be extensively reused.
Lin et al. [154] developed a sensitive impedimetric non-faradaic EIS assay to detect two cardiac biomarkers (CRP and myeloperoxidase) in human serum. The configuration consists of a gold electrode surface coated with a nanoporous silica membrane, the later forming nanowells. The underlying gold surfaces were functionalized with a dithiobis- (succinimidyl propionate) crosslinker, streptavidin, then biotinylated antibody. The immunoreaction was monitored by analyzing the change in capacitance associated with double layer perturbation within the nanowells. Using this approach, the researchers claimed to be able to detect both biomarkers in pg/mL levels in human serum [154].
Antifouling surfaces for capacitive biosensing approach are possible using zwitterionic polymers previously mentioned. For example, Luo et al. [100] developed a sensitive non-faradaic impedance biosensor to detect insulin in neat blood serum. In this work, the receptor (antiinsulin antibody) was immobilized on a non-fouling zwitterionic polymer (carboxybetaine methacrylate, PCBMA). Biorecognition was sensitively (at fM levels) tracked through change in phase between the input voltage and the output current, an ability retained in serum [100].
There are, then, interesting examples of capacitive biosensors capable of quantifying important biomarkers with low limits of detection (picogram levels). In addition, from a practical point of view, the absence of a redox couple in solution during the analysis makes the associated non-faradaic approach more translatable to point-of-care devices. In the next section, we will discuss a new approach to develop sensitive biosensors (LOD in picomolar levels) that is unnecessary adding redox probe: the capacitance redox biosensing.
ECS Biosensing
When a voltage polarized metallic interface is placed in an electrolyte, there is established, as previously noted, a double layer capacitance (storage). This is modified in the presence of a molecular film but is retained in some form. If a film is present which includes an entity which can be faradaically charged i.e. is redox active then an additional charging element is present – this has commonly been termed (in electrochemical literature) pseudocapacitance. The relative magnitudes of these two storage contributions depend sensitively on the surface and solution composition but, in general, pseudocapacitance is markedly higher.
Very recently we have shown that the loosely described pseudocapacitance associated with surface confined redox events represents a specific manifestation of the general mesoscopic capacitance principles introduced by Marcus Büttiker [155]. We have specifically referred to this as redox capacitance (Cr) and detailed its origin as exactly that which arises due to the communication of the metal density of states [gm (E)] to a redox site molecular density of states [gr (E)] [156,157]. This capacitance is measured through impedancederived electrochemical capacitance spectroscopy, ECS. We have further shown that this experimentally resolved capacitance (without the contribution the non-faradaic components as described previously) is, in fact, comprised of two distinct contributions thus: (Equation 7)
 (7)
(7)
where Ce = dq/dV is the electrostatic or geometrical capacitance arising from charge separation in the normal (classical) way and Cq is the quantum capacitance, arising very specifically from the chemical potential changes associated when charging a nanoscale mesoscopic entity [155]. Cq is specifically defined as [156]: (Equation 8)
 (8)
(8)
Since gm (E)>>gr( E), i.e. the electronic density of states in the metal is much higher than that of molecular redox states chemically attached over the electron reservoir, this reduces to Cq = e2gr (E) [156]. Statistically, for a distribution of states, above absolute room temperature, gr (E) is given (meaning experiment observed) by a Gaussian redox density of states defined as [158]: (Equation 9)
 (9)
(9)
Where σ is the standard deviation (and σ2 the variance) of the multiple energetic states possibles.
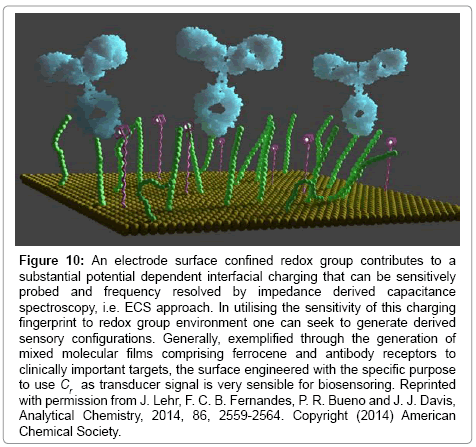
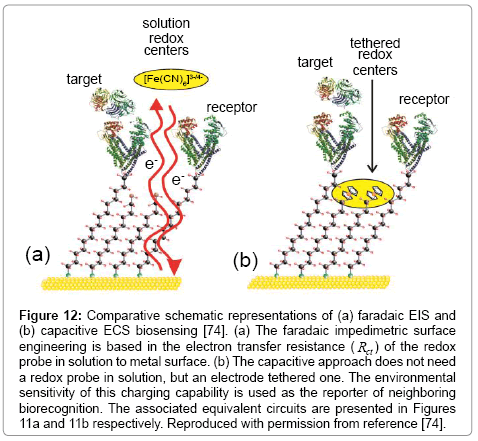
In recent work we have shown that this resolved Cr charging element can be very effectively used as a transduction of biological recognition events [74,102,108]. These are label free assays and do not require any pre-doping of the analytical solution with redox probe (in effect, the redox probe is constrained at the electrode surface and analysed through its highly potential dependent charging, Figure 10). This approach benefits from the fact that the transducing signal is cleanly separated from background through its specific frequency and voltage dependence and requires that a mixed surface film is prepared, that is, one which comprised a redox capacitance unit and a recognition element (Figure 12).
Figure 10: An electrode surface confined redox group contributes to a substantial potential dependent interfacial charging that can be sensitively probed and frequency resolved by impedance derived capacitance spectroscopy, i.e. ECS approach. In utilising the sensitivity of this charging fingerprint to redox group environment one can seek to generate derived sensory configurations. Generally, exemplified through the generation of mixed molecular films comprising ferrocene and antibody receptors to clinically important targets, the surface engineered with the specific purpose to use Cr as transducer signal is very sensible for biosensoring. Reprinted with permission from J. Lehr, F. C. B. Fernandes, P. R. Bueno and J. J. Davis, Analytical Chemistry, 2014, 86, 2559-2564. Copyright (2014) American Chemical Society.
Figure 12: Comparative schematic representations of (a) faradaic EIS and (b) capacitive ECS biosensing [74]. (a) The faradaic impedimetric surface engineering is based in the electron transfer resistance ( Rct ) of the redox probe in solution to metal surface. (b) The capacitive approach does not need a redox probe in solution, but an electrode tethered one. The environmental sensitivity of this charging capability is used as the reporter of neighboring biorecognition. The associated equivalent circuits are presented in Figures 11a and 11b respectively. Reproduced with permission from reference [74].
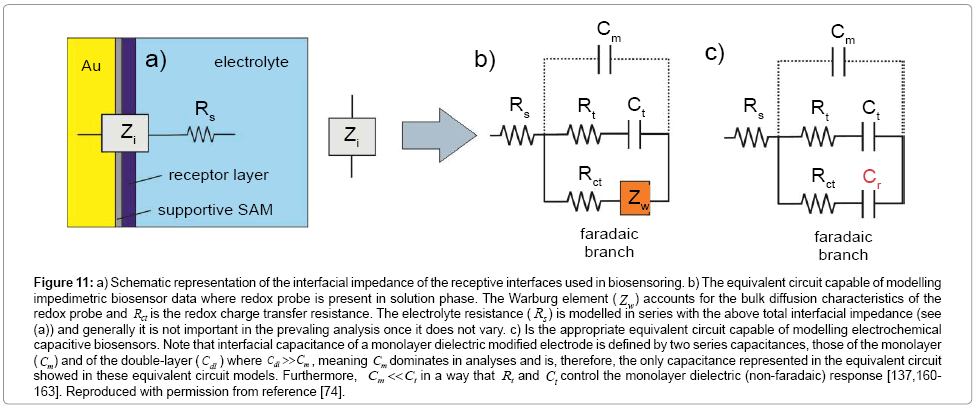
The Cr signal itself is obtained from Z*(ω) which is converted mathematically to capacitance using the relationship C*(ω)=1/iωZ*(ω), in which ω is the angular frequency and  more details can be found in references [137,158]). A complete circuit description of these interfaces (or those more generally associated with a dielectric component and a redox active component) and more detailed comparison between EIS and ECS approaches and responses are shown in Figure 11 [137,160-163].
Figure 11: a) Schematic representation of the interfacial impedance of the receptive interfaces used in biosensoring. b) The equivalent circuit capable of modelling impedimetric biosensor data where redox probe is present in solution phase. The Warburg element ( Zw) accounts for the bulk diffusion characteristics of the redox probe and Rct is the redox charge transfer resistance. The electrolyte resistance ( Rs ) is modelled in series with the above total interfacial impedance (see (a)) and generally it is not important in the prevaling analysis once it does not vary. c) Is the appropriate equivalent circuit capable of modelling electrochemical capacitive biosensors. Note that interfacial capacitance of a monolayer dielectric modified electrode is defined by two series capacitances, those of the monolayer ( Cm) and of the double-layer (Cdl ) where Cdl >>Cm , meaning Cm dominates in analyses and is, therefore, the only capacitance represented in the equivalent circuit showed in these equivalent circuit models. Furthermore, Cm << Ct in a way that Rt and Ct control the monolayer dielectric (non-faradaic) response [137,160- 163]. Reproduced with permission from reference [74].
It is important to note that any change in the environment of the redox tethered sites causes a change in the storage capability of the molecular layer with a consequent change in Cr. This was initially demonstrated in an assay of CRP [102] using a mixed SAM compromising a tethered redox probe (11-ferrocenyl-undecanethiol) and pentadecanethiol on which the receptive antibodies were physisorbed. Assay performance was comparable to that reported in previous work [76,138].
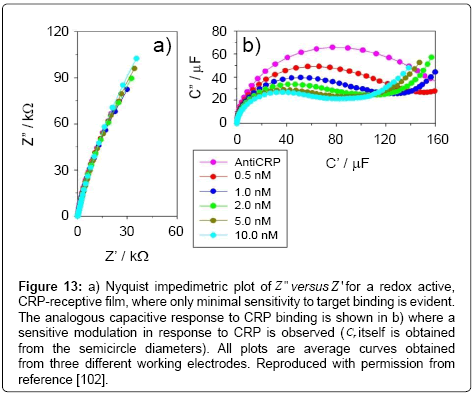
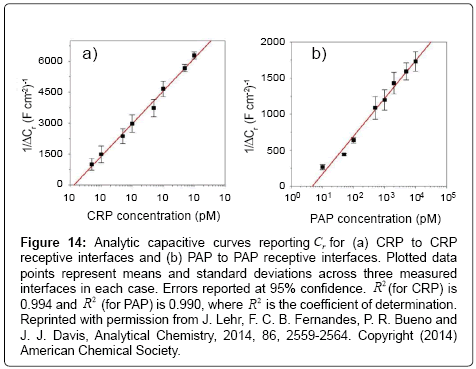
An improvement in assay capability was subsequently by Lehr et al. [108] using a different mixed SAM. In this case, the film comprised a thiol-PEG-CO2H (to antibody covalent attachment) and 11-ferrocenyl-undecanethiol (probe redox). Within the same work, the authors used a similar approach to establish a sensitive immunoassay for PAP (besides CRP), a prognostic marker for prostate cancer. Both markers were quantifiable across their clinically relevant ranges and in following redox capacitive changes as shown in Figures 13 and 14.
Figure 13: a) Nyquist impedimetric plot of Z " versus Z ' for a redox active, CRP-receptive film, where only minimal sensitivity to target binding is evident. The analogous capacitive response to CRP binding is shown in b) where a sensitive modulation in response to CRP is observed (Cr itself is obtained from the semicircle diameters). All plots are average curves obtained from three different working electrodes. Reproduced with permission from reference [102].
Figure 14: Analytic capacitive curves reporting Cr for (a) CRP to CRP receptive interfaces and (b) PAP to PAP receptive interfaces. Plotted data points represent means and standard deviations across three measured interfaces in each case. Errors reported at 95% confidence. R2 (for CRP) is 0.994 and R2 (for PAP) is 0.990, where R2 is the coefficient of determination. Reprinted with permission from J. Lehr, F. C. B. Fernandes, P. R. Bueno and J. J. Davis, Analytical Chemistry, 2014, 86, 2559-2564. Copyright (2014) American Chemical Society.
Conclusion
A diverse range of interfacial strategies exist which can support the sensitive detection of proteins, small molecules and specific cells. Of the methods which are quantifiable and sensitive without requiring pre-labelling of the analytes, those based on electroanalyses are undoubtedly the most flexible in format and capability whilst, additionally, being both cheap and scaleable. In this short review, we have introduced some of the principles associated with electroanalytical detection of biomarkers, most specifically soluble protein markers. We have introduced general principles, exemplified with a range of examples and discussed the fundaments of the impedance and impedance-derived capacitive approaches. Impedimetric approaches can be both straightforward and highly sensitive and have largely been faradaic. One major challenge has been to translate a capability in highly controlled buffered aqueous solution to more complex samples and we have given examples of where recent strategies have enabled exactly this. Capacitive methods can be exceptionally sensitive without any pre-dosing of the analytical solution with a reporting “probe”. This sensitivity can, however, be accompanied by a struggle to either predict observations or to make them reproducible. We have discussed a new analytical methodology based on impedance derived capacitance spectroscopy and shown, not only that this is potent in analyzing dielectric films generally but also that it can be combined with surface tethered redox reporters in establishing highly sensitive label free assays based on “capacitive charging” (redox capacitance).
References
- Mayeux R (2004) Biomarkers: potential uses and limitations. NeuroRx 1: 182-188.
- Strimbu K, Tavel JA (2010) What are biomarkers? Curr Opin HIV AIDS 5: 463-466.
- Biomarkers Definitions Working Group. (2001) Biomarkers and surrogate endpoints: preferred definitions and conceptual framework. Clin Pharmacol Ther 69: 89-95.
- Ruhaak LR, Miyamoto S, Lebrilla CB (2013) Developments in the identification of glycan biomarkers for the detection of cancer. Mol Cell Proteomics 12: 846-855.
- Fingerle G, Pforte A, Passlick B, Blumenstein M, Ströbel M, et al. (1993) The novel subset of CD14+/CD16+ blood monocytes is expanded in sepsis patients. Blood 82: 3170-3176.
- Montrose A, Cargou S, Nepveu F, Manczak R, Gué AM, et al. (2013) Impedimetric immunosensor for the detection of circulating pro-inflammatory monocytes as infection markers. Biosens Bioelectron 49: 305-311.
- Su X, Chew T, Li SFY (2000) Design and application of piezoelectric quartz crystal-based immunoassay. Analytical Sciences 16: 107-114.
- Speight RE, Cooper MA (2012) A survey of the 2010 quartz crystal microbalance literature. J Mol Recognit 25: 451-473.
- Wu AHB (2006) A selected history and future of immunoassay development and applications in clinical chemistry. Clinica Chimica Acta 369: 119-124.
- Berson SA, Yalow RS (2006) General principles of radioimmunoassay. 1968. Clin Chim Acta 369: 125-143.
- Safi MA (2010) An overview of various labeled assays used in medical laboratory diagnosis. Immune and non-immune assays. Saudi Med J 31: 359-368.
- Homola J (2008) Surface plasmon resonance sensors for detection of chemical and biological species. Chem Rev 108: 462-493.
- Šípová H, Homola J (2013) Surface plasmon resonance sensing of nucleic acids: a review. Anal Chim Acta 773: 9-23.
- Haab BB (2003) Methods and applications of antibody microarrays in cancer research. Proteomics 3: 2116-2122.
- Ray S, Mehta G, Srivastava S (2010) Label-free detection techniques for protein microarrays: prospects, merits and challenges. Proteomics 10: 731-748.
- Vashist SK, Vashist P (2011) Recent Advances in Quartz Crystal Microbalance-Based Sensors. Journal of Sensors 2011.
- Cooper MA, Singleton VT (2007) A survey of the 2001 to 2005 quartz crystal microbalance biosensor literature: applications of acoustic physics to the analysis of biomolecular interactions. J Mol Recognit 20: 154-184.
- Uludag Y, Tothill IE (2012) Cancer biomarker detection in serum samples using surface plasmon resonance and quartz crystal microbalance sensors with nanoparticle signal amplification. Anal Chem 84: 5898-5904.
- Garai-Ibabe G, Grinyte R, Golub EI, Canaan A, de la Chapelle ML, et al. (2011) Label free and amplified detection of cancer marker EBNA-1 by DNA probe based biosensors. Biosens Bioelectron 30: 272-275.
- Wang D, Chen G, Wang H, Tang W, Pan W, et al. (2013) A reusable quartz crystal microbalance biosensor for highly specific detection of single-base DNA mutation. Biosens Bioelectron 48: 276-280.
- Giménez-Romero D, Bueno PR, Pesquero NC, Monzó IS, Puchades R, et al. (2013) Elucidation of carbohydrate molecular interaction mechanism of recombinant and native ArtinM. J Phys Chem B 117: 8360-8369.
- Pesquero NC, Pedroso MM, Watanabe AM, Goldman MH, Faria RC, et al. (2010) Real-time monitoring and kinetic parameter estimation of the affinity interaction of jArtinM and rArtinM with peroxidase glycoprotein by the electrogravimetric technique. Biosens Bioelectron 26: 36-42.
- Pedroso MM, Watanabe AM, Roque-Barreira MC, Bueno PR, Faria RC (2008) Quartz Crystal Microbalance monitoring the real-time binding of lectin with carbohydrate with high and low molecular mass. Microchemical Journal 89: 153-158.
- Reddy PJ, Sadhu S, Ray S, Srivastava S (2012) Cancer biomarker detection by surface plasmon resonance biosensors. Clin Lab Med 32: 47-72.
- Song S, Wang L, Li J, Fan C, Zhao J (2008) Aptamer-based biosensors. TrAC Trends in Analytical Chemistry 27: 108-117.
- Kimmel DW, LeBlanc G, Meschievitz ME, Cliffel DE (2012) Electrochemical sensors and biosensors. Anal Chem 84: 685-707.
- Omidfar K, Khorsand F, Darziani Azizi M (2013) New analytical applications of gold nanoparticles as label in antibody based sensors. Biosens Bioelectron 43: 336-347.
- Hao N, Li H, long Y, Zhang L, Zhao X, et al. (2011) An electrochemical immunosensing method based on silver nanoparticles. Journal of Electroanalytical Chemistry 656: 50-54.
- Ju H, Zhang X, Wang J (2011) Nanomaterials for Immunosensors and Immunoassays. In NanoBiosensing, Springer, New York, 425-452.
- Pingarrón JM, Yáñez-Sedeño P and González-Cortés A (2008) Gold nanoparticle-based electrochemical biosensors. Electrochimica Acta 53: 5848-5866.
- Liu G, Lin Y (2007) Nanomaterial labels in electrochemical immunosensors and immunoassays. Talanta 74: 308-317.
- Huang H, Zhu JJ (2013) The electrochemical applications of quantum dots. Analyst 138: 5855-5865.
- Dai Y, Cai Y, Zhao Y, Wu D, Liu B, et al. (2011) Sensitive sandwich electrochemical immunosensor for alpha fetoprotein based on prussian blue modified hydroxyapatite. Biosens Bioelectron 28: 112-116.
- Larkin SE, Zeidan B, Taylor MG, Bickers B, Al-Ruwaili J, et al. (2010) Proteomics in prostate cancer biomarker discovery. Expert Rev Proteomics 7: 93-102.
- Wang L, Jia X, Zhou Y, Xie Q, Yao S (2010) Sandwich-type amperometric immunosensor for human immunoglobulin G using antibody-adsorbed Au/SiO2 nanoparticles. Microchimica Acta 168: 245-251.
- Zhang J, Liu B, Liu H, Zhang X, Tan W (2013) Aptamer-conjugated gold nanoparticles for bioanalysis. Nanomedicine (Lond) 8: 983-993.
- Liu Y (2008) Electrochemical detection of prostate-specific antigen based on gold colloids/alumina derived sol-gel film. Thin Solid Films 516: 1803-1808.
- Ho JA, Chang HC, Shih NY, Wu LC, Chang YF, et al. (2010) Diagnostic detection of human lung cancer-associated antigen using a gold nanoparticle-based electrochemical immunosensor. Anal Chem 82: 5944-5950.
- Chen ZP, Peng ZF, Zhang P, Jin XF, Jiang JH, et al. (2007) A sensitive immunosensor using colloidal gold as electrochemical label. Talanta 72: 1800-1804.
- Ma F, Ho C, Cheng AKH and Yu HZ (2013) Immobilization of redox-labeled hairpin DNA aptamers on gold: Electrochemical quantitation of epithelial tumor marker mucin 1. Electrochimica Acta 110: 139-145.
- Rodriguez MC, Kawde AN, Wang J (2005) Aptamer biosensor for label-free impedance spectroscopy detection of proteins based on recognition-induced switching of the surface charge. Chem Commun (Camb) : 4267-4269.
- Xiao Y, Lubin AA, Heeger AJ, Plaxco KW (2005) Label-free electronic detection of thrombin in blood serum by using an aptamer-based sensor. Angew Chem Int Ed Engl 44: 5456-5459.
- Willner I, Zayats M (2007) Electronic aptamer-based sensors. Angew Chem Int Ed Engl 46: 6408-6418.
- Mir M, Katakis I (2007) Aptamers as elements of bioelectronic devices. Mol Biosyst 3: 620-622.
- Radi AE, Acero Sánchez JL, Baldrich E, O'Sullivan CK (2006) Reagentless, reusable, ultrasensitive electrochemical molecular beacon aptasensor. J Am Chem Soc 128: 117-124.
- Xiao Y, Piorek BD, Plaxco KW, Heeger AJ (2005) A reagentless signal-on architecture for electronic, aptamer-based sensors via target-induced strand displacement. J Am Chem Soc 127: 17990-17991.
- Goda T, Miyahara Y (2013) Label-free and reagent-less protein biosensing using aptamer-modified extended-gate field-effect transistors. Biosens Bioelectron 45: 89-94.
- Kim CH, Ahn JH, Kim JY, Choi JM, Lim KC, et al. (2013) CRP detection from serum for chip-based point-of-care testing system. Biosens Bioelectron 41: 322-327.
- BÄ┬?nicÄ┬? FG (2012) 3. Enzymes and Enzymatic Sensors. In: Chemical Sensors and Biosensors, John Wiley & Sons, Ltd, Chichester, UK, 28-49.
- Newman JD, Setford SJ (2006) Enzymatic biosensors. Mol Biotechnol 32: 249-268.
- Yakovleva ME, Safina GR, Danielsson B (2010) A study of glycoprotein-lectin interactions using quartz crystal microbalance. Anal Chim Acta 668: 80-85.
- Bertok T, Klukova L, Sediva A, Kasák P, Semak V, et al. (2013) Ultrasensitive impedimetric lectin biosensors with efficient antifouling properties applied in glycoprofiling of human serum samples. Anal Chem 85: 7324-7332.
- Trilling AK, Beekwilder J, Zuilhof H (2013) Antibody orientation on biosensor surfaces: a minireview. Analyst 138: 1619-1627.
- Sassolas A, Blum LJ, Leca-Bouvier BD (2012) Immobilization strategies to develop enzymatic biosensors. Biotechnol Adv 30: 489-511.
- Zhang X, Yadavalli VK (2011) Surface immobilization of DNA aptamers for biosensing and protein interaction analysis. Biosens Bioelectron 26: 3142-3147.
- Bonanno LM, Delouise LA (2007) Steric crowding effects on target detection in an affinity biosensor. Langmuir 23: 5817-5823.
- Bonroy K, Frederix F, Reekmans G, Dewolf E, De Palma R, et al. (2006) Comparison of random and oriented immobilisation of antibody fragments on mixed self-assembled monolayers. J Immunol Methods 312: 167-181.
- Makaraviciute A, Ramanaviciene A (2013) Site-directed antibody immobilization techniques for immunosensors. Biosensors and Bioelectronics 50: 460-471.
- Wink T, van Zuilen SJ, Bult A, van Bennkom WP (1997) Self-assembled monolayers for biosensors. Analyst 122: 43R-50R.
- Chaki NK, Vijayamohanan K (2002) Self-assembled monolayers as a tunable platform for biosensor applications. Biosens Bioelectron 17: 1-12.
- Ferretti S, Paynter S, Russell DA, Sapsford KE, Richardson DJ (2000) Self-assembled monolayers: a versatile tool for the formulation of bio-surfaces. TrAC Trends in Analytical Chemistry 19: 530-540.
- Lee J, Seo J, Kim C, Kwon Y, Ha J, et al. (2013) A comparative study on antibody immobilization strategies onto solid surface. Korean Journal of Chemical Engineering 30: 1934-1938.
- Peluso P, Wilson DS, Do D, Tran H, Venkatasubbaiah M, et al. (2003) Optimizing antibody immobilization strategies for the construction of protein microarrays. Anal Biochem 312: 113-124.
- Wilson DS, Nock S (2002) Functional protein microarrays. Curr Opin Chem Biol 6: 81-85.
- Kausaite-Minkstimiene A, Ramanaviciene A, Kirlyte J, Ramanavicius A (2010) Comparative study of random and oriented antibody immobilization techniques on the binding capacity of immunosensor. Anal Chem 82: 6401-6408.
- Lue RY, Chen GY, Hu Y, Zhu Q, Yao SQ (2004) Versatile protein biotinylation strategies for potential high-throughput proteomics. J Am Chem Soc 126: 1055-1062.
- Orth R, Clark TG, Craighead HG (2003) Avidin-biotin micropatterning methods for biosensor applications. Biomedical Microdevices 5: 29-34.
- Lee JH, Choi HK, Chang JH (2010) Optimization of biotin labeling of antibodies using mouse IgG and goat anti-mouse IgG-conjugated fluorescent beads and their application as capture probes on protein chip. J Immunol Methods 362: 38-42.
- Love JC, Estroff LA, Kriebel JK, Nuzzo RG, Whitesides GM (2005) Self-assembled monolayers of thiolates on metals as a form of nanotechnology. Chem Rev 105: 1103-1169.
- Ulman A (1996) Formation and Structure of Self-Assembled Monolayers. Chem Rev 96: 1533-1554.
- Bueno PR, Gonçalves LM, dos Santos FC, dos Santos ML, Barros AA, et al. (2013) Electrogravimetric Analysis by Quartz-Crystal Microbalance on the consumption of the neurotransmitter acetylcholine by acetylcholinesterase. Analytical Letters 46: 258-265.
- Xu M, Luo X, Davis JJ (2013) The label free picomolar detection of insulin in blood serum. Biosens Bioelectron 39: 21-25.
- Alcantar NA, Aydil ES, Israelachvili JN (2000) Polyethylene glycol-coated biocompatible surfaces. J Biomed Mater Res 51: 343-351.
- Fernandes FCB, Santos A, Martins DC, Góes MS, Bueno PR (2014) Comparing label free electrochemical impedimetric and capacitive biosensing architectures. Biosens Bioelectron 57: 96-102.
- Fischer MJ (2010) Amine coupling through EDC/NHS: a practical approach. Methods Mol Biol 627: 55-73.
- Bryan T, Luo X, Bueno PR, Davis JJ (2013) An optimised electrochemical biosensor for the label-free detection of C-reactive protein in blood. Biosens Bioelectron 39: 94-98.
- López-Gallego F, Guisán JM, Betancor L (2013) Glutaraldehyde-Mediated Protein Immobilization. In: Immobilization of Enzymes and Cells 1051: 33-41.
- Huy TQ, Hanh NTH, Van Chung P, Anh DD, Nga PT, et al. (2011) Characterization of immobilization methods of antiviral antibodies in serum for electrochemical biosensors. Applied Surface Science 257: 7090-7095.
- Balamurugan S, Obubuafo A, Soper SA, Spivak DA (2008) Surface immobilization methods for aptamer diagnostic applications. Anal Bioanal Chem 390: 1009-1021.
- Katz E, Willner I (2004) Biomolecule-functionalized carbon nanotubes: applications in nanobioelectronics. ChemPhysChem 5: 1084-1104.
- Luz RAS, Iost RM, Crespilho FN (2013) Nanomaterials for Biosensors and Implantable Biodevices. Nanobioelectrochemistry 27-48.
- Serafín V, Agüí L, Yáñez-Sedeño P, Pingarrón JM (2014) Electrochemical immunosensor for the determination of insulin-like growth factor-1 using electrodes modified with carbon nanotubes-poly(pyrrole propionic acid) hybrids. Biosens Bioelectron 52: 98-104.
- Eissa S, L'Hocine L, Siaj M, Zourob M (2013) A graphene-based label-free voltammetric immunosensor for sensitive detection of the egg allergen ovalbumin. Analyst 138: 4378-4384.
- Justino CIL, Rocha-Santos TAP, Duarte AC (2013) Advances in point-of-care technologies with biosensors based on carbon nanotubes. TrAC Trends in Analytical Chemistry 45: 24-36.
- Jr RAC, Vaddiraju S, Chan PY, Seyta R, Jain FC (2011) Label-free protein detection based on vertically aligned carbon nanotube gated field-effect transistors. Sensors and Actuators B: Chemical 160: 154-160.
- Yu X, Chattopadhyay D, Galeska I, Papadimitrakopoulos F, Rusling JF (2003) Peroxidase activity of enzymes bound to the ends of single-wall carbon nanotube forest electrodes. Electrochemistry Communications 5: 408-411.
- Yu X, Kim SN, Papadimitrakopoulos F, Rusling JF (2005) Protein immunosensor using single-wall carbon nanotube forests with electrochemical detection of enzyme labels. Mol Biosyst 1: 70-78.
- Malhotra R, Patel V, Vaqué JP, Gutkind JS, Rusling JF (2010) Ultrasensitive electrochemical immunosensor for oral cancer biomarker IL-6 using carbon nanotube forest electrodes and multilabel amplification. Anal Chem 82: 3118-3123.
- Stoltenburg R, Reinemann C, Strehlitz B (2007) SELEX--a (r)evolutionary method to generate high-affinity nucleic acid ligands. Biomol Eng 24: 381-403.
- Yao C, Qi Y, Zhao Y, Xiang Y, Chen Q, et al. (2009) Aptamer-based piezoelectric quartz crystal microbalance biosensor array for the quantification of IgE. Biosens Bioelectron 24: 2499-2503.
- Luo X, Davis JJ (2013) Electrical biosensors and the label free detection of protein disease biomarkers. Chem Soc Rev 42: 5944-5962.
- Peters T (1996) All about Albumin: Biochemistry, Genetics, and Medical Applications. Academic Press: San Diego, California.
- Qureshi A, Gurbuz Y, Niazi JH (2012) Biosensors for cardiac biomarkers detection: A review. Sensors and Actuators B: Chemical 171–172: 62-76.
- Kirk JT, Brault ND, Baehr-Jones T, Hochberg M, Jiang S, et al. (2013) Zwitterionic polymer-modified silicon microring resonators for label-free biosensing in undiluted human plasma. Biosens Bioelectron 42: 100-105.
- Jiang S, Cao Z (2010) Ultralow-fouling, functionalizable, and hydrolyzable zwitterionic materials and their derivatives for biological applications. Adv Mater 22: 920-932.
- Zhao C, Li LY, Guo MM, Zheng J (2012) Functional polymer thin films designed for antifouling materials and biosenseors. Chemical Papers 66: 323-339.
- Vaisocherová H, Yang W, Zhang Z, Cao Z, Cheng G, et al. (2008) Ultralow Fouling and Functionalizable Surface Chemistry Based on a Zwitterionic Polymer Enabling Sensitive and Specific Protein Detection in Undiluted Blood Plasma. Anal Chem 80: 7894-7901.
- Goda T, Tabata M, Sanjoh M, Uchimura M, Iwasaki Y, et al. (2013) Thiolated 2-methacryloyloxyethyl phosphorylcholine for an antifouling biosensor platform. Chem Commun (Camb) 49: 8683-8685.
- Yang W, Xue H, Carr LR, Wang J, Jiang S (2011) Zwitterionic poly(carboxybetaine) hydrogels for glucose biosensors in complex media. Biosens Bioelectron 26: 2454-2459.
- Luo X, Xu M, Freeman C, James T, Davis JJ (2013) Ultrasensitive label free electrical detection of insulin in neat blood serum. Anal Chem 85: 4129-4134.
- Brault ND, Gao C, Xue H, Piliarik M, Homola J, et al. (2010) Ultra-low fouling and functionalizable zwitterionic coatings grafted onto SiO2 via a biomimetic adhesive group for sensing and detection in complex media. Biosens Bioelectron 25: 2276-2282.
- Fernandes FCB, Góes MS, Davis JJ, Bueno PR (2013) Label free redox capacitive biosensing. Biosens Bioelectron 50: 437-440.
- Guan JG, Miao YQ, Zhang QJ (2004) Impedimetric biosensors. J Biosci Bioeng 97: 219-226.
- Prodromidis MI (2010) Impedimetric immunosensors—A review. Electrochimica Acta 55: 4227-4233.
- Bryan T, Luo X, Forsgren L, Morozova-Roche LA, Davis JJ (2012) The robust electrochemical detection of a Parkinson's disease marker in whole blood sera. Chemical Science 3: 3468-3473.
- Jarocka U, Sawicka R, Góra-Sochacka A, Sirko A, Zagórski-Ostoja W, et al. (2014) Electrochemical immunosensor for detection of antibodies against influenza A virus H5N1 in hen serum. Biosens Bioelectron 55: 301-306.
- Qureshi A, Niazi JH, Kallempudi S, Gurbuz Y (2010) Label-free capacitive biosensor for sensitive detection of multiple biomarkers using gold interdigitated capacitor arrays. Biosens Bioelectron 25: 2318-2323.
- Lehr J, Fernandes FCB, Bueno PR, Davis JJ (2014) Label-free capacitive diagnostics: exploiting local redox probe state occupancy. Anal Chem 86: 2559-2564.
- Bourigua S, Hnaien M, Bessueille F, Lagarde F, Dzyadevych S, et al. (2010) Impedimetric immunosensor based on SWCNT-COOH modified gold microelectrodes for label-free detection of deep venous thrombosis biomarker. Biosens Bioelectron 26: 1278-1282.
- Canbaz MÇ, SimÅ┬?ek CS, Sezgintürk MK (2014) Electrochemical biosensor based on self-assembled monolayers modified with gold nanoparticles for detection of HER-3. Anal Chim Acta 814: 31-38.
- Hu Y, Zuo P, Ye BC (2013) Label-free electrochemical impedance spectroscopy biosensor for direct detection of cancer cells based on the interaction between carbohydrate and lectin. Biosens Bioelectron 43: 79-83.
- Ohno R, Ohnuki H, Wang H, Yokoyama T, Endo H, et al. (2013) Electrochemical impedance spectroscopy biosensor with interdigitated electrode for detection of human immunoglobulin A. Biosens Bioelectron 40: 422-426.
- Yang T, Wang S, Jin H, Bao W, Huang S, et al. (2013) An electrochemical impedance sensor for the label-free ultrasensitive detection of interleukin-6 antigen. Sensors and Actuators B: Chemical 178: 310-315.
- Seven B, Bourourou M, Elouarzaki K, Constant JF, Gondran C, et al. (2013) Impedimetric biosensor for cancer cell detection. Electrochemistry Communications 37: 36-39.
- Elshafey R, Tlili C, Abulrob A, Tavares AC, Zourob M (2013) Label-free impedimetric immunosensor for ultrasensitive detection of cancer marker Murine double minute 2 in brain tissue. Biosens Bioelectron 39: 220-225.
- Rajesh, Sharma V, Tanwar VK, Mishra SK, Biradar AM (2010) Electrochemical impedance immunosensor for the detection of cardiac biomarker Myogobin (Mb) in aqueous solution. Thin Solid Films 519: 1167-1170.
- Barton AC, Davis F, Higson SP (2008) Labeless immunosensor assay for prostate specific antigen with picogram per milliliter limits of detection based upon an ac impedance protocol. Anal Chem 80: 6198-6205.
- Ahmed A, Rushworth JV, Wright JD, Millner PA (2013) Novel impedimetric immunosensor for detection of pathogenic bacteria Streptococcus pyogenes in human saliva. Anal Chem 85: 12118-12125.
- Wang L, Kang B, Gao N, Du X, Jia L, et al. (2014) Corrosion behaviour of austenitic stainless steel as a function of methanol concentration for direct methanol fuel cell bipolar plate. Journal of Power Sources 253: 332-341.
- Salehisaki M, Aryana M (2014) Effect of microstructure on corrosion behavior of Ag-30Cu-27Sn alloy in vitro media. Applied Surface Science 297: 205-212.
- Hmamou DB, Salghi R, Zarrouk A, Hammouti B, Benali O, et al. (2013) Studies on the inhibitive effect of potassium ferrocyanide on the corrosion of steel in phosphoric acid. Research on Chemical Intermediates 39: 3475-3485.
- Montalvillo M, Silva V, Palacio L, Calvo JI, Carmona FJ, et al. (2014) Charge and dielectric characterization of nanofiltration membranes by impedance spectroscopy. Journal of Membrane Science 454: 163-173.
- Noack J, Cremers C, Bayer D, Tübke J, Pinkwart K (2014) Development and characterization of a 280cm2 vanadium/oxygen fuel cell. Journal of Power Sources 253: 397-403.
- Nguyen S, Lim JC, Lee JK (2014) Improving the performance of silicon anode in lithium-ion batteries by Cu2O coating layer. Journal of Applied Electrochemistry 44: 353-360.
- Antunes R, Jewulski J, Golec T (2013) Full Parametric Characterization of LSM/LSM-YSZ Cathodes by Electrochemical Impedance Spectroscopy. J Fuel Cell Sci Technol 11: 011007-011007.
- Daniels JS, Pourmand N (2007) Label-Free Impedance Biosensors: Opportunities and Challenges. Electroanalysis 19: 1239-1257.
- K'Owino IO, Sadik OA (2005) Impedance Spectroscopy: A Powerful Tool for Rapid Biomolecular Screening and Cell Culture Monitoring. Electroanalysis 17: 2101-2113.
- Berggren C, Bjarnason B, Johansson G (2001) Capacitive Biosensors. Electroanalysis 13: 173-180.
- Lisdat F, Schäfer D (2008) The use of electrochemical impedance spectroscopy for biosensing. Anal Bioanal Chem 391: 1555-1567.
- Macdonald JR (2003) Impedance spectroscopy. In Encyclopedia of Physical Science and Technology. 3rd edition, Academic Press, New York, 703-715.
- Esteban JM, Orazem ME (1991) On the application of the Kramersâ┬?┬ÉKronig relations to evaluate the consistency of electrochemical impedance data. Journal of The Electrochemical Society 138: 67-76.
- Bard AJ, Faulkner LR (2001) Electrochemical methods: fundamentals and aplications. 2nd edition, John Wiley & Sons, Inc.
- Bueno PR, Benites TA, Góes MS, Davis JJ (2013) A facile measurement of heterogeneous electron transfer kinetics. Anal Chem 85: 10920-10926.
- Qureshi A, Gurbuz Y, Niazi JH (2010) Label-free detection of cardiac biomarker using aptamer based capacitive biosensor. Procedia Engineering 5: 828-830.
- Bueno PR, Gabrielli C (2009) Electrochemistry, Nanomaterials and Nanostructures. In: Nanostructured Materials for Electrochemical Energy Production and Storage, Springer, New York, 81-149.
- Chang BY, Park SM (2010) Electrochemical impedance spectroscopy. Annu Rev Anal Chem (Palo Alto Calif) 3: 207-229.
- Góes MS, Rahman H, Ryall J, Davis JJ, Bueno PR (2012) A dielectric model of self-assembled monolayer interfaces by capacitive spectroscopy. Langmuir 28: 9689-9699.
- Johnson A, Song Q, Ko Ferrigno P, Bueno PR, Davis JJ (2012) Sensitive affimer and antibody based impedimetric label-free assays for C-reactive protein. Anal Chem 84: 6553-6560.
- Su L, Zou L, Fong CC, Wong WL, Wei F, et al. (2013) Detection of cancer biomarkers by piezoelectric biosensor using PZT ceramic resonator as the transducer. Biosens Bioelectron 46: 155-161.
- Wang H, Zhang Y, Yu H, Wu D, Ma H, et al. (2013) Label-free electrochemical immunosensor for prostate-specific antigen based on silver hybridized mesoporous silica nanoparticles. Analytical Biochemistry 434: 123-127.
- Chiriacò MS, Primiceri E, Montanaro A, de Feo F, Leone L, et al. (2013) On-chip screening for prostate cancer: an EIS microfluidic platform for contemporary detection of free and total PSA. Analyst 138: 5404-5410.
- Xu H, Gorgy K, Gondran C, Le Goff A, Spinelli N, et al. (2013) Label-free impedimetric thrombin sensor based on poly(pyrrole-nitrilotriacetic acid)-aptamer film. Biosens Bioelectron 41: 90-95.
- Ocaña C, del Valle M (2014) Signal amplification for thrombin impedimetric aptasensor: sandwich protocol and use of gold-streptavidin nanoparticles. Biosens Bioelectron 54: 408-414.
- Gratchev A, Sobenin I, Orekhov A, Kzhyshkowska J (2012) Monocytes as a diagnostic marker of cardiovascular diseases. Immunobiology 217: 476-482.
- Arya SK, Chornokur G, Venugopal M, Bhansali S (2010) Antibody functionalized interdigitated micro-electrode (IDmicroE) based impedimetric cortisol biosensor. Analyst 135: 1941-1946.
- Varshney M, Li Y (2009) Interdigitated array microelectrodes based impedance biosensors for detection of bacterial cells. Biosens Bioelectron 24: 2951-2960.
- Xu D, Xu D, Yu X, Liu Z, He W, et al. (2005) Label-free electrochemical detection for aptamer-based array electrodes. Anal Chem 77: 5107-5113.
- Tkac J, Davis JJ (2009) Label-free Field Effect Protein Sensing. In Engineering the Bioelectronic Interface: Applications to Analyte Biosensing and Protein Detection, The Royal Society of Chemistry, Cambridge, UK, 193-224.
- Radi AE, Acero Sánchez JL, Baldrich E, O'Sullivan CK (2005) Reusable impedimetric aptasensor. Anal Chem 77: 6320-6323.
- Berggren C, Johansson G (1997) Capacitance measurements of antibody-antigen interactions in a flow system. Anal Chem 69: 3651-3657.
- Limbut W, Kanatharana P, Mattiasson B, Asawatreratanakul P, Thavarungkul P (2006) A comparative study of capacitive immunosensors based on self-assembled monolayers formed from thiourea, thioctic acid, and 3-mercaptopropionic acid. Biosens Bioelectron 22: 233-240.
- Limbut W, Kanatharana P, Mattiasson B, Asawatreratanakul P, Thavarungkul P (2006) A reusable capacitive immunosensor for carcinoembryonic antigen (CEA) detection using thiourea modified gold electrode. Analytica Chimica Acta 561: 55-61.
- Dijksma M, Kamp B, Hoogvliet JC, van Bennekom WP (2001) Development of an electrochemical immunosensor for direct detection of interferon-gamma at the attomolar level. Anal Chem 73: 901-907.
- Lin KC, Kunduru V, Bothara M, Rege K, Prasad S, et al. (2010) Biogenic nanoporous silica-based sensor for enhanced electrochemical detection of cardiovascular biomarkers proteins. Biosens Bioelectron 25: 2336-2342.
- Büttiker M, Thomas A, Prêtre A (1993) Mesoscopic capacitors. Phys Lett A 180: 364-369.
- Bueno PR, Davis JJ (2014) Measuring quantum capacitance in energetically addressable molecular layers. Anal Chem 86: 1337-1341.
- Bueno PR, Davis, JJ (2014) Elucidating redox level dispersion and local dielectric effects within electroactive molecular films. Anal Chem 86: 1977-2004.
- Bueno PR, Mizzon G, Davis JJ (2012) Capacitance spectroscopy: a versatile approach to resolving the redox density of states and kinetics in redox-active self-assembled monolayers. J Phys Chem B 116: 8822-8829.
- Bueno PR, Fabregat-Santiago F, Davis JJ (2013) Elucidating capacitance and resistance terms in confined electroactive molecular layers. Anal Chem 85: 411-417.
- Lin J, Merzlyakov M, Hristova K, Searson PC (2008) Impedance spectroscopy of bilayer membranes on single crystal silicon. Biointerphases 3: FA33.
- Lin J, Szymanski J, Searson PC, Hristova K (2010) Electrically addressable, biologically relevant surface-supported bilayers. Langmuir 26: 12054-12059.
- Romaner L, Heimel G, Ambrosch-Draxl C, Zojer E (2008) The Dielectric Constant of Self-Assembled Monolayers. Adv Funct Mater 18: 3999-4006.
- Sondag-Huethorst JAM, Fokkink LGJ (1995) Electrochemical Characterization of Functionalized Alkanethiol Monolayers on Gold. Langmuir 11: 2237-2241.
Relevant Topics
Recommended Journals
Article Tools
Article Usage
- Total views: 25780
- [From(publication date):
specialissue-2015 - Aug 31, 2025] - Breakdown by view type
- HTML page views : 20139
- PDF downloads : 5641

