Gene Expression Profiling Reveals Novel Biomarkers for Predicting Cardiovascular Risk in End-Stage Renal Disease Patients
Received: 07-Mar-2025 / Manuscript No. DPO-25-162167 / Editor assigned: 10-Mar-2025 / PreQC No. DPO-25-162167 / Reviewed: 24-Mar-2025 / QC No. DPO-25-162167 / Revised: 31-Mar-2025 / Manuscript No. DPO-25-162167 / Accepted Date: 07-Apr-2025 / Published Date: 07-Apr-2025 QI No. / DPO-25-162167
Abstract
Objective: End-Stage Renal Disease (ESRD) can increase the risk of Cardiovascular disease (CV). We aimed to investigate the pathways and mechanisms associated with potential protective genes linked to CV (CVP).
Methods: We conducted a systematic bioinformatics analysis using publicly available datasets from the Gene Expression Omnibus (GEO). Differentially Expressed Genes (DEGs) were identified in patients with ESRD with and without arrhythmia using stringent statistical criteria. Functional enrichment analyses were performed using the Gene Ontology (GO) and Kyoto Encyclopedia of Genes and Genomes (KEGG) pathways to elucidate the biological roles of these DEGs. The identified biomarker expression levels were verified by employing RT-qPCR with clinical samples.
Results: Our analysis revealed a distinct set of DEGs in ESRD patients with arrhythmia compared to those without arrhythmia. GO and KEGG pathway analyses indicated that these DEGs were involved in key biological processes and pathways relevant to cardiovascular disorders and renal function, including wound healing, platelet activation, and fluid-level regulation. Moreover, this study identified four downregulated genes (ABLIM3, TREML1, VCL and AVPR1A) and two upregulated genes (BHLHA15 and FZD8), which exhibited significant alterations in expression levels, with some showing robust discriminatory power, as evidenced by high Area Under the Curve (AUC) values in Receiver Operating Characteristic (ROC) curve analysis for predicting patients without CV risks. Finally, the expression of these identified genes in clinical samples was validated by RT-qPCR, which was consistent with the result of public database.
Conclusion: We found significant expression changes and high discriminatory power for predicting CV risk among patients with ESRD. This study highlights these genes' potential as biomarkers and therapeutic targets, providing new insights into the molecular mechanisms linking ESRD and arrhythmia, and paving the way for improved patient outcomes
Keywords: End stage renal disease; ESRD; Arrhythmias; circRNA; Gene expression omnibus
Introduction
Arrhythmias pose a significant health burden for patients with End-Stage Renal Disease (ESRD), contributing to increased morbidity and mortality rates [1]. Despite advances in dialysis techniques and supportive care, the incidence of arrhythmias remains high in this population, highlighting the need for effective predictive tools and targeted interventions [2]. Current studies have primarily focused on traditional risk factors such as electrolyte imbalance, inflammation, and autonomic dysfunction[3]. However, recent advancements in molecular biology have opened new avenues for exploring genetic markers that may predict arrhythmia risk in ESRD patients [4,5]. Genetic associations with arrhythmias in ESRD have been explored to varying degrees, and several studies have identified polymorphisms in related genes [6,7]. Recent studies have emphasized the importance of including diverse populations in genomic investigations to clarify the genetic landscape of cardiac arrhythmias and reduce health disparities in genomic medicine[8]. Other studies have identified genes related to ion channels and cardiac conduction pathways and highlighted gene regions associated with ion channel function, as well as cardiac development and sarcomere as important potential effectors of supraventricular tachycardia susceptibility[9]. Therefore, cardiac arrhythmia may be closely associated with genetic polymorphisms. However, the association between polymorphisms and arrhythmias remains unclear.
Although Single-Nucleotide Polymorphisms (SNPs) have been implicated, the role of non-coding RNAs, particularly circular RNAs (circRNAs), remains largely underexplored [10,11]. CircRNAs, a class of stable, covalently closed RNA molecules, have emerged as potential biomarkers for various diseases owing to their unique properties and stability in bodily fluids [12,13]. Given their involvement in gene regulation and cellular processes, understanding the role of circRNAs in arrhythmia risk could provide novel insights into disease mechanisms and offer new targets for therapeutic interventions.
Identifying plasma biomarkers for arrhythmia risk in ESRD patients is of considerable significance. Plasma biomarkers offer a minimally invasive approach for patient monitoring and can potentially enable early detection and personalized treatment strategies [14]. Recent studies have shown that circulating circRNAs exhibit differential expression patterns under various cardiovascular conditions, suggesting their potential as diagnostic and prognostic markers [15].
By leveraging comprehensive bioinformatics analysis, including Gene Expression Omnibus (GEO) datasets, Gene Ontology (GO) analysis, and Kyoto Encyclopedia of Genes and Genomes (KEGG) pathway analysis, this study aimed to identify novel circRNA biomarkers that could predict arrhythmia risk in ESRD patients [16]. Such biomarkers could enhance clinical decision making and improve patient outcomes by facilitating timely intervention and personalized medicine approaches.
In this study, we characterized the plasma-specific transcriptome of patients with Chronic Kidney Disease (CKD) and End-Stage Renal Disease (ESRD) using RNA sequencing. Subsequently, integrated bioinformatics analysis was conducted to examine molecular alterations in plasma. Our findings revealed several candidate genes and pathways linked to non-cardiac conditions in patients with ESRD, and the differential expression of these genes was validated.
Materials and Methods
Sample collection, data processing and gene screening
Three Gene Expression Omnibus (GEO) datasets, GSE133420 (including five normal subjects and five patients with atrial fibrillation) and GSE97709 (including eight healthy controls, nine ESRD with Cardiovascular disease (CV) events, seven ESRD and 10 ESRD without CV events) were downloaded from the GEO website (https://www. ncbi.nlm.nih.gov/geo/). GSE133420 was used as an external validation dataset [17]. R packages were used to identify differences between the normal health groups and ESRD patients with or without CV. The differential screening parameter was set as p<0.05, False Discovery Rate (FDR) <0.05, and fold change |(log FC)| >2 to obtain the Differentially Expressed Genes (DEGs) for further analysis. Heatmaps, volcano plots, and boxplot charts were plotted using “heatmap” and “ggplot2” R packages.
Functional enrichment, Protein-Protein Interaction (PPI) network analysis and key CVP genes identification
The GO and KEGG pathway enrichment analyses were conducted using the “enrichplot” R package. Cell composition, biological processes, and molecular functions were included in GO analysis. To investigate the interactions among the DEGs and identify potential key genes, we established a PPI network using data from the STRING database[18]. PPI network construction was performed using a minimum required interaction score with high confidence (0.9). Furthermore, for the identification of hub genes, the cytoHubba plugin of Cytoscape[19] was employed using the following criteria: The ten highest-ranked nodes according to degree, visualization settings, initial-stage nodes, and the shortest pathways.
To identify the candidate CVP genes, we performed an intersection analysis between the most significantly regulated genes and the previously determined hub genes. The predictive accuracy of these CVP genes for cardiovascular-free risk was subsequently evaluated using Receiver Operating Characteristic (ROC) curve analysis. The initial validation was performed using external datasets. We drew the ROC curve of the expression levels of autophagy-related genes in DM using the “pROC” package. Furthermore, we confirmed the reliability of these findings through validation with clinical samples.
RNA extraction and RT-qPCR
Total RNA was isolated from whole-blood samples, collected from ten healthy participants and HCM patients respectively, using the Nuclezol LS RNA Isolation Reagent in accordance with the manufacturer’s instructions (ABP Biosciences Inc.). The extracted RNA was then reverse-transcribed into cDNA using the Surescript First-Strand cDNA Synthesis Kit (GeneCopoeia), following the provided protocol. Quantitative PCR was subsequently performed utilizing the BlazeTaq SYBR Green qPCR Mix 2.0 (GeneCopoeia). The thermal cycling conditions were as follows: an initial denaturation at 95°C for 30 seconds, followed by 30 cycles of 10 seconds at 95°C (denaturation), 20 seconds at 60°C (annealing), and 30 seconds at 72°C (extension). Gene expression levels were quantified using the 2-ΔΔCT method, normalized to GAPDH. The primer sequences used in this study were listed below (5’- 3’): ABLIM3 forward: 5'-CCACCTTTGGGTCTGGAGAT-3', reverse: 5'- ATATCTGGTCCTGGCTCTGC-3'; TREML1 forward: 5'-GGGCACTCCCAAAGAATTGA-3', reverse: 5'-TGAAGGAGGAAGGTAGAGTGC-3'; VCL forward: 5'- GACCAGTCTCCCAAGACTCC-3', reverse: 5'- AACTGCCCTGACACACACTA-3'; AVPR1A forward: 5'- TGCTACGGCTTCATCTGCTA-3', reverse: 5'-GAAATGGACTTCACGCTGCT-3'; BHLHA15 forward: 5'-GGGCTCAGCATCCTCATTTG-3', reverse: 5'- TGGCAGCTCCAATCATCTCT-3'; FZD8 forward: 5'- GACCAGTCTCCCAAGACTCC-3', reverse: 5'-TTGTAGCCGATGCCCTTACA-3'; GAPDH forward: 5'-CCCATCACCATCTTCCAGG-3', reverse: 5'-CATCACGCCACAGTTTCCC-3'.
Statistical analysis
All bioinformatic and Pearson’s correlation analyses were performed using R software (http://www.R-project.org). The ROC curve was conducted with “glmnet” package in R software to estimate the specificity and sensitivity of potential biomarkers. A p value less than .05 was considered at significant.
Results
Identification of Differential Expression Genes (DEGs) associated with ESRD patients with (ESRD_CV) or without (ESRD) CV.
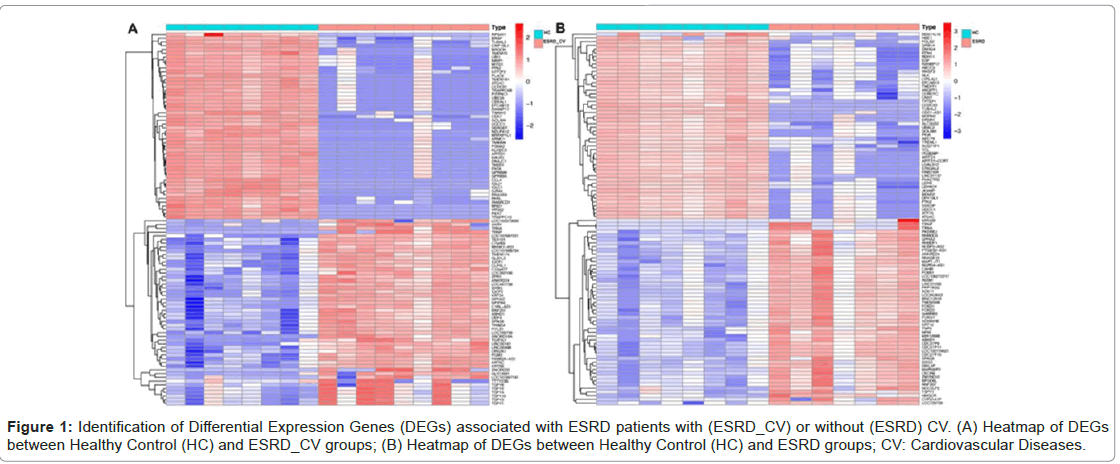
To identify DEGs, we first identified the differentially expressed genes (DEGs) in GEO datasets (GSE97709). There were 5,705 DEGs between Healthy Controls (HC) and ESRD_CV (Figure 1 A) and 4,029 DEGs between healthy controls (HC) and ESRD (Figure 1 B) that met the criteria based on a difference multiple of |Fold Change| ≥ 2 and p-value < .05 (Figure 1A-1B).
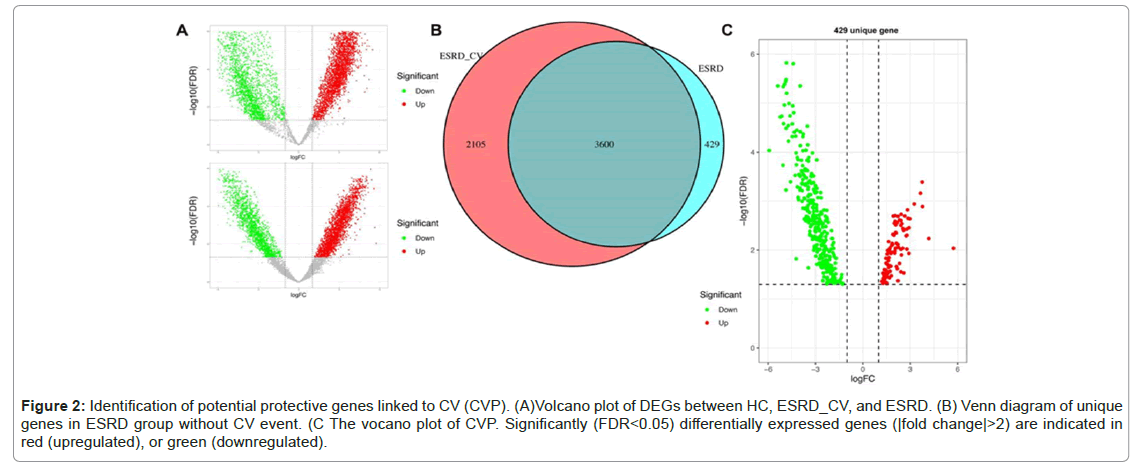
Figure 2 shows the upregulated and downregulated DEGs in these groups (Figure 2A). Through Venn diagram analysis, unique DEGs with no CV events were identified. As shown in Figure 2B, there were 429 DEGs in the ESRD group, of which 97 were upregulated and 335 were downregulated (Figure 2A-2C).Diseases
Figure 2: Identification of potential protective genes linked to CV (CVP). (A)Volcano plot of DEGs between HC, ESRD_CV, and ESRD. (B) Venn diagram of unique genes in ESRD group without CV event. (C The vocano plot of CVP. Significantly (FDR<0.05) differentially expressed genes (|fold change|>2) are indicated in red (upregulated), or green (downregulated).
CVP genes deviation, PPI network and identification of hub genes
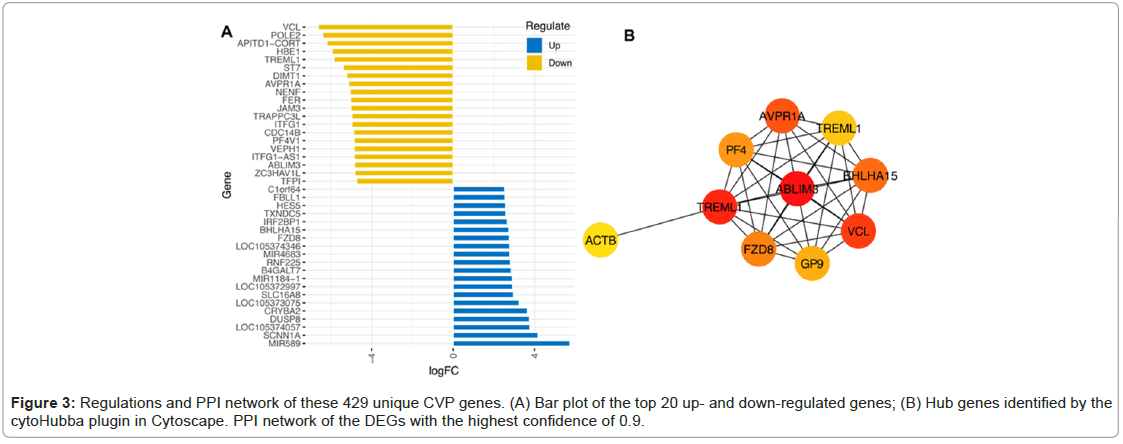
As shown in Figure 3A, the top 20 genes were identified (Figure 3A). The PPI network was built using the STRING software. Figure 3B indicated the PPI network with a confidence level of 0.9. Among all network genes, ABLIM3, TREML1, VCL, AVPR1A, BHLHA15 and FZD8 were the most regulated shared gene and identified as hub CVP genes as shown in Figure 3A and 3B.
GO analysis of differently expressed CVP genes
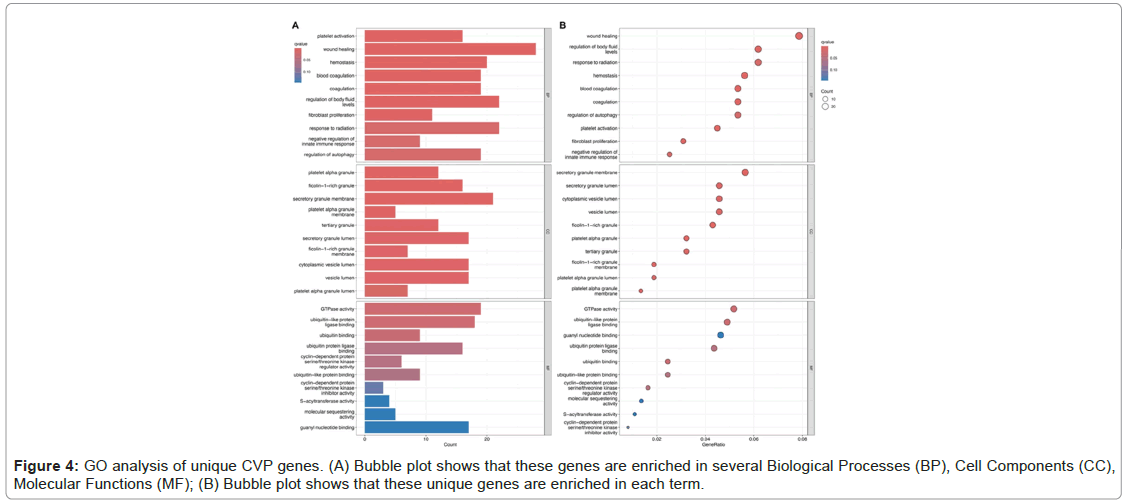
Through GO enrichment analysis of differentially expressed CVP genes, we identified several biological functions, the CVP genes were highly enriched in wound healing, regulation of body fluid levels, and response to radiation in the BP group. In CC analysis, these genes were highly enriched in the secretory granule membrane, secretory granule lumen, and cytoplasmic vesicle lumen. Moreover, MF analysis indicated significant enrichment in GTPase activity, ubiquitin-like protein ligase binding and guanyl nucleotide binding (Figure 4).
Results of the KEGG pathway analysis for CVP genes
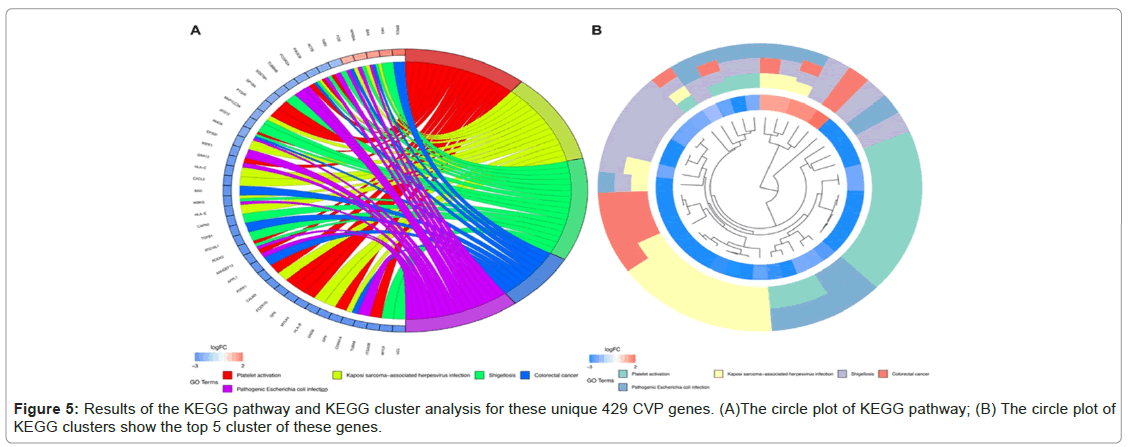
KEGG pathway enrichment analysis revealed that these differentially expressed CVP genes were significantly enriched in platelet activation, Kaposi sarcoma-associated herpesvirus infection, shigellosis, colorectal cancer, and Pathogenic Escherichia coli infection. KEGG pathway cluster analysis validated the enrichment results (Figure 5A and 5B).
Evaluation of 4 down- and 2 up-regulated CVP genes in predicting patients with no CV risks
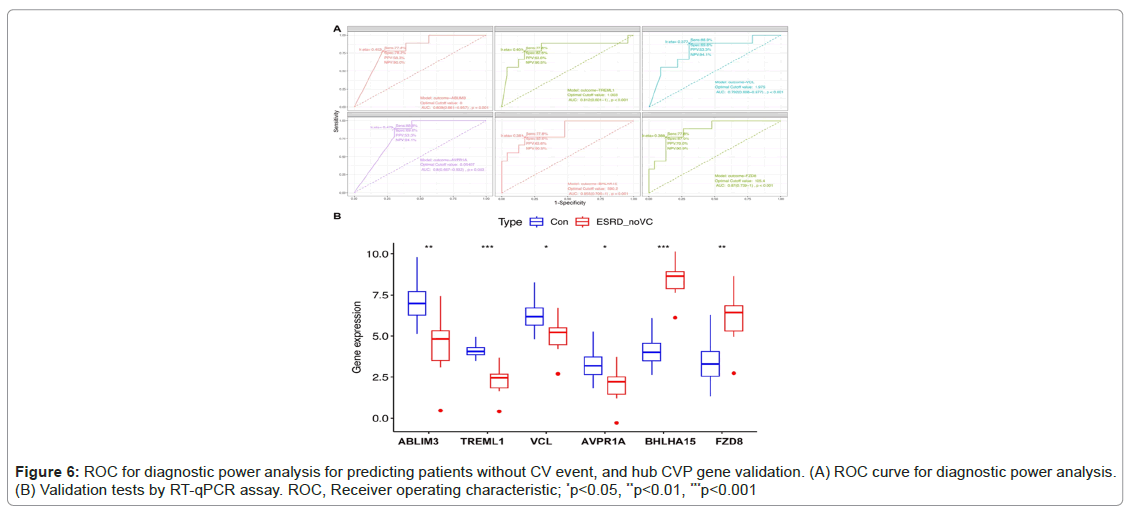
The shared genes were identified as ABLIM3, TREML1, VCL, AVPR1A, BHLHA15 and FZD8. ROC curves were used to assess the expression levels of CVP genes in plasma to demonstrate the diagnostic usefulness of CV risks. For the downregulated group, the Area Under the Curve (AUC) values for patients with no CV events when compared with patients with ESRD with CV events and healthy controls ranged from 0.792 to 0.812 (p<.01), as shown in Figure 6.
Figure 6A also exhibited that for the two up-regulated CVP genes, the area under the curve (AUC) values for patients with no CV events when compared with patients of ESRD with CV event and healthy controls were from 0.855 to 0.87 (p<.001) (Figure 6A). These hub CVP genes were further validated using RT-qPCR assays with clinical samples, which demonstrated statistically significant differences in expression levels (Figures 6A and 6B).
Discussion
Ideal cardiovascular health has been associated with reduced CV risk and mortality; however, its association with genetic variations remains unclear. This study sheds light on the potential utility of a panel of DEGs as biomarkers for predicting CV risk in patients with ESRD. By leveraging bioinformatics tools and databases, we identified specific genes and pathways that warrant further investigation for their roles in CV protection and disease progression. Previous studies concluded that gene regions associated with ion channel function, cardiac development, and sarcomeres are important potential effectors of supraventricular tachycardia susceptibility [19]. Therefore, the genetic determinants and molecular mechanisms of CV are being gradually revealed in the progression of heart disease. The rate of removal of body fluid significantly correlated with prolongation of the total filtered P-Wave Duration (PWD), which is a predictor of arrhythmias [20]. Our GO analysis revealed that the identified CVP genes were significantly enriched in the biological processes regulating body fluid levels.
Body fluid overload is a common complication in patients with Chronic Kidney Disease (CKD) and ESRD [21]. Studies have revealed that the occurrence of CV is independently associated with fluid overload, which is common among ESRD patients [22]. It can exacerbate heart failure and increase the risk of arrhythmia. Genes that regulate fluid excretion and reabsorption can help prevent fluid overload, thereby reducing the risk of these complications [23]. Moreover, genes that enhance renal function by promoting diuresis or inhibiting fluid reabsorption can improve overall health of the cardiovascular system. Efficient kidney function ensures that excess fluids are removed, thereby reducing the workload on the heart and preventing fluid accumulation. Active systemic inflammation management might have favorable effects in reducing the arrhythmia burden [24]. Studies have also found that inflammatory activation is increasingly recognized as a non-conventional risk factor for arrhythmias [25]. Bi et al., explored the mechanistic links between inflammatory cytokine-induced molecular and cellular influences and inflammation-associated ventricular arrhythmias [26]. Our GO analysis revealed that CVP genes were also enriched in wound healing and response to radiation. These processes are involved in pro-inflammatory micro particles, pro-inflammatory cytokines and oxidative stress, which may simultaneously induce and aggravate recurrent CV [27]. Additionally, cellular component analysis highlighted enrichment in the secretory granule membrane lumen, suggesting a role in extracellular signaling and transport. Molecular Function (MF) enrichment in GTPase activity, ubiquitin-like protein ligase binding and guanyl nucleotide binding indicates potential regulatory functions that could influence CV [28,29].
KEGG pathway enrichment analysis identified significant pathways, such as platelet activation, which play a crucial role in thrombotic events and atherosclerosis [30,31]. For example, platelet aggregation and activation are pivotal in the development of acute coronary syndromes [32,33]. Furthermore, the involvement of pathways related to infections (e.g., Kaposi sarcoma-associated herpesvirus, shigellosis and pathogenic Escherichia coli) underscores the importance of immune responses in CV disease progression [34]. ABLIM3, which is involved in the cell adhesion molecules pathway [35], has been potentially linked to myocardial function. VCL, a gene encoding vinculin, is essential for cell adhesion and migration and plays a role in the development of hypertrophic cardiomyopathy [36]. The upregulation of FZD8, a receptor involved in the Wnt/β-catenin signaling pathway, could indicate a compensatory mechanism to promote cell survival and repair [37].
Furthermore, we identified upregulated miRNA-4683 and an unknown gene, LOC105372997. The upregulation of miRNA-4683 and LOC105372997 may be associated with the absence of CV in ESRD patients and more studies are needed to confirm the relevant mechanism of these two genes in protecting against the non-occurrence of CV in ESD patients. Understanding the molecular mechanisms underlying these interactions provides valuable insights into the pathophysiology of CV risk in ESRD patients. Our findings could facilitate the development of targeted therapies and personalized medical approaches aimed at reducing CV complications. While our study provides a strong foundation for understanding the potential mechanisms of non-CV in patients with ESRD, it is important to acknowledge the limitations inherent in a purely bioinformatics approach. The lack of experimental validation and the potential for false positives owing to the complexity of biological systems are significant considerations. Future studies should focus on validating these findings through wet lab experiments and clinical trials to confirm the clinical utility of these biomarkers.
Conclusion
Our study identified distinct DEGs in ESRD patients withCV arrhythmia, revealing their involvement in key biological processesCV like wound healing and platelet activation. Specifically, we found fourCV downregulated genes (ABLIM3, TREML1, VCL and AVPR1A) and twoCV upregulated genes (BHLHA15, FZD8), showing significant expressionCV changes and high discriminatory power for predicting CV risk. TheseCV findings were validated by RT-qPCR on clinical samples, confirmingCV the public database results. This study highlights these genes' potentialCV as biomarkers and therapeutic targets, providing new insights into theCV molecular mechanisms linking ESRD and arrhythmia and paving theCV way for improved patient outcomes.
Declarations
Acknowledgements
The authors would like to thank the participants and GEOCV Project for its valuable contributions to this research.
Data Availability
Data is provided within the manuscript.
Author Contributions Statement
F.L. solely conducted the bioinformatics analysis,CV performed RT-qPCR validation, analyzed the data and wroteCV the manuscript. She identified and validated the differentiallyCV expressed genes associated with cardiovascular risk in ESRDCV patients, contributing all aspects of this research.
Conflict of Interests
The authors declare no conflicts of interest regarding theCV publication of this paper.
Ethics Statement
Not applicable.
Funding Statement
None.
Clinical Trial Number
Not applicable (Since the study used leftover blood samplesCV from patients for testing and we have signed informed consentCV forms and obtained approval from the hospital's ethicsCV committee, an application for clinical trial is not applicable).
Data availability
The data presented in this study are openly available in theCV GEO database (https://www.ncbi.nlm.nih.gov/geo/).
References
- Czifra A, Páll A, Sebestyén V, Barta K, Lőrincz I, et al. (2015) End stage renal disease and ventricular arrhythmia. Hemodialysis and hemodiafiltration differently affect ventricular repolarization. Orv Hetil 156:463-471.
[Crossref] [Google Scholar] [PubMed]
- Karaboyas A, Zee J, Brunelli SM, Usvyat LA, Weiner DE, et al. (2017) Dialysate potassium, serum potassium, mortality and arrhythmia events in hemodialysis: Results from the Dialysis Outcomes and Practice Patterns Study (DOPPS). Am J Kidney Dis 69:266-277.
[Crossref] [Google Scholar] [PubMed]
- Kim YG, Kim DY, Roh SY, Jeong JH, Lee HS, et al. (2024) Alcohol and the risk of all-cause death, atrial fibrillation, ventricular arrhythmia and sudden cardiac arrest. Sci Rep 14:5053.
[Crossref] [Google Scholar] [PubMed]
- Zeljkovic I, Gauthey A, Manninger M, Malaczynska-Rajpold K, Tfelt-Hansen J, et al. (2024) Genetic testing for inherited arrhythmia syndromes and cardiomyopathies: Results of the European heart rhythm association survey. Europace 26:216.
[Crossref] [Google Scholar] [PubMed]
- Aschner A, Keller A, Williams A, et al. (2024) Cardiac arrhythmia and epilepsy genetic variants in sudden unexpected death in epilepsy. Front Neurol 15:1386730.
- Mareddy C, Thomas ScM, McDaniel G, Monfredi O (2022) Exercise in the genetic arrhythmia syndromes-A review. Clin Sports Med 41:485-510.
[Crossref] [Google Scholar] [PubMed]
- Young WJ, Haessler J, Benjamins JW, Repetto L, Yao J, et al. (2023) Genetic architecture of spatial electrical biomarkers for cardiac arrhythmia and relationship with cardiovascular disease. Nat Commun 14:1411.
- Qafoud F, Elshrif M, Kunji K, Althani A, Salam A, Al Suwaidi J, et al. (2024) Genetic susceptibility to arrhythmia phenotypes in a middle eastern cohort of 14,259 whole-genome sequenced individuals. J Clin Med 13:1102.
[Crossref] [Google Scholar] [PubMed]
- Weng LC, Khurshid S, Hall AW, Nauffa V, Morrill VN, et al. (2024) Meta-analysis of genome-wide association studies reveals genetic mechanisms of supraventricular arrhythmias. Circ Genom Precis Med 17:e004320.
[Crossref] [Google Scholar] [PubMed]
- Lin H, Yao T, Ding H, Chu J, Yuan D et al. (2024) Identification and functional characterization of differentially expressed circRNAs in high glucose treated endothelial cells: Construction of circRNA-miRNA-mRNA network. Heliyon 10:e37028.
- Saadh MJ, Ehymayed HM, Alazzawi TS, Fahdil AA, Athab ZH, et al. (2024) Role of circRNAs in regulating cell death in cancer: A comprehensive review. Cell Biochem Biophys. 2024.
[Crossref] [Google Scholar] [PubMed]
- Liu X, Zhang Y, Yuan W, Han R, Zhong J, et al. (2024) Exosomal circrnas in circulation serve as diagnostic biomarkers for acute myocardial infarction. Front Biosci (Landmark Ed) 29:149.
[Crossref] [Google Scholar] [PubMed]
- Gan W, Song W, Gao Y, Zheng X, Wang F, et al. (2024) Exosomal circRNAs in the plasma serve as novel biomarkers for IPF diagnosis and progression prediction. J Transl Med 22:264.
[Crossref] [Google Scholar] [PubMed]
- Liu S, Park T, Kruger DM, Chaudhuri S, Cho MY, et al. (2024) Plasma miRNAs across the Alzheimer's disease continuum: Relationship to central biomarkers. Alzheimers Dement 20:7698-7714.
[Crossref] [Google Scholar] [PubMed]
- Beydoun MA, Beydoun HA, Hu YH, Hooten NN, Song M, et al. (2024) Plasma proteomic biomarkers and the association between poor cardiovascular health and incident dementia: The UK Biobank study. Brain Behav Immun 119:995-1007.
[Crossref] [Google Scholar] [PubMed]
- Kanehisa M, Furumichi M, Sato Y, Kawashima M, Watanabe IM, et al. (2023) KEGG for taxonomy-based analysis of pathways and genomes. Nucleic Acids Res 51(D1):D587-D592.
[Crossref] [Google Scholar] [PubMed]
- Lai CF, Chen YT, Gu J, Nerbonne JM, Lin CH, et al. (2019) Circulating long noncoding RNA DKFZP434I0714 predicts adverse cardiovascular outcomes in patients with end-stage renal disease. Int J Cardiol 277:212-219.
[Crossref] [Google Scholar] [PubMed]
- Szklarczyk D, Gable AL, Nastou KC, Lyon D, Kirsch R, et al. (2021) The STRING database in 2021: Customizable protein-protein networks, and functional characterization of user-uploaded gene/measurement sets. Nucleic Acids Res 49(D1):D605-D612.
[Crossref] [Google Scholar] [PubMed]
- Shannon P, Markiel A, Ozier O, Baliga NS, Wang JT, et al. (2003) Cytoscape: A software environment for integrated models of biomolecular interaction networks. Genome Res 13:2498-2504.
[Crossref] [Google Scholar] [PubMed]
- Shimada K, Tomita T, Kamijo Y, Higuchi M, Ito K, et al. (2012) Hemodialysis-induced P-wave signal-averaged electrocardiogram alterations are indicative of vulnerability to atrial arrhythmias. Circ J 76:612-617.
[Crossref] [Google Scholar] [PubMed]
- Tan JK, Kadir HA, Lim GH, Thumboo J, Bee YM, et al. (2024) Trends in fluid overload-related hospitalisations among patients with diabetes mellitus the impact of chronic kidney disease. Ann Acad Med Singap 53:435-445.
[Crossref] [Google Scholar] [PubMed]
- Kaartinen K, Rautavaara J, Aitkoski A, Anttonen O, Ahvonen J, et al. (2020) Fluid overload is an independent predictor of atrial fibrillation in end-stage renal disease: A prospective study using insertable cardiac and body composition monitors. Clin Nephrol 94:127-134.
[Crossref] [Google Scholar] [PubMed]
- Enger TB, Pleym H, Stenseth R, Wahba A, Videm V, et al. (2014) Genetic and clinical risk factors for fluid overload following open-heart surgery. Acta Anaesthesiol Scand 58:539-548.
[Crossref] [Google Scholar] [PubMed]
- Yang X, Zhao S, Wang S, Cao X, Xu Y, et al. (2023) Systemic inflammation indicators and risk of incident arrhythmias in 478,524 individuals: Evidence from the UK Biobank cohort. BMC Med 21:76.
[Crossref] [Google Scholar] [PubMed]
- Lazzerini PE, Abbate A, Boutjdir M, Capecchi PL (2023) Fir(e)ing the rhythm: Inflammatory cytokines and cardiac arrhythmias. JACC Basic Transl Sci 8:728-750.
[Crossref] [Google Scholar] [PubMed]
- Bi X, Zhang S, Jiang H, Ma W, Li Y, et al. (2022) Mechanistic insights into inflammation-induced arrhythmias: A simulation study. Front Physiol 13:843292.
[Crossref] [Google Scholar] [PubMed]
- Li X, Guo D, Zhou H, Hu Y, Fang X, et al. (2021) Interplay of pro-inflammatory cytokines, pro-inflammatory microparticles and oxidative stress and recurrent ventricular arrhythmias in elderly patients after coronary stent implantations. Cytokine 137:155345.
[Crossref] [Google Scholar] [PubMed]
- Gruffaz C, Smirnov A (2023) GTPase Era at the heart of ribosome assembly. Front Mol Biosci 10:1263433.
[Crossref] [Google Scholar] [PubMed]
- Liu J, Zheng X, Wu X. (2022) The Rab GTPase in the heart: Pivotal roles in development and disease. Life Sci 306:120806.
[Crossref] [Google Scholar] [PubMed]
- Schwaerzer G (2024) Age-dependent shortcut of the platelet differentiation cascade drives thrombocytosis and thrombotic diseases. Nat Cardiovasc Res 3:613.
[Crossref] [Google Scholar] [PubMed]
- He M, Fang M, Fan L, Maimaitijiang A (2024) Preparation and characterization of BSA-loaded liraglutide and platelet fragment nanoparticle delivery system for the treatment of diabetic atherosclerosis. J Nanobiotechnology 22:506.
[Crossref] [Google Scholar] [PubMed]
- Gresele P, Guglielmini G, Del Pinto M, Calabrò P, Pignatelli P, et al. (2024) Low platelet count at admission has an adverse impact on outcome in patients with acute coronary syndromes: From the start antiplatelet registry. Sci Rep 14:14516.
- Pruc M, Peacock FW, Rafique Z, Swieczkowski D, Kurek K, et al. (2023) The prognostic role of platelet-to-lymphocyte ratio in acute coronary syndromes: A systematic review and meta-analysis. J Clin Med 12:6903.
[Crossref] [Google Scholar] [PubMed]
- Arias-Colinas M, Gea A, Kwan J, Vassallo M, Allen SC, et al. (2024) Cardiovascular autonomic dysfunction in hospitalized patients with a bacterial infection: A longitudinal observational pilot study in the UK. Biomedicines 12:1219.
[Crossref] [Google Scholar] [PubMed]
- Gong B, Qu T, Zhang J, Jia Y, Song Z, et al. (2024) Downregulation of ABLIM3 confers to the metastasis of neuroblastoma via regulating the cell adhesion molecules pathway. Comput Struct Biotechnol J 23:1547-1561.
[Crossref] [Google Scholar] [PubMed]
- Filatova EV, Krylova NS, Klass AL, Kovalevskaya EA, Maslova MY, et al. (2023) No effect of the p.arg230his variant of the vcl protein on the course of the hypertrophic cardiomyopathy in Russian family carrying the p.gln1233ter pathogenic variant in the MYBPC3 gene. Kardiologiia 63:28-35.
[Crossref] [Google Scholar] [PubMed]
- Li N, Ge Q, Guo Q, Tao Y (2024) Identification and functional validation of FZD8-specific antibodies. Int J Biol Macromol 254:127846.
[Crossref] [Google Scholar] [PubMed]
Citation: Lu F (2025) Gene Expression Profiling Reveals Novel Biomarkers for Predicting Cardiovascular Risk in End-Stage Renal Disease Patients. Diagnos Pathol Open 10:245.
Copyright: © 2025 Lu F. This is an open-access article distributed under the terms of the Creative Commons Attribution License, which permits unrestricted use, distribution, and reproduction in any medium, provided the original author and source are credited.
Select your language of interest to view the total content in your interested language
Share This Article
Open Access Journals
Article Usage
- Total views: 704
- [From(publication date): 0-0 - Nov 08, 2025]
- Breakdown by view type
- HTML page views: 569
- PDF downloads: 135
