Genetic Variability, Heritability and Genetic Advance of Yield and Yield Related Traits of Food Barley (Hordeum vulgare L.) Genotypes in Mid Rift Valley of Ethiopia
Received: 06-Sep-2018 / Accepted Date: 22-Oct-2018 / Published Date: 30-Oct-2018 DOI: 10.4172/2329-8863.1000401
Keywords: Genetic advance; Food barley; Genotypes; Grain yield; Heritability
Introduction
Barley (Hordeum vulgare L.) is the most ancient food crops in the world and it is an important cereal crop since the early stages of agricultural innovations 8,000-10,000 years ago [1]. In Ethiopia, it is produced mainly for human consumption as one of the most important staple food crops. Its grain is used for preparing a diversity of recipes and is deeply rooted in the culture and tradition of people's diets. The recipes are prepared in different forms of indigenous food and homemade beverages [2]. Food barley production is 20, 249, 21.68 and 146, 46.502 tons in Ethiopia and East Shewa zone, respectively [3]. More than 85% of the total production comes from the major barley growing regions, which include Wello, Shewa, Arsi, Gojam, Bale, Gondar and Tigray. Earlier studies on the diversity of Ethiopian barley shows, that most of the variation was due to differences among characters and only a relatively small fraction was due to differences between regions. And almost all characters are considerably influenced by altitude within the regions. There was shortage of improved barley varieties adapted to low-moisture stress areas of Ethiopia. Hence farmers are forced to grow low yielding genotypes.
Variability is occurrence of differences among individuals due to differences in their genetic composition or environment in which they are raised [4]. Phenotypic variability is the observable variation present in a character in a population; it includes both genotypic and environmental variation. Genotypic variability, on the other hand, is the component of variation, which is due to the genetic differences among individuals within a population [5]. Identification of superior genotype by selection is dependent on existence of reliable genetic variability. Heritability is a measure of the value of selection for particular characters and an index of their transmissibility [6]. It plays a predictive role in breeding, expressing the reliability of phenotype as a guide to its breeding value. The expected response to selection is also called genetic advance (GA). High genetic advance coupled with high heritability estimates offers the most effective condition for selection.
Genetic improvement of crop is largely depending on the scale of genetic variability and the degree to which desired traits are inherited [7]. The presence of genetic diversity and the relationship among various yield and yield related traits and their heritability is essential in identifying possible genotypes for forthcoming crop variety development [8]. Apart from simple screening of these introduced barely germplasm, detail study of their variability and genetic advance are important to enhance gain in barely breeding program. However, this kind of study was not yet conducted in the Mid Rift Valley of Ethiopia. Hence, the present study was designed with the objectives of: To estimate the level of genotypic and phenotypic variability of food barley genotypes.
Materials and Methods
The experiment was conducted at Adami Tulu Agricultural Research Center of Oromia Agricultural Research Institute (OARI) under rain-fed condition during the 2017/18 cropping season. It located at a latitude of 7°9'N and longitude of 38°7'E. It has an altitude of 1650 m.a.s.l, and it receives a bimodal unevenly distributed average annual rainfall of 760.9 mm per annum [9]. The long-term mean minimum and maximum temperatures are 12.6°C and 27°C, respectively. The soil is fine sandy loam in texture with the soil type of sand, clay and silt in proportion of 34%, 48% and 18% respectively and a pH of 7.88 [9].
Experimental materials
In the present study, a total of 22 food barley genotypes were used along with three standard checks. Twenty-two of them were advanced genotypes and screened by Sinana Agricultural Research Center.
Experimental design and management
The experiment conducted in 5 × 5 Triple Lattice Design with three replications.
The treatments were planted on a plot size of 1.2 m × 2.5 m. The space between plant, plots and blocks were 0.2 m, 0.5 m and 1 m respectively. DAP 150 kg/ha fertilizer was applied during planting and the seed rate used was 125 kg/ha and sown by hand drilling. For data collection, the middle four rows were used. All management practices including weeding were performed uniformly to the entire plot according on the local recommendation (Table 1).
| S No | Genotypes/Code | Origin | Pedigree |
|---|---|---|---|
| 1 | G1 | Ethiopia | Acc#244906 |
| 2 | G2 | Ethiopia | Acc#244919 |
| 3 | G3 | ICARDA | SHEMIAL NO.3/MSEL |
| 4 | G4 | ICARDA | VMORALES |
| 5 | G5 | ICARDA | LIMON/BICHY2000/4/ALELI/3/ARUPO/K8755//MORA/5/MSEL |
| 6 | G6 | ICARDA | CHAMICOO/M111 |
| 7 | G7 | ICARDA | FNCI/3/LEGACY//PENCO/CHEVRON-BAR |
| 8 | G8 | ICARDA | P.STO/3/LBIRAN/UNA80//LIGNEE640/4/BLLU/5/PETUNIA1/6/LEGACY// PENCO/CHEVRON-BAR |
| 9 | G9 | ICARDA | P.STO/3/LBIRAN/UNA80//LIGNEE640/4/BLLU/5/PETUNIA1/6/LEGACY//PENCO/CHEVRON-BAR |
| 10 | G10 | ICARDA | CABUYA/M111/7/TRADITION/6/P.STO/3/LBIRAN/UNA80//LIGNEE40/4/BLLU/5/PETUNIA |
| 11 | G11 | ICARDA | SHYRI/GRIT//FNC1 |
| 12 | G12 | ICARDA | P.STO/3/LBIRAN/UNA80//LIGNEE640/4/BLLU/5/PETUNIA1/6/CHNGADU 89//PENCO/CHEVRON-BAR/3/CHAMICO/TOCTE/CONGONA |
| 13 | G13 | ICARDA | CANELA/C14196 |
| 14 | G14 | ICARDA | LIGNEE27/GARBEL/3/BOY-B*2/SURB//C12225.2D/4/GLORIA-BAR/COM |
| 15 | G15 | ICARDA | SVANHALS-BAR/MSEL//AZAF/GOB24DH/3/DEFERA/DESCONNCIDA-BAR |
| 16 | G16 | ICARDA | LIGNEE 27/ GERBEL /3/BOY-B*2/SURB //C12225.2 D/4/ GLORIA-BAR/COM |
| 17 | G17 | ICARDA | LIGNEE27/GARBEL/3/BOY-B*2/SURB//C12225.2D/4/GLORIA-BAR/COM |
| 18 | G18 | ICARDA | LIGNEE 27/ GARBEL /3/ BOY-B*2/ SURB//C 12225.2 D /4/ GLORIA-BAR/COM |
| 19 | G19 | ICARDA | FRES/M1004 |
| 20 | G20 | ICARDA | FRES/LEGACY |
| 21 | G21 | ICARDA | SEN/5/LEGACY/4/TOCTE//GOB/HUMAI10/3/ATAH92/ALELI |
| 22 | G22 | ICARDA | PUEBLA/CORDO//TOCTE/3/FALCON-BAR |
| 23 | Gobe | - | Released Variety |
| 24 | Bentu | ICARDA | Released Variety |
| 25 | Robera | Ethiopia | Released Variety |
Table 1: Lists of barely genotypes used in the study along with their origins and Pedigree. Source: Sinana Agricultural Research Center. Note: G1-G22=Genotypes used for study.
Data collection
Plant height (cm): Was measured as the height in centimeter from the soil surface to the tip of spike excluding the awn at maturity and expressed as an average of randomly taken ten plants per plot.
Peduncle length (cm): Length of the peduncle in centimeter from the node to the tip of the peduncle as the average of ten randomly taken plants from the central four rows of each plot.
Awn length (cm): Length of awn in centimeter from the end of the spike to tip of the awn.
Spike length (cm): Spike length of the main plant was measured in centimeter from base to the tip excluding the awns and expressed as the average of randomly taken ten plants in a plot.
Spikelet number per spike: Was recorded by counting the number of spikelet on each spike on the main tiller and expressed as the average of randomly taken ten plants in each plot.
Kernel number per spike: Was determined by counting the number of kernels produced on the main tiller of each plant and expressed as an average of randomly taken ten plants in each plot.
Days to first heading: Was recorded as the number of days from seedling emergence to the date on which first head was produced in the plots.
Days to heading: Was recorded as the number of days from seedling emergence to the date on which 75% of a plot has produced heads.
Days to maturity: Was recorded as the number of days from seedling emergence to the stage when 75% of a plot reached maturity.
Grain filling period: Was recorded as the number of days from days the date of heading to the date physiological maturity.
Number of effective tillers per m2: Numbers of tillers m-2 were counted in square meter frame area. Tillers was recorded by counting the number of tillers of 2.5-meter length in two central rows of each subplot and then converted to tiller m-2.
Biological yield (kg/ha): Was determined by weighing the total dried above ground biomass from the four central rows of each plot and expressed in kilogram per hectare.
Grain yield (kg/ha): Grain yield of the four central rows adjusted to 12.5% moisture content and expressed in kilogram per hectare.
Harvest index (%): Was calculated on plot bases from the four rows as the ratio of dry weight of the grain to the dry weight of the above ground biomass and expressed as a percentage.
Harvest Index=(Grain yield per plot)/(Above ground biomass per plot) × 100
Thousand kernel weights (g): Weight in gram of random samples of thousand seeds per plot adjusted to 12.5% moisture content.
Data analyses
Analysis of variance was done using Proc lattice and Proc GLM procedures of SAS version 9.0, [10] after testing the ANOVA assumptions. The difference between treatment means was compared using DMRT at 5% probability levels.
The model for lattice design is:
Yil(j)=μ+ti+rj+(b|r)l(j)+eil(j)
Where, Yil(j) is the observation of the treatment i (i=1, v=k2), in the block l (l=1, k) of the replication j (j=1, m); μ is a constant common to all observations; ti is the effect of the treatment i; rjis the effect of the replication j; (b|r)l(j) is the effect of the block l of the replication j; eil(j) is the error associated to the observation Yil(j), where eil(j)~N(0,s), independent.
Phenotypic and genotypic variability
The variability present phenotypic and genotypic variances and coefficient of variations were computed according to the methods suggested by Burton and Devane [11] as follows:
Genotypic variances (σ2g)=(mg-me)/r
Where, σ2g=Genotypic variance, mg=genotypic mean square and σ2e=environmental variance (Error mean square).
Phenotypic variance (σ2p)=σ2g+σ2e
Where, σ2g=genotypic variance, σ2e=Error variance, σ2p=Phenotypic variance.
Phenotypic coefficient of variation, 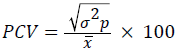
Genotypic coefficient of variation, 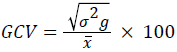
Where, x=population mean (Grand mean).
Estimate of heritability
Heritability (H2) in broad sense for measured characters was estimated using the formula developed by (Allard, 1960).
H2=(σ2g)/(σ2p) × 100
σ2p=σ2g+σ2e
Where, σ2g=genotypic variance, σ2p=phenotypic variance and σ2e=error variance.
Estimation of expected genetic advance
Genetic advance (GA) and genetic advance as percent of the mean (GA %) for each character were estimated using the formula developed by Johnson et al. [6] and Allard [4].
GA=(k) (σp) × (H2B)
GAM (as % of the mean)=[(GA)/X] × 100
Where, k=selection differential (k=2.06 at 5% selection intensity), σp=phenotypic standard deviation, H2=heritability (Broad sense), X=Grand mean.
Results and Discussion
The analysis of variance shown that there was highly significant (p ≤ 0.01) difference among the studied genotypes for days to first heading, days to heading, grain filling period, days to maturity, number of kernels per spike, plant height, spike length, awn length, grain yield, thousand kernel weight and harvest index. Significant (p ≤ 0.05) difference among genotypes was also observed for peduncle length. Similarly, Oettler et al. [12] reported significant differences in barley genotype for grain yield, spikes/m2, thousand kernel weight, dry matter, heading and plant height. However, the genotypes exhibited no significance difference for number of spikelet per spike, number of effective tillers and biological yield. In harmony to this result, Dawit et al. [13] reported no significant differences for biological yield and number of tillers per plant in durum wheat genotypes. Meseret [14] also reported no significant differences for biological yield, number of tillers per plant in food barley genotypes. The present findings indicated the existence of great variability among the tested genotypes for almost all characters measured, which could be exploited through selection, as variability with in populations is a basic requirement for plant breeding program on which selection depends to develop superior genotype for the studied area (Table 2).
| Traits | Mean Squares | ||||
|---|---|---|---|---|---|
| Genotypes (df=24) | Replications (df=2) | Error (df=36) | Eff. (%) | R2 | |
| Days to first flowering | 33.58** | 14.44* | 4.11 | 97.45 | 0.88 |
| Days to heading | 52.61** | 71.21** | 9.22 | 99.84 | 0.85 |
| Days to maturity | 46.36** | 9.45ns | 7.69 | 106.5 | 0.87 |
| Grain filling period | 33.82** | 29.32ns | 9.99 | 110.35 | 0.78 |
| Number of kernels per spike | 168.73** | 0.79ns | 38.54 | 106.86 | 0.77 |
| Number of spikelet per spike | 18.52ns | 50.20ns | 17.53 | 108.25 | 0.51 |
| Plant height (cm) | 143.47** | 37.62ns | 58.35 | 103.98 | 0.73 |
| Spike length (cm) | 1.44** | 0.54ns | 0.58 | 113.98 | 0.68 |
| Number of effective tiller per m2 | 27330.41ns | 382135ns | 20934 | 100.91 | 0.72 |
| Peduncle length (cm) | 24.02* | 30.95ns | 12.92 | 95.73 | 0.7 |
| Awn length (cm) | 2.14** | 0.56ns | 0.56 | 102.4 | 0.8 |
| Grain yield (kg ha-1) | 3006294.33** | 932421ns | 604639 | 116.54 | 0.8 |
| Biological yield (kg ha-1) | 5715842ns | 11166.62ns | 4814538.5 | 101.28 | 0.59 |
| Thousand kernel weight | 70.66** | 12.84ns | 14 | 100.45 | 0.8 |
| Harvest index (%) | 218.20** | 35.10ns | 50.24 | 114.01 | 0.79 |
Table 2: Mean square values from analysis of variance (ANOVA), coefficient of variation (CV), and coefficient of determination (R2) for 15 traits in 25 food barley genotypes grown at ATARC during the 2017/18 main cropping season. df=degrees of freedom, *,** and ns, significant at P ≤ 0.05, P ≤ 0.01 and non-significant, respectively, CV (%)=coefficient of variation, Eff.=Efficiency of Lattice design relative to RCBD.
Estimation for quantitative traits
Genotypes showed variation for days to first heading ranging from 36 to 53 and days to heading ranging from 46.67 to 64 days (Table 3). Bentu was early to mature followed by G20, G17, G18, Gobe, G16, G6, G14 and G14 while, G22, G1, G11, G12, G21 and G2, were late to mature (Table 3). The mean value of the genotypes for grain filling period was 38.88 days and ranged from 33 to 47 days. In general, the present result showed that there is a wide range of variations among the genotypes in crop phenology traits. Similarly, previous studies conducted on collection of barley landraces shown high genetic variation for days to heading [15] and days to maturity [16,17]. The mean value of thousand kernel weight of the test genotypes was 42.19 gram. Gobe, G13, G10 and Robera were the test entries that showed higher values for thousand kernel weight. In the present study, most of the genotypes had thousand kernel weight values below that of the standard check (Gobe), and hence in the target of improving this trait, the standard check (Gobe) should be used as a parent in crossing program.
| Genotype | DFH | DH | DM | GFP | NKPS | NSPS | PH | SPL | ET | PL | AL | GY | BY | TKW | HI |
|---|---|---|---|---|---|---|---|---|---|---|---|---|---|---|---|
| G-1 | 53.33a | 64.33a | 97.33ab | 33h | 30.67de | 20.1 | 82.8a-d | 8.4a-d | 448.4 | 27.57a-e | 11.067c-f | 1296.2h | 11046 | 33.06j | 13.23g |
| G-2 | 49.67b | 60.67ab | 95abc | 34.3fgh | 41.1dc | 20.7 | 89.1a | 9.08abc | 456.6 | 32.23a | 11.58a-d | 2194gh | 12277 | 33.6ij | 18.16fg |
| G-3 | 43.33cd | 50.33efg | 92.3bcd | 42abc | 56.76a | 22.83 | 75.3a-g | 7.02de | 597.4 | 22c-g | 11.28cde | 5282.3a | 12866 | 44.53b-f | 41.65a-d |
| G-4 | 41.67def | 50.33efg | 89.67cd | 39.3c-g | 52.07abc | 22.87 | 62.6g | 7.22de | 428.4 | 24.77b-g | 10.65c-f | 4015.7a-f | 10016 | 44.53b-f | 40.32a-d |
| G-5 | 41.67def | 50efg | 90.3dc | 40.3b-f | 52.77abc | 23.4 | 80.1a-e | 8.1b-e | 630 | 28.6a-d | 12.9a | 4552.3a-e | 11219 | 35.2hij | 43.29abc |
| G-6 | 41.33defg | 50efg | 89d | 39c-h | 53.7ab | 20.6 | 77.04a-g | 6.99de | 329.6 | 28.97a-d | 11.92abc | 4890.7abc | 9832 | 40.67d-i | 50.79a |
| G-7 | 43.67de | 55cde | 90.3cd | 35.3d-h | 42.2bc | 22.87 | 67.06efg | 6.94de | 341.7 | 24.3b-g | 11.03c-f | 2633fgh | 9550 | 45.6b-e | 28.31edf |
| G-8 | 40.33efg | 48.33fhg | 90cd | 41.67abc | 53.3abc | 23.6 | 85.9ab | 7.8cde | 598.2 | 29.13abc | 8.85gh | 5313a | 12146 | 42.9b-g | 43.27abc |
| G-9 | 45cd | 51efg | 89.67cd | 38.67c-h | 47.03abc | 19.67 | 79.78a-e | 8b-e | 443.7 | 27.37a-e | 9.7fg | 4768.8a-d | 11769 | 45.07b-f | 40.35a-d |
| G-10 | 45cd | 50.67efg | 93.3a-d | 42.67abc | 53.9ab | 22.07 | 78.4a-f | 7.7cde | 287 | 24.7b-f | 10.9c-f | 4595.5a-e | 11762 | 48abc | 39.48a-e |
| G-11 | 48bc | 59.33abc | 97ab | 37.67c-h | 54.03ab | 21.46 | 83.14abc | 8.1b-e | 538.6 | 30.17ab | 10.97c-f | 4746a-d | 13913 | 39.47e-j | 34.05b-e |
| G-12 | 49.67b | 58bcd | 97ab | 39c-h | 49.8abc | 18.5 | 86.19a | 7.66cde | 536.7 | 28.77a-d | 11.45b-e | 4509.8a-e | 13343 | 39.73d-j | 33.61b-e |
| G-13 | 44.67cd | 52.33d-g | 94.67abc | 42.3abc | 47.07abc | 18.8 | 77.5a-g | 9.3ab | 578.1 | 25.57a-g | 10.88c-f | 4976.5ab | 13143 | 49.2ab | 37.74a-e |
| G-14 | 44.67cd | 54c-f | 89d | 35e-h | 48.23abc | 21.2 | 67.92d-g | 7.8cde | 598.5 | 25.3a-g | 10.68c-f | 2933.8fg | 11351 | 35.33hij | 25.97ef |
| G-15 | 41.67def | 50efg | 91dc | 41a-e | 46.07abc | 18.5 | 70.86c-g | 7.89b-e | 374.9 | 21.8d-g | 10.63c-f | 3419.2c-g | 11419 | 40.93c-h | 30.09c-f |
| G-16 | 41.33defg | 50.33efg | 88.67d | 38.3c-h | 56.63a | 22.3 | 69.67c-g | 7.52de | 460.7 | 21.9d-g | 10.6c-f | 3810.8a-f | 11644 | 36.67g-j | 33.13b-e |
| G-17 | 44.33cd | 51.33efg | 88d | 36.67c-h | 50.3abc | 20.8 | 65.91efg | 7.66cde | 383.5 | 22.27c-g | 10.9c-f | 2519.5fgh | 9186 | 41.07c-h | 27.81def |
| G-18 | 45cd | 53.67c-f | 88.3d | 34.67fgh | 47.2abc | 23.9 | 63.8fg | 7.7cde | 467 | 19.33g | 10.3def | 2894.3fg | 10061 | 44.53b-f | 28.74def |
| G-19 | 45cd | 56bcde | 90cd | 34gh | 49.7abc | 19.73 | 65.87efg | 8.28a-e | 392.2 | 20.1fg | 9.9efg | 3783.5a-f | 9784 | 43.87b-g | 38.54a-e |
| G-20 | 37.67gh | 43.67hi | 83.3e | 39.67b-g | 48.4abc | 19.37 | 64.25fg | 7.02de | 342 | 20.03fg | 10.62c-f | 4786abc | 10369 | 42.13b-h | 46.68ab |
| G-21 | 43.67de | 51.33efg | 97ab | 45.67ab | 49.4abc | 22.13 | 71.1b-g | 9.6a | 336.7 | 28.57a-d | 10.67c-f | 3248.8d-g | 9832 | 47.07a-d | 33.71b-e |
| G-22 | 42.33def | 51efg | 98a | 47a | 55.5a | 20.63 | 77.4a-g | 8.39a-e | 460.3 | 27.07a-f | 10.05efg | 4955.3ab | 11789 | 43.6b-g | 45.79ab |
| Gobe | 38.67fgh | 47.33ghi | 88.67d | 41.3a-d | 21.96e | 23.13 | 65.16efg | 7.19ed | 619.8 | 25.37a-g | 8.11h | 4760.7a-d | 10677 | 52.67a | 44.64ab |
| Bentu | 36.33h | 42.67i | 76.67f | 34gh | 47.6abc | 18.9 | 62.57g | 7.4de | 259.4 | 21.33efg | 10.26def | 3132.2efg | 6966 | 37.73f-j | 45ab |
| Robera | 43.33de | 52.67defg | 92bdc | 39.3c-g | 41.3dc | 21.76 | 76.8a-g | 6.86e | 461.1 | 27.97a-e | 12.68ab | 3647.5b-g | 13148 | 47.6abc | 28.01def |
| DMRT(5%) | ** | ** | ** | ** | ** | NS | ** | ** | NS | * | ** | ** | NS | ** | ** |
| Mean | 43.64 | 52.17 | 90.05 | 38.88 | 47.87 | 21.65 | 73.85 | 7.83 | 454.8 | 25.4 | 10.74 | 3906.63 | 11166 | 42.19 | 35.69 |
| CV | 4.65 | 5.82 | 3.05 | 8.13 | 12.96 | 19.32 | 10.34 | 9.74 | 27.81 | 14.15 | 7.07 | 19.9 | 19.64 | 8.86 | 19.86 |
Table 3: Mean performance of 12 quantitative traits for 25 food barley genotypes tested at Adami Tulu Agricultural Research Center in 2017. G1- G22=Genotypes used for study, DFH=Days to first heading, DH=Days to heading, DM=Days to maturity, GFP=Grain filling period, NKPS=Number of kernel per plant, NSPS=Number of spikelet per spike, PH=Plant height (cm), SPL=Spike length (cm), ET=Effective tiller per meter square (m2), PL=peduncle length (cm), AL=Awn length (cm), GY=Grain yield (kg), BY=Biological Yield (Kg/ha), TKW=Thousand kernel weight (g), HI=Harvest index (%).
Three genotypes G6 (50%), G20 (46.68%) and G22 (45%) showed higher harvest index values as compared to the standard checks. Consequently, it is more efficient when these three genotypes are selected as donor parent in crossing block for improving harvest index. Maximum and minimum grain yield was obtained from G8 (5313 kg ha-1) and G1 (1296.2 kg ha-1) with the range value of 4016.8 kg ha-1. This showed that there is huge variation within the test entries for grain yield. Out of the total genotypes tested, 52% of them had yielded above the grand mean (3906.6 kg ha-1).
Phenotypic and genotypic variations
The portion of genotypic variance for days to first heading, days to heading, days to maturity, number of kernel per plant, grain yield, 1000-kernel weight and harvest index were greater than 50%, which indicates that the genotypic effect on the phenotypic expression was greater than the effect of the environment by more than 50%. However, the effect of environment on the phenotypic expression for grain filling period, plant height, spike length, peduncle length and awn length were greater than the genotypic effect.
The genotypic coefficient of variation (GCV) ranged from 3.94% for days to maturity to 22.90% for grain yield, and the phenotypic coefficient of variation (PCV) ranged from 4.98% for days to maturity to 30.34% for grain yield (Table 4). According to Deshmukh et al. [18], PCV values were considered as high for grain yield (30.34%) and harvest index (28.88%), while traits with moderate PCV values were grain filling period (10.89%), number of kernel per spike (18.91%), plant height (12.61%), spike length (11.89%), peduncle length (16.05%) and 1000-kernel weight (13.59%). However, lower PCV values were observed for days to first heading (8.55%), days to heading (9.33%), days to maturity (4.98%) and awn length (9.7%). Regarding, GCV values, high GCV estimates were obtained for harvest index and grain yield whereas number of kernels per plant, and 1000-kernel weight showed moderate values, and the other traits had showed lower GCV (Table 4). The genotypic coefficient of variation for grain yield (22.9%) and harvest index (20.96) were high (Table 4). This suggested that the impact of environmental factors on the expression of these traits is relatively low and these traits are responsive to selection. Similar finding has been also reported by Jimera et al. [19] and Addisu and Shumet [20].
| Traits | Mean ± SE | σ2g | σ2p | σ2e | Share of % | GCV (%) | PCV (%) | H2b% | GA (5%) | GAM | |
|---|---|---|---|---|---|---|---|---|---|---|---|
| σ2e | σ2g | ||||||||||
| DFH | 43.64 ± 1.17 | 9.82 | 13.93 | 4.11 | 29.5 | 70.5 | 7.18 | 8.55 | 70.5 | 5.42 | 12.42 |
| DH | 52.17 ± 1.75 | 14.46 | 23.68 | 9.22 | 38.93 | 61.07 | 7.29 | 9.33 | 61.07 | 6.12 | 11.74 |
| DM | 91.05 ± 1.60 | 12.89 | 20.58 | 7.69 | 37.37 | 62.63 | 3.94 | 4.98 | 62.63 | 5.85 | 6.43 |
| GFP | 38.88 ± 1.83 | 7.94 | 17.94 | 10 | 55.72 | 44.28 | 7.25 | 10.89 | 44.28 | 3.86 | 9.94 |
| NKPS | 47.87 ± 3.58 | 43.4 | 81.94 | 38.54 | 47.04 | 52.96 | 13.76 | 18.91 | 52.96 | 9.88 | 20.63 |
| PH | 21.2 ± 2.42 | 28.37 | 86.72 | 58.35 | 67.28 | 32.72 | 7.21 | 12.61 | 32.72 | 6.28 | 8.5 |
| SL | 73.85 ± 4.41 | 0.29 | 0.87 | 0.58 | 66.92 | 33.08 | 6.84 | 11.89 | 33.08 | 0.63 | 8.1 |
| PL | 7.83 ± 0.44 | 3.7 | 16.62 | 12.92 | 77.74 | 22.26 | 7.57 | 16.05 | 22.26 | 1.87 | 7.36 |
| AL | 454.8 ± 83.53 | 0.53 | 1.08 | 0.56 | 51.35 | 48.65 | 6.76 | 9.7 | 48.65 | 1.04 | 9.72 |
| GY | 25.4 ± 2.08 | 800551.78 | 1405190.78 | 604639 | 43.03 | 56.97 | 22.9 | 30.34 | 56.97 | 1391.2 | 35.61 |
| TKW | 10.74 ± 0.43 | 18.89 | 32.89 | 14 | 42.57 | 57.43 | 10.3 | 13.59 | 57.43 | 6.78 | 16.08 |
| HI | 3906.6 ± 448.94 | 55.99 | 106.23 | 50.24 | 47.3 | 52.7 | 20.96 | 28.88 | 52.7 | 11.19 | 31.35 |
Table 4: Phenotypic and genotypic variances and coefficient of variations, heritability in broad sense, genetic advance as percent and standard error (SE) of mean for 12 traits of 25 food barley genotypes studied at ATARC during the 2017/18 main season. σ2g=genotypic variance, σ2p=phenotypic variance, σ2e=environmental variance, PCV=phenotypic coefficient of variation(%), GCV=genotypic coefficient of variation (%), H2=broad sense heritability (%), GA=Genetic advance, GAM=genetic advance as percent of mean (%). DFH=Days to first heading, DH=Days to heading, DM=Days to maturity, GFP=Grain filling period, NKPS=Number of kernel per spike, PH=Plant height (cm), SPL=Spike length (cm), PL=peduncle length (cm) AL=Awn length (cm), GY=Grain yield (kg/ha), TKW=Thousand kernel weight (g), HI=Harvest index (%).
The phenotypic coefficient of variation was relatively greater than genotypic coefficient of variation for all traits considered in this study. However, the scale of the difference was low for days to first heading, days to heading, days to maturity, grain filling period, awn length, grain yield, harvest index and 1000-kernel weight. This suggested that the marked influence of environmental factors for the phenotype expression of genotypes for these traits was low and the higher chance of improvement of these traits through selection based on the phenotype of genotypes.
Estimates of heritability and expected genetic advance
Heritability, estimates can be grouped in to the following categories: low heritability (<40%), medium heritability (40-59%), moderately high (60-79%) and very high heritability (>80%). According to this author, the present study, broad sense heritability estimate varied from 22.26% for peduncle length to 70.50% for days to first heading. Moderately high heritability (>40 and <80) values were obtained for days to first heading (70.50%), days to heading (61.07%), days to maturity (62.63%), grain filling period (44.28%), number of kernels per spike (52.96%), awn length (48.65%), grain yield (56.97%), 1000-kernel weight (57.43%) and harvest index (52.7%) (Table 4). This suggested that selection for these traits should be delayed to more advance generations. However, plant height (32.72%), spike length (33.08%) and peduncle length (22.26%) exhibited lower heritability estimates which suggest that selection for these traits would be considerably difficult or virtually impractical due to the masking effect of the environment.
Johson et al. reported that genetic advance as percent of mean was categorized as low (<10%), moderate (10-20%) and high (>20%). Among the characters measured, number of kernels per spike, grain yield and harvest index were showed moderately high heritability estimate in conjunction with higher values of genetic advance estimates as percentage of mean where these results agreed with that of Alemayehu [16], Shegaw et al. [17] and Azeb et al. [21] who reported high heritability together with relatively high genetic advance as percent of in barley. Genetic advance under selection is the advance of traits in genotypic value for the produced population compared with the original population under one cycle of selection at a given selection intensity [5]. Thus, the result suggested that selecting the top 5% of the genotypes could result in an advance of 11.74% to 35.61% over the respective population mean for the days to first heading, days to heading, number of kernel per spike, grain yield, 1000-kernel weight and harvest index.
Genetic advance under selection values were low (<10%) for days to maturity, grain filling period, plant height, spike length, peduncle length and awn length. This implies that improvement of traits in genotypic value for the produced population compared with the original population under one cycle of selection is <10% at 5% selection intensity. According to Panse [22], the effective selection is done for the characters having high heritability accompanied by high genetic advance which is due to the additive gene effect. In this study, high heritability complemented with moderate genetic advance was observed for days to first heading, days to heading and 1000-kernel weight. This provides a chance for further improvement in advanced generations through selection of these traits.
Summary and Conclusion
The analysis of variance for revealed that there were sufficient variations among food barley genotypes for grain yield and yield related traits. There were highly significant variation among genotypes for days to first heading, days to heading, grain filling periods, days to maturity, number of kernel per spike, plant height, spike length, awn length, grain yield, thousand kernel weight and harvest index. The highest mean performance for grain yield was obtained from genotypes G8 with 5313 kg ha-1 and lowest mean performance for grain yield was obtained from genotype G1 with 1296.2 kg ha-1. Among twenty-two genotypes tested seven of them had higher mean yield than the three standard checks, and this gives an opportunity for plant breeders for new variety release of the crop. The genotypic variances (δ2g) were greater than environmental variance (δ2e) for days to first heading, days to heading, days to maturity, number of kernel per plant, grain yield, 1000-kernel weight and harvest index. Thus, the variations observed between genotypes were largely the effect of inherent genetic background of the genotypes. Moderately high heritability complemented with moderate genetic advance was observed in the case of days to first heading; days to heading and 1000- kernel weight. Expressing, these traits were highly heritable and governed by additive gene action. In spite days to maturity possessing moderately high estimate of heritability but failed to show high estimate of genetic advance as percentage of mean and indicating nonadditive gene actions in its inheritance.
References
- Giles BE, Von Bothmer R (1985) The progenitor of barley (Hordeum vulgare spp. spontaneum)-its importance as a gene resource. Sveriges Utsaedesfo erenings Tidskrift 95: 53-61.
- Yaynu H (2011) Response of Barley Landraces to Low-Moisture Stress in a Low-Rainfall Environment. In: Barley Research and Development in Ethiopia. Mulatu B, Grando S (eds.). International Center for Agricultural Research in the Dry Areas, Holeta, Ethiopia, pp: 47-56.
- CSA (Central Statistical Agency) (2016) Federal Democratic Republic of Ethiopia: Central Statistics Agency. Agricultural Sample Survey 2015/2016 (2008 EC) (September-January 2015/2016). Volume VII. Report on Crop and Livestock Product Utilization (Private Peasant Holding, Meher Season). Statistical Bulletin No 586, Addis Ababa, p: 35.
- Allard RW (1960) Principles of Plant Breeding. John Willey and Sons. Inc., New York.
- Singh BD (2001) Plant Breeding Principles and methods. Kalyani Publishers, New Delhi, p: 896.
- Johnson HW (1995) Estimation of genetic and environmental variability in soybean. Agron J 47: 477-483.
- Kumar M, Vishwakarma SR, Bhushan B, Kumar A (2013) Estimation of genetic parameters and character association in barley (Hordeum vulgare L.). Journal of Wheat Research 5: 76-78.
- Sharma JR (1998) Statistical and Biometrical Techniques in Plant Breeding. New Age International (P) Limited Publishers, New Delhi, p: 432.
- ATARC (Adami Tulu Agricultural Research Center) (1998) ATARC profile. Oromia Agricultural Research Institute, Addis Ababa, Ethiopia.
- Anderson PM, Oelkeand EA, Simmons SR (2012) Growth and development guide for spring barley.
- Burton GW, Devane G (1953) Quantitative inheritance in grasses. Proceedings of 6th International Grassland 1: 277-283.
- Oettler GS, Wietholterand S, Horst WJ (2009) Genetic variation for yield and other agronomic traits of barley grown on an acid, aluminum-toxic soil in Southern Brazil, pp: 267-272.
- Dawit T, Tadesse D, Yigzaw D, Getnet S (2012) Analysis of genetic diversity in some durum wheat (Triticum durum Desf) genotypes grown in Ethiopia. African Journal of Biotechnology 11: 9606-9611.
- Meseret Z (2015) Genetic Variability and Association among Agronomic Characters in Some Genotypes of Barley (Hordeum vulgare L.) Grown in Chencha and Angacha, Southern Ethiopia. MSc Thesis, Haramaya University, Ethiopia.
- Alemayehu F, Parlevliet JE (1997) Variation between and within Ethiopian barley landraces. Euphytica 94: 183-189.
- Alemayehu A (2003) Genetic Variability and Breeding Potential of Barley (Hordeum vulgare L.) Landraces from North Shewa in Ethiopia. PhD Thesis, Faculty of Natural and Agricultural Sciences, University of Free State, Bloemfontein, South Africa, p: 226.
- Shegaw D, Elias U, Hussein M (2013) Genetic variability in barley (Hordeum vulgare L.) landrace collections from Southern Ethiopia. International Journal of Science and Research 12: 358-366.
- Deshmukh SN, Basu MS, Reddy PS (1986) Genetic variability, character association and path coefficients of quantitative traits in Virginia bunch of groundnut. Indian Agricultural Science 56: 816-821.
- Jimera H, Hirpa L, Rao CP (2015) Genetic Variability, Character Association and Genetic Divergence in Barley (Hordeum vulgare L.) Genotypes Grown at Horo. District, Western Ethiopia. Star Journal 4: 1-9.
- Addisu F, Shumet T (2015) Variability, Heritability and Genetic Advance for Some Yield and Yield Related Traits in Barley (Hordeum vulgare L.) Landraces in Ethiopia. International Journal of Plant Breeding and Genetics 9: 68-76.
- Azeb H, Sentayehu A, Mandefro N, Ermias A (2016) Correlation and path coefficient analysis of yield and yield associated traits in barley (Hordeum vulgare L.) Germplasm. Adv Crop Sci Tech 4: 216.
- Panse VG (1957) Genetics of quantitative characters in relation to plant breeding. Indian Journal of Genetics and Plant Breeding 28: 225-229.
Citation: Dinsa T, Mekbib F, Letta T (2018) Genetic Variability, Heritability and Genetic Advance of Yield and Yield Related Traits of Food Barley (Hordeum vulgare L.) Genotypes in Mid Rift Valley of Ethiopia. Adv Crop Sci Tech 6: 401. DOI: 10.4172/2329-8863.1000401
Copyright: © 2018 Dinsa T, et al. This is an open-access article distributed under the terms of the Creative Commons Attribution License, which permits unrestricted use, distribution, and reproduction in any medium, provided the original author and source are credited.
Select your language of interest to view the total content in your interested language
Share This Article
Recommended Journals
Open Access Journals
Article Tools
Article Usage
- Total views: 5200
- [From(publication date): 0-2018 - Dec 19, 2025]
- Breakdown by view type
- HTML page views: 4146
- PDF downloads: 1054