Hydrological Responses of Climate Change on Lake Ziway Catchment, Central Rift Valley of Ethiopia
Received: 28-Apr-2018 / Accepted Date: 05-Jun-2018 / Published Date: 12-Jun-2018 DOI: 10.4172/2157-7617.1000474
Abstract
This study predicts future runoff conditions under changing climate using multi model outputs from Coupled Model Intercomparison Project Phase 5 (CMIP5) over Lake Ziway Catchment. The River system is located in the Central Rift Valley of Ethiopia which serves for wide range of socio-economic activity, but recently different water use sectors are increasing their pressure on the water balance of the catchment. Bias corrected precipitation, maximum and minimum temperature data from three climate models HadGEM2-ES, CSIRO-MK-3-6-0 and CCSM4 under representative concentration pathways RCP 8.5 and RCP 4.5 were used as input for the hydrologic model. A calibrated and validated HBV model is used to simulate the future inflow from Katar River and Meki River towards Lake Ziway. The result revealed that the maximum and minimum temperature increased under RCP 8.5 and RCP 4.5 scenarios. However, precipitation showed a decreasing trend. The percentage change in monthly average precipitation showed extremes for HadGEM2-ES model which range between -51.19% during January 2050s and +23.15% during February 2080s under RCP 8.5. The model output showed an annual decrement in runoff depth on Katar River up to 19.45% during RCP 8.5 on CSIRO MK-3-6-0 model and maximum reduction was recorded for RCP 4.5 at 17.49% for CCSM4 model. Meki River has shown maximum annual reduction of 20.28% during 2080s on RCP 8.5 for HadGEM2-ES model and seasonally during Bulg maximum increment was recorded for the same model which ranges up to 10.23% on 2050s for RCP 4.5. However seasonal maximum reduction is obtained from Bulg season by 40.27% on HadGEM2-ES model during 2050s. From the study, a reduction in rainfall has brought larger effects on runoff reduction than evapotranspiration components. Due to future reduction of River flow on the region optimal allocations for water use purposes at all levels of water resource development projects are crucial for future water planning and management.
Keywords: CMIP5; HBV model; Lake Ziway catchment; RCP; Runoff estimation
Introduction
In recent decades, changes in climate have caused impacts on natural and human systems on all continents and across the oceans. Irrespective of its cause, natural and human systems has become sensitive to climate change [1]. Increased anthropogenic activities on industries and population expansion towards forested areas during the last century has resulted for increase in concentration of carbon dioxide on Earth's atmosphere which resulted for rising global surface temperature, sea level rises, arctic and land ice decrease and erratic precipitation [1,2].
Many Ethiopia lakes are bounded within the Ethiopia Rift Valley that is part of great East African Rift Valley which extends from Jordan in the Middle East, through Ethiopia and ends at Mozambique in Southern Africa [3]. Lake Ziway is one of the lakes with in the central rift valley system which serves for wide range of socio-economic activity. Different water use sectors are recently increasing their pressure on the water balance of Lake Ziway which is recharged by precipitation and two rivers namely Katar and Meki Rivers [3-5]. Globally, water resources are under influence of the changing climate [6] and regionally its impact on rainfall and flood frequency, ground water recharge variability and storage has been observed over the past few decades on Ethiopia Rift Valley lakes [4,7-9]. Climate variability in the frequency and intensity of extreme events over the Ethiopian Rift Valley [7,10] has increased due to climate change. These changes can have a direct consequence on evapotranspiration and runoff component of the hydrologic cycle which effects sectors like agriculture, industry and urban development [11,12]. Changes in flow magnitude, variability on long-term mean annual stream flow and water availability are among frequently cited hydrologic issues in the region [4-5,10,13]. Existing studies have mainly focused on IPCCs fourth assessment report to assess the future water potentials and little is known about the potential impacts on River flows from the Climate Model Intercomparison Project Phase 5 archive (CMIP5) outputs [14].
Possible future changes in the precipitation and temperature extremes can be predicted by global circulation models (GCMs) [15]. On the Central Rift Valley, GCM simulations for daily data was collected from the Climate Model Intercomparison Project Phase 5 archive (CMIP5) [14]. The CMIP5 contains number of model output to enhance the understanding of climate processes and to conduct regional impact assessment research. Statistically downscaled data products of Coupled Model Intercomparison Project (CMIP5) multi-model ensemble and its predecessors are widely applied for hydrological models [14,16]. These downscaled data provide a basis of Intergovernmental Panel on Climate Change (IPCC) Fifth Assessment Report (AR5), which is relevant for policy makers in the assessment of climate change impacts on water resources. Representative concentration pathways (RCP ) have been also introduced in the CMIP5 ensemble data, which are more comprehensive than Special Report on Emission Scenarios (SRES).
Lake Ziway catchment covering a total area of about 6991 km2 contains Lake and River systems, where two Rivers namely Katar and Meki flowing towards Lake Ziway and one outflow River Bulbula flow towards Lake Abiyata. The flow scheme in the region passes through a densely populated area where water use for commercial farming, fishing and recreation by state and private sectors is gigantic. The outflow of Lake Ziway is an important source of the downstream terminal Lake Abiyata, whose quantity and quality is controlled by the outflow from Lake Ziway [5,17]. Predicted 21st century climatic changes are expected to impact a range of environmental processes in the catchment and therefore raise concerns for hydrological, environmental and economic issues [3].
Therefore, evaluation of climate change impacts on regional hydrology would greatly benefit policy makers and other stakeholders for better preparedness. In this study, we used bias corrected climate model output of CMIP5 ensembles (HadGEM2-ES, CSIRO-MK-3-6-0 and CCSM4) for simulation of river flows for impact evaluation. A calibrated and validated HBV-96 [18] hydrologic model was tested over Lake Ziway catchment to generate future inflows under RCP 4.5 and 8.5 scenarios for Katar and Meki Rivers respectively, and impact analysis was made using metrics that are useful for decision makers.
Materials And Methods
Study area
Lake Ziway is located about 160 kms south of the capital city Addis Ababa, in Ethiopia. Lake Ziway catchment falls in between 7°15’N to 8°30’N Latitude and 38°15’E to 39°30’E Longitude covering a total area of about 6991 km2 (Figure 1). The floor of Ethiopian Rift valley encompasses three major River basins from North East to South West namely Awash Basin; Central Ethiopian Rift Valley and Southern Basin [13]. From these basins, Lake Ziway Catchment is found in the Central Ethiopian Rift valley basin. It starts from the highlands of the Eastern Gurage Zone from which the Meki River is originating, passes through the central parts of the East Shoa Zone where Lake Ziway is located, and ends up in the Western Highlands of the Arsi Zone from which the Katar River is originating. Lake Ziway has an open water area of 442 km2 and elevation of 1636 m.a.s.l. with maximum and mean depth of 8.9m and 2.5m respectively [12].

Figure 1: The study area showing the Rift Valley Basin, Lake Ziway, Lake Ziway Catchment with hydro meteorological gauging locations and rivers.
The altitude of the catchment ranges from 1607 to 4181 m.a.s.l. with a mean elevation of 2266 m.a.s.l. Only one third of the whole watershed area has an elevation below 1867 m.a.s.l and more than 56% of the whole watershed has an elevation more than 2000 m.a.s.l, which magnifies the upland terrain of most parts of the area.
Baseline data
Climate and Hydrology: The rainfall pattern is largely influenced by the annual oscillation of the Inter-Tropical Convergence Zone. According to OEPO [19], the ‘Kiremt’ rainy season (June, July, August and September) represents 50-70% of the average yearly total rainfall. The dry period, which extends between October and February and locally known as ‘Bega’. OEPO [19] indicated that occasional rain during this period brings 10-20% of the yearly average rainfall. The other season, which is locally known as ‘Belg’ is of a ‘small rain’ season accounting for 20-30% of the annual amount, and stays from March to May (Figure 2).

Figure 2: Mean monthly rainfall of selected stations at Lake Ziway Catchment (1982-2011) (Source: NMSA).
According to the statistical analysis of the climatic data, the climate of the study area can be categorized as semi-arid to sub-humid type with a mean yearly rainfall ranging from 704.4 mm (Adamitulu) to 1084.4 mm (Bekoji), and with a mean yearly minimum and maximum temperature ranging from 8.4°C (Bekoji) to 13.7°C (Ziway), and from 19.43°C (Bekoji) to 28°C (Langano) respectively.
The watershed is composed of two main rivers flowing into Lake Ziway namely, Meki and Katar River which are used for model calibration and validation, and one outflow river called Bulbula River drains into Lake Abiyata through its spills.
The western plateau of the Gurage Zone highlands with elevation ranging from 3500 to 3600 m.a.s.l are the sources of Meki River. The watershed area of 2300 km2 is bounded by the Awash River to the north and by Omo River Basin to the west. River Meki drains the western mountains and escarpments including a vast swampy area to the south of Butajira town. The other River Katar originates in eastern volcanic chains of the Arsi Zone about 4000-4250 m.a.s.l. It is the largest tributary of Lake Ziway with a catchment area of 3430 km2, and has a common boundary with the Awash River Basin in the north and with Wabi- Shebele River Basin in the west. River Katar and its tributaries drain the highland area to the south and east of Lake Ziway. The Bulbula River is an outflow from Lake Ziway and feeds to downstream Lake Abiyata. As a result, it is completely dependent on Lake Ziway water level [19].
HBV-96 model requires daily stream flow data for base line period calibration of the model to generate future inflows to the Lake. This data was obtained from the Hydrology Department of the Ministry of Irrigation Water and Energy of Ethiopia (MoIWE) (Figure 3).

Figure 3: Mean monthly River flow of gauged stations at Lake Ziway Catchment 1989-2000 (Source: MoIWE).
Catchment data
A semi-distributed HBV-96 model needs sub-division of the basin in to different elevation and vegetation zones. Each elevation zone was also divided in to different vegetation cover, forested and nonforested areas [20]. Therefore, Lake Ziway Catchment was processed and divided in to different elevations and vegetation zone using DEM hydro-processing from Shuttle Radar Topography Mission (SRTM). Resolutions of 30m * 30m and the land cover data of the study area are used to extract drainage area, drainage network and to divide the area into different sub basins and elevation zones. Spatial data of land use/land cover map of 1996 and shape files were collected from GIS department of Ministry of Irrigation, Water and Energy of Ethiopia (Figure 4).

Figure 4: Lake Ziway Catchment major land cover of 1996 (left) and elevation zones (right).
The land use of the study area can be categorized mainly as agricultural, forest, bush, bare land, savanna, and water bodies. Irrigated agriculture is common especially along the courses of the Meki River, Katar River, Bulbula River and around Lake Ziway. Onion, tomato, cabbage, pepper, beans, maize, fruits and vegetables are widely cultivated in many private and state farms in the area.
Climate projection
Horizontally gridded CMIP5 model group outputs were employed to predict the past and the future climatic conditions of the study area. Observed precipitation and temperature dataset at monthly time scale from 1980 to 2005 are downloaded from the above model group web pages (https://climexp.knmi.nl/select.cgi). Coupled model output data (precipitation and surface air temperature) of a historical run from 1850 to 2005 and two future projection simulations from 2010 to 2099 under two Representative Concentration Pathways were obtained. The RCP 4.5 represents a moderate mitigation scenario [21], while RCP 8.5 represents the higher stabilization pathway, where wider range of radiative forcing across the RCP extensions is provided [22]. Hence RCP s required for planning the adaptation and mitigation option for the response of river flow by changing climate. These data are extracted from the World Climate Research Program Coupled Model Intercomparison Project Phase 5 (CMIP5) [14].
Outputs of coupled climate models, three GCMs were employed over Lake Ziway catchment, as shown in Table 1. The selection of the GCM model was based on how well models represent the past and the present climate, their resolution and other studies related to the impact of climate change on the Ethiopian Rift Valley and adjacent plateau. HadGEM2-ES, CSIRO-MK-3-6-0 and CCSM4 models are recognized as being capable of reproducing the precipitation and temperature pattern on the Ethiopian Rift [23-28].
| Model Name | Model Center | Atmospheric Resolution (Longitude × Latitude) |
|---|---|---|
| HadGEM2-ES | Hadley Centre for Climate Prediction and Research, Met Office, United Kingdom | 1.875° × 1.25° |
| CCSM4 | National Center for Atmospheric Research | 1.25° × 0.9° |
| CSIRO-MK-3-6-0 | Commonwealth Scientific and Industrial Research Organization, Australia | 1.9° × 1.9° |
Table 1: Description of the climate models used in this study.
The daily precipitation, Tmax and Tmin from 1980 to 2099, was extracted from grid cells covering Lake Ziway Catchment. The period from 1980 to 2005 was defined as the baseline period, based on good quality of observational climatic and hydrological data for model calibration and validation. While the future periods that are covered by this study are 2010–2040, 2041–2070, and 2071–2099 (denoted by the 2020s, 2050s, and 2080s, respectively) relative to the baseline period during 1980–2005. Future climate time series were constructed using the delta change method [8,29] which involves observed climate time series by mean changes (differences or ratios of changes) simulated with GCMs. The changes were determined as monthly temperature changes (in °C) and monthly precipitation changes (in %) values from the base period during 1980-2005.
CMIP5 GCM models were selected based on how well models represent the past and the present climate. In this regard bias correction of precipitation data has employed a nonlinear method [30] which corrects coefficient of variation (CV) and the mean [31] Eqn. (1) while temperature correction is done by calculating monthly systematic biases [8,24,32] Eqn. (2).
P* = aPb (1)
Where P* is the simulated data in the projection period, where ‘a’ and ‘b’ are the parameters obtained from calibration in the baseline period and subsequently applied to the projection period. They are determined by matching the mean and coefficient of variation (CV) of simulated data with that of observed data.
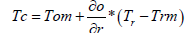 (2)
(2)
Where;
Tc is bias corrected future temperature, Tom is mean of observed temperature in base period, Trm is mean of RCP s temperature in base period and Tr is RCP s temperature of base period δr, and δo, represent the standard deviation of the daily RCP s output and observations in the reference period respectively.
HBV- 96 model
The HBV model was developed at Swedish Metrological and Hydrological Institute (SMHI) during the early 1970’s. This model has been applied worldwide [33-35] and regionally [15,36,37]. HBV is a semi–distributed conceptual rainfall-runoff model for continuous simulation of catchment runoff and out flow from reservoirs. The model consists of subroutines for snow accumulation and melt, soil moisture accounting procedure, routines for runoff generation and finally, a simple routing procedure.
In HBV Precipitation calculations are made separately for each elevation/vegetation zone with in the basin [20]. To separate between snow and rainfall a threshold temperature (tt) in the range between -2°C to 2°C was used in Eqn. (3).
RF = pcorr *rfcf * p if T > tt (3)
Where: RF = rainfall, P = observed precipitation (mm), T = observed temperature (°C), tt = threshold temperature for precipitation (°C), rfcf = rainfall correction factor, pcorr = general precipitation correction factor.
The soil moisture accounting routine is the main part controlling runoff formation. The soil routine in the HBV model is governed by two rather simple relations and the three parameters Beta, LP and FC. At low soil moisture levels most of the precipitation is kept within the unsaturated zone. The share of precipitation contributing to the discharge increases gradually as the soil moisture increases as a bigger part of the area reaches its field capacity (FC). This process was run by FC and Beta. Beta controls the contributions of the response function (ΔQ/ΔP) or the increase in soil moisture storage (1- ΔQ/ΔP) from each millimeter of rainfall or snow melt. The ratio ΔQ /ΔP is often called runoff coefficient, where ΔP contribution from rainfall and ΔQ is contribution to the response function [20]. LP is a soil moisture value above which evapotranspiration reaches its potential value, and FC is the maximum soil moisture storage (in mm) in the model. The parameter LP is given as a fraction of FC, therefore as LP increases, the base flow increase and quick runoff decreases.
The runoff generation routine is the response function which transforms excess water from the soil moisture zone to runoff. The function consists of one upper, non-linear, and one lower, linear reservoir. These are the origins of the quick and slow runoff components of the hydrograph. The yield from the soil moisture zone, i.e., the effective precipitation, will be added to the storage in the upper reservoir. As long as there is water in the upper reservoir, water will percolate to the lower reservoir according to the parameter perc. The lower reservoir, on the other hand, represents the groundwater storage of the catchment contributing to the base flow. K and K4 represent the recession coefficient from the upper and lower reservoir respectively. In this case outflow upper and lower reservoir is calculated according to the formula (Eqn. 4 and Eqn. 5) respectively.
 (4)
(4)
Q1 = K4* LZ (5)
Where: Qo = upper reservoir outflow (mm), Q1 = lower reservoir outflow (mm), UZ = upper reservoir storage (mm), LZ= lower reservoir storage (mm), K = recession coefficient on upper reservoir and K4= recession coefficient on lower reservoir.
The runoff generated from the response routine (Q = Q0+Q1) is routed through a transformation function in order to get a proper shape of the hydrograph at the outlet of the sub basin. The transformation function is a simple filter technique with a triangular distribution of the weights, as shown in Figure 5. The time base of the triangular distribution is given by the parameter maxbaz.

Figure 5: The transformation function used in HBV-96 model [20].
Model inputs
The conceptual semi-distributed HBV model computes runoff from observed daily rainfall, temperature, long-term monthly potential evapotranspiration, catchments characteristics of different elevation and vegetation zones [37] and river flow data for model calibration and validation.
Areal rainfall
For many hydrological applications that also include modeling, extrapolation and interpolation of point rainfall measurement is necessary. The Thiessen polygon method which is one way of calculating areal precipitation was used for this study. This method gives weight to station data in proportion to the space between the stations [20] (Table 2). However, factors such as topography and the representativity of a station have to be taken into consideration. Therefore, decisions about the technique used for processing of gauged data, as well as the adequacy of conclusions drawn from the final results, depend heavily on the magnitude and nature of the uncertainty [38]. For this study, daily areal rainfall was calculated from the daily point measurement of rainfall in and around the catchments by Thiessen polygon method Eqn. (6).
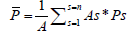 (6)
(6)
Where:  - Areal average rainfall, Ps - Rainfall measured at subregion, As - Area of sub-region and A - total area of sub regions.
Potential evapotranspiration
For calibration and validation of HBV-96 Model Penman-Monteith method is recommended to calculate the daily potential evaporation when all climatological data like rainfall, maximum and minimum temperature, relative humidity, sun shine hours and wind speed are available [39]. Average of potential evapotranspiration from Ziway and Kulumsa stations were used for model calibration and validation; since all required evapotranspiration variables are well recorded and available for these stations Eqn. (7).
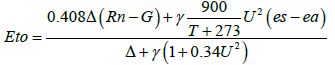 (7)
(7)
Where:
Eto = Reference evapo-transpiration [mm day-1]
Rn = Net radiation at the crop surface [MJ m-2 day-1]
G = Soil heat flux density [MJ m-2 day-1]
T = Mean daily air temperature at 2 m height [°C]
U2 = Wind speed at 2 m height [m s-1]
es = Saturation vapour pressure [kPa]
ea = Actual vapour pressure [kPa]
es-ea = Saturation vapour pressure deficit [kPa]
Δ = Slope vapour pressure curve [kPa °C-1]
γ = Psychrometric constant [kPa °C-1]
In Eqn. (5) the value 0.408 converts the net radiation Rn expressed in MJ m-2 day-1 to equivalent evaporation expressed in mm day-1.
In a situation where solar radiation, wind speed, relative humidity and other data are completely absent, reference evapotranspiration for future runoff generation can be estimated using the equation stated by Hargreaves and Samani [40] Eqn. (8). Since the existing data for future time period were the downscaled precipitation, minimum and maximum temperature. The potential evapotranspiration was also calculated by dividing the future time in to three non-overlapping 30 year periods (i.e., 2020s, 2050s and 2080s).
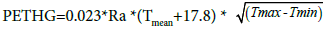 (8)
(8)
Where: PETHG Hargreaves potential evapotranspiration [mm month-1]
Ra Extraterrestrial radiation (calculated from latitude and time of year) [MJm-2day-1]
Tmean Mean temperature [°C]
Tmin Minimum temperature and [°C]
Tmax Maximum temperature [°C]
HBV-96 model calibration and validation
According to IHMS [20], HBV model parameters can be grouped into volume controlling (FC, LP and Beta) parameters, that influence the total volume and shape controlling parameters (K4, Perc, khq, Hq and Alfa) that distribute the calculated discharge in time and inflaming the shape of hydrograph. The parameter maxbaz which control the smoothness of the hydrograph was also calibrated for this study. Hq is the high flow level at which the recession rate khq is assumed to hold. The program uses the parameters khq, Hq and alfa to calculate the value of k assuming khq to be recession rate for high flow level at Hq. Normally the parameter Hq is not calibrated; it was calculated from the mean of observed discharge over the whole period and the mean of annual peak flows Eqn. (9).
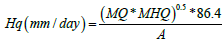 (9)
(9)
Where: MQ: the mean of observed discharge over the whole period (m3/s), MHQ: is the mean of annual peak flow (m3/s) and A: area of catchment in km2.
Hq for Katar and Meki river basin is of 7.81 and 0.703 mm/day respectively. The quick flow was calibrated by khq and Alfa. Khq result in higher peaks and more dynamic response on the hydrograph. Alfa was used in order to fit the higher peaks in to the hydrograph, the higher the Alfa the higher the peaks and the quicker the recession [20]. Base flow was adjusted with perc and K4 as a lower value of perc result in low base flow and K4 describes the recession of base flow. In HBV-96 model, it is recommended that calibration be done with not less than ten years of data. For this study a baseline period data during 1989- 2000 was used for model calibration and validation. Before starting the calibration, 1 year of daily in the 1989 data was used as warm up period to initialize the model before calibration. The remaining 11 years were divided in such a way that 2/3rd of the data during 1990-1996 were used for calibration and 1/3rd of the data during 1997-2000 was used for validation.
Goodness of fit test of the model
The level of goodness of fit was evaluated by the objective function that measures the level of agreement between the observed and the model output, i.e., the observed and modeled discharge [41]. In IHMS/HBV this is mainly done by calculating the coefficient of determination R2, Eqn. (10), Nash and Sutcliffe coefficient (NSE) [42] Eqn. (11) and the relative volume of error was also used to test the model performance Eqn. (12).
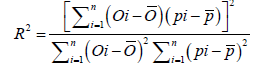 (10)
(10)
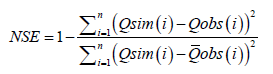 (11)
(11)
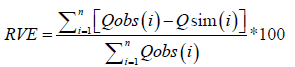 (12)
(12)
Where:
Qobs: Observed flow, Qsim: Simulated flow and  : Average of observed flow.
The RVE can vary between ∞ and -∞ but it performs best when a value of 0 (zero) is generated. Since an accumulated difference between simulated, Qsim (i) and observed Qobs (i), discharge is zero. A relative volume error between +5% and -5% indicates that a model performs well while relative volume errors between +5% and +10% and -5% and -10% indicates a model with reasonable performance.
Results and Discussion
Performance of GCM models
The correlations of precipitation, Tmin and Tmax with observations have to be done to selected suitable models for the area. They found CSIRO-MK 3-6-0 and HadGEM2-ES perform well on reproducing precipitation. Whereas, CCSM4 have higher skill in simulating Tmin and Tmax.
The best way to check rainfall is to calculate the monthly means and variances; these are closer to normal distributions than daily data are [43]. If these both match, then the simulation is working. Correlation will also give representative result if correlation of the monthly rainfall sums is done. However, the best test is still to compare the means and variances (Figure 6) [43].

Figure 6: Comparison between the statistical properties of the observed daily precipitation (a), maximum temperature (b) and minimum temperature (c) data for the period 1980-2005 and the three GCM outputs.
The annual variability of the daily mean and variance of daily precipitation for the three GCM outputs, and the observed data averaged for the period 1980–2005, is given in Figure 6. For the HadGEM2-ES and CSIRO-MK-3-6-0 models, the annual variability of the monthly mean precipitation data is completely in order, corresponding to the observed data. For the CSIRO-MK-3-6-0 models, most months were quite good, while other months (April, May and Aug) showed a clear difference. Furthermore, the CCSM4 model has a general tendency to underestimate the monthly variance on most months of the year, except September. For the daily variance, the HadGEM2-ES models have the highest variability while the CSIRO-MK-3-6-0 presented a lowest variance.
Figures 6b and 6c show the monthly mean and variance comparison between the observed data and three GCM outputs for the Tmax and Tmin data. The three GCMs are capable of reproducing the observed mean Tmax and Tmin values with small biases. The variance of the HadGEM2-ES and CCSM4 showed clear differences in some months for Tmax, while the CCSM4 and CSIRO-MK-3-6-0 models have showed the highest variance across the months for Tmin.
The statistical tests of GCM outputs evaluation to simulate historical records of climatic variables showed good simulation results for Tmax and Tmin than for rainfall. Rainfall simulation is affected due to the fact that GCM failure to capture the seasonal migration of the Inter- Tropical Convergence Zone in these equatorial regions [44]. Regardless of the uncertainties related with GCMs, the three models have been selected based on their ability to representing the actual climate over Lake Ziway Catchment. This selection is also supported by the ability of these models to reproduce the mean annual precipitation for 1980- 2005 period, which is mainly important variable for modeling the hydrological impact on Lake Ziway Catchment.
Analysis of monthly and seasonal future climate on lake ziway catchment
For this study, monthly and seasonal analysis was taken for Ethiopian local season of Belg (March, April and May), Kiremt (June, July, August and September) and Bega (October, November, December, January and February) over Lake Ziway Catchment. Future climate from CMIP5 model outputs for three climate variables (precipitation, maximum and minimum temperature) under RCP 4.5 and RCP 8.5 are summarized below.
Maximum temperature
There is a general increasing trend for maximum temperature from baseline period under RCP 4.5 and RCP 8.5 except for the months of March and September in all time periods under RCP 4.5 for HadGEM2- ES and CSIRO-MK 3-6-0 model (Figure 7). However, CCSM4 model has shown absolute maximum temperature increment almost for all months under RCP 4.5 and RCP 8.5. Seasonally, maximum amount of temperature increment is projected during Ethiopian local dry season of ‘Bega’ (Oct-Feb) for the three model outputs of CMIP5. This dry period ‘Bega’, is primarily controlled by the seasonal migration of the Inter Tropical Convergence Zone (ITCZ) which lies to the south of Ethiopia at that time. Also, on Bega season the contribution of rainfall for the area is very minimum to supplement agriculture where by, almost all farming activity is supplemented by irrigation from the water sources on Lake Ziway Catchment [9].

Figure 7: Absolute difference in mean monthly and seasonal maximum temperature under RCP 4.5 and RCP 8.5 for the future period (2010-2099).
The maximum amount of average annual temperature is projected from HadGEM2-ES model under RCP 8.5 during 2080s and the minimum average annual temperature is projected from CSIRO-MK 3-6-0 model under RCP 4.5 during 2020s (Figure 7). The same trend has been also reported on the projected average annual temperature by [45,46] where, increased extreme daily temperature events prevailed for future scenarios [24]. Maximum amount of temperature change from RCP 8.5 is due to the fact that RCP 8.5 produces more greenhouse gas as compared to RCP 4.5, which is medium in greenhouse gas production [47].
Minimum temperature
For minimum temperature, there is a general increasing trend from baseline period under RCP 4.5 for the three models except on March for HadGEM2-ES, October on CSIRO-MK 3-6-0 and July CCSM4 (Figure 8). However, on RCP 8.5 all models have shown absolute minimum temperature increment almost for all months except October on CSIROMK 3-6-0 model and February and July on CCSM4 model. Seasonally, maximum amount of temperature increment is projected during Ethiopian local season of ‘Kiremt’ (June-September) for the three model outputs of CMIP5.

Figure 8: Absolute difference in mean monthly and seasonal minimum temperature under RCP 4.5 and RCP 8.5 for the future period (2010-2099).
The same conclusion has reached upon like the case of maximum temperature, where minimum temperature change also exceeds for RCP 8.5 than RCP 4.5 due to the fact that, RCP 8.5 represents high emission scenario which produces more greenhouse gas as compared to RCP 4.5 [47].
Precipitation
The overall result revealed that, percentage change in monthly average precipitation might range between -51.19% during January 2050s and +23.15% during February 2080s under RCP 8.5 for HadGEM2-ES model. But the change in monthly average precipitation ranges between -27.13% during January 2020s and 29.80% during November 2020s on RCP 4.5 for HadGEM2-ES model (Figure 9).

Figure 9: Percentage change in mean monthly and seasonal precipitation at different time horizon under RCP 4.5 and RCP 8.5 for the future period (2010-2099).
Annually, projected decrement for precipitation has shown by 2.8%, 7.5% and 7.97% for RCP 8.5 during 2020s, 2050s and 2080s respectively. However, for RCP 4.5 precipitations is projected to increase in amount by 2.69% on 2020s and decrease by 2.7%, and 1.6% during 2050s and 2080s, respectively which is having similar projection by [46]. However, seasonally maximum precipitation reduction is projected during the Ethiopian local rainy season of ‘Kiremt’ in all the model outputs.
Furthermore, inter-annual and intra-seasonal rainfall variability in the Central Rift Valley is accompanied by a significant warming trend in temperature and reduction of rainfall can add stress to crop growth during this season. The occurrence of warming across Ethiopia is reported previously by Conway [48] as shown by Boberg and Christensen [49] and decline in precipitation up to 25% is also shown by Monireh et al. [46].
Hydrological model calibration and validation results
Calibration was done manually by optimizing the model parameters in each subroutine that have significant effect on the performance of the model. Based on this, several runs were made to select the most optimum parameter set in order to match the observed discharge with simulated discharge. The most optimum parameters set that were used in the calibration are reported in Table 3.
| Parameters | Range | Starting Value | Calibration Value (on Katar River) | Calibration Value (on Meki River) |
|---|---|---|---|---|
| α | 0.5 -1.1 | 0.9 | 1.05 | 0.5 |
| β | 1.0-4.0 | 1 | 1 | 1.06 |
| FC | 100-1500 | * | 703 | 514 |
| KHq | 0.005-0.2 | 0.09 | 0.1155 | 0.08 |
| K4 | 0.001-0.1 | 0.01 | 0.0015 | 0.008 |
| LP | ≤1 | 1 | 0.45 | 0.589 |
| Perc | 0.01-6 | 0.5 | 0.2 | 0.01 |
Table 3: List of optimal parameters set in HBV-96 model calibration for Katar and Meki River.
HBV-96 Model calibration was performed for seven years during 1990-1996 using daily stream flow data at lower Katar and lower Meki River outlets. The goodness of fit tests of Coefficient of Determination (R2), Nash and Sutcliffe Efficiency Criteria (NSE) and Relative Volume Error (RVE) which were used to evaluate the model performance on monthly basis have showed good agreement (Table 4).
| Outlets Point | Period | R2 | NSE | RVE |
|---|---|---|---|---|
| Calibration | ||||
| Lower Katar | 1990-1996 | 0.86 | 0.84 | -0.0021 |
| Lower Meki | 1990-1996 | 0.84 | 0.84 | 0.083 |
| Validation | ||||
| Lower Katar | 1997 -2000 | 0.84 | 0.822 | -0.05 |
| Lower Meki | 1997 -2000 | 0.8 | 0.79 | -0.06 |
Table 4: Monthly calibration and validation result between observed and simulated discharge.
From visual inspection of observed and simulated hydrograph the performance of the model in simulating base flow, rising and recession limbs of the hydrograph is shown in Figures 10 and 11.

Figure 10: Observed and simulated daily hydrograph during calibration and validation period for Katar River.

Figure 11: Observed and simulated daily hydrograph during calibration and validation period for Meki River.
Observed and simulated hydrograph of the model in simulating base flow, rising and recession limbs of the hydrograph is good monthly basis for Katar basin; despite under estimation on high river discharge periods of 1992, 1995 and 1996 during calibration.
For Meki River the observed and simulated hydrographs of the model in simulating base flow, rising and recession limbs of the hydrograph were good as well on monthly basis. The goodness of fit tests, R2 and NSE coefficients are also well above 0.8 on monthly basis.
Impact on seasonal and annual flow of Katar River
For this study seasonal analysis was taken for Belg (March, April and May), Kiremt (June, July, August and September) and Bega (October, November, December, January and February) on Katar River.
For the HadGEM2-ES model maximum flow reduction was observed during the rainy season ‘Kiremt’ on average. It shows reduction of 10.78%, 17.58% and 19.23% for the periods of 2020s, 2050s and 2080s respectively under RCP 8.5. Reduction is also reported by 16.79%, 22.01% and 20.75% for the same time period under RCP 4.5 (Figure 12). And annually maximum reduction is projected on this model at 14.67% during 2080s under RCP 8.5. Generally, flow reduction from this model corresponds with the reduction in precipitation on the same season. CSIRO-MK 3-6-0 model has also shown maximum flow reduction during the rainy season ‘Kiremt’ on average basis. It shows reduction of 18.78%, 17.58% and 19.54% for the periods of 2020s, 2050s and 2080s respectively under RCP 8.5. Reported reduction is projected by 13.25%, 15.26% and 18.26% for the same time period under RCP 4.5 (Figure 12). Annually maximum reduction is projected from this model by 19.45% during 2080s under RCP 8.5. On the other hand, CCSM4 model has shown maximum flow reduction by 25.75% during 2080s under RCP 4.5 which is the extreme as compared with the above model groups. Generally, flow reduction from the model groups is also shown by previous study on the neighboring Awash River Basin ranging between 10% to 34% using different GCM outputs [12]. Annually, flow shows reduction for both scenarios has complied with the precipitation reduction. Therefore, the River flow is found to be very sensitive to variations in precipitation than temperature changes. However, the study done in the rift [7] indicated that under high or low warming trends a very slight proportional change in evapotranspiration resulted in high relative change in ground water recharge and surface runoff. Also decrease in ground water recharge is reported on the northern part of Ethiopia on Tekeze river basin under future scenarios of RCP 2.6 and RCP 4.5 [31].

Figure 12: Percentage change in seasonal and annual inflow at Katar River with respect to baseline period for the HadGEM2-ES, CSIRO-MK 3-6-0 and CCSM4 model.
This result shows the maximum flow reduction during rainy season of Kiremt that comply with previous study on the area [9]. Large flow increment on discharge during the first months of the year (especially January to March) over most parts of Ethiopia and Kenya is also evident and has the potential to compromise the percentage flow change [50].
Impact on seasonal and annual flow of Meki River
Flow reduction on Meki River was observed during ‘Belg’ season across all the model groups. Maximum flow reduction reaches 40.27% for the periods of 2050s under RCP 8.5 for the HadGEM2-ES model. A slight flow increment is observed during the local dry season of ‘Bega’ on HadGEM2-ES model for both concentration pathways (Figure 13). Other slight increment is also predicted during the 2080s from CCSM4 model output under RCP 4.5 scenario which represents a range of technologies and strategies for reducing GHG until 2100 [21].

Figure 13: Percentage change in seasonal and annual inflow at Meki River with respect to baseline period for the HadGEM2-ES, CSIRO-MK 3-6-0 and CCSM4 model.
Flow reduction from this model furthermore has correspond with the reduction in precipitation on the same season. Annually maximum reduction is projected from model by 20.28% during 2080s from HadGEM2-ES model under RCP 8.5. On the other hand, CCSM4 model has shown minimum flow reduction by 1.1% during 2080s under RCP 4.5 (Figure 13). Also for this model groups, the precipitation reduction is the major driving factor for flow reduction.
This result showed that maximum flow reduction for Meki River was expected from Belg season, which is different from Katar river inflow where maximum reduction occurred during Kiremt. Seasonal change in flow volume from Katar and Meki rivers will have implication on the socio-economic conditions with respect to reduction for irrigation potential, Lake level [5] and on out flow river. Increased Bega stream flow for indicated periods and scenarios is desirable to exploit the irrigation potential of the sub-basins thereby improving the irrigated agricultural production in the area, whose agriculture is rainfall dependent [51]. Kiremt flow volume might show highest decrease for Katar River and Belg seasons show the highest reduction from Meki River for both scenarios, which will greatly affect Lake Ziway level. This effect has also been indicated by Zeray and Alemayehu et al. [9,13] drop on lake level that may rich up to two third of a meter, surface area might also shrink by 25.3 km2, which is about 6% of the base period lake surface area.
On Central Rift Valley (CRV) human impacts contributed to the changes in the hydrology of Lake Ziway and Lake Abiyata causing a decrease in lake storage and prolonged dry periods [5]. This shows a worsening trend of the recent lake level fluctuation and aerial coverage contraction. This combined with the unbalanced supply-demand equation in the watershed is expected to have significant impact on the lake water balance.
Other clear indicator is the fate of Bulbula River flowing out of Lake Ziway, recently its flow is observed to be intermittent and number of state and private farms that were operating on it was closed up. Hence, it is imaginable to predict its complete existence on future for indicated inflow scenarios. The increasing water abstraction for industrial and agricultural activities [5] due to economic development and population growth [10] is also likely to further reduce seasonal flows [12] and downstream Lake Abiyata surface area [5]. Projected flow reductions studies have also showed decrement in water levels that reduce production of hydropower potential across different river basins [52-54]. Furthermore, Pachauri and Meyer [1] reported climate change over the 21st century is projected to reduce renewable surface water and groundwater resources in driest subtropical regions, intensifying competition for water among sectors. As this region is largely occupied by rural settlers they are expected to experience major impacts on water availability and supply, food security, infrastructure and agricultural incomes, including shifts in the production areas of food and non-food crops around the world [1].
Therefore, in Lake Ziway catchment, runoff is likely to decrease in the future and insufficient to meet future demands for water of the everincreasing population in the region. That requires integrated basinwide water management practice for the region [13].
Conclusion
CMIP5 model outputs from IPCC 5th assessment report has been used to assess the response of Katar and Meki River and their implication to Lake Ziway that was projected by using three GCMs and a semi distributed hydrologic model (HBV-96). Projection of the three GCMs HadGEM2-ES, CSIRO-MK 3-6-0 and CCSM4 pointed out that temperature will increase and precipitation reduced for future periods denoted by 2020s, 2050s and 2080s. The decrease in precipitation and increase of air temperature as projected by model group of CMIP5 IPCC appears to have a negative impact on Katar and Meki River flow potentials. These effects caused by slight projected temperatures rise coupled with decrease in future precipitation brought overall reduction on the River flows.
The HBV-96 model output showed that HadGEM2-ES, CSIROMK 3-6-0 and CCSM4 models showed flow reduction during the rainy season ‘Kiremt’ on extreme case under RCP 8.5 on Katar River. CCSM4 model has shown maximum flow reduction by 25.75% during 2080s under RCP 4.5 which is the extreme as compared with the above model groups. On Meki River seasonally flow reduction was observed during ‘Belg’ across all the model groups. Maximum flow reduction reaches 40.27% for the periods of 2050s under RCP 8.5 for the HadGEM2- ES model. A slight flow increment is observed during the local dry season of ‘Bega’ on HadGEM2-ES and CCSM4 model. Flow reduction from this model furthermore has corresponded with the reduction in precipitation on the same season. Annually maximum reduction is projected during 2080s from HadGEM2-ES model. On the other hand, CCSM4 model has shown minimum flow reduction during 2080s under RCP 4.5. Flow shows reduction for both scenarios has complied with the precipitation reduction. HBV-96 simulation results also suggest that River flow highly comply with the seasonal rainfall pattern and, therefore River flow is found to be very sensitive to variations in precipitation than temperature changes. Despite uncertainties on GCM and hydrological models, the result suggest early decrease in water use from different water use sectors in Lake Ziway Catchment as the best water resource management strategy. Furthermore, the integrated watershed development in Lake Ziway Catchment should be considered, to reduce the adverse impact of climate change particularly during local rainy season on rain fall dependent agriculture, River and Lake water user communities.
Therefore, projected scenarios on River flow and climate change would significantly affects the livelihood of farmers and water using sectors in the area. Thus, concern for climate change and water management strategies should have to be given priority to mitigate the impacts. Furthermore, this study need to be extended to see the role of other climate model groups and use of new assessment reports, and further investigations on impact of other water sources like groundwater has to be done to fill the gap [55].
Acknowledgements
The authors wish to thank Hawassa University for their grant support for handling this research activity. We are also grateful for the support from the National Meteorological Services Agency, Ministry of Water Irrigation and Electricity of Ethiopia and Rift Valley Basin Development Regional Office for providing us the required data and information. All our colleagues, who participated by providing material support, consultation and proof reading of the manuscript are greatly acknowledged.
References
- Pachauri RK, Meyer LA (2014) Contribution of Working Groups I, II and III to the Fifth Assessment Report of the Intergovernmental Panel on the Climate Change: Synthesis Report. IPCC 151.
- Hengsdijk H, Jansen H (2006) Agricultural development in the Central Ethiopian rift valley: A desk-study on water-related issues and knowledge to support a policy dialogue. Wageningen, Plant Research International 1-25.
- Ayenew T (2007) Water management problems in the Ethiopian Rift: Challenges for development. J Afr Earth Sci 48: 222-236
- Seyoum WM, Milewski AM, Durham MC (2015) Understanding the relative impacts of natural processes and human activities on the hydrology of the Central Rift Valley lakes, East Africa. Hydrol Process 29: 4312-4324
- Arnell NW, Gosling SN (2013) The impacts of climate change on river flow regimes at the global scale. J. Hydrol 486: 351-364.
- Mechal A, Wagner T, Birk S (2015) Recharge variability and sensitivity to climate: the example of gidabo river basin, main Ethiopian rift. J Hydrol Regional Studies 4: 644-660.
- Biniyam Y, Kemal A (2017) The impacts of climate change on rainfall and flood frequency: the case of hare watershed, southern rift valley of Ethiopia. J Earth Sci Clim Change 8: 383.
- Zeray L (2007) Climate change impact on lake ziway watershed water availability, Ethiopia. Proceedings of the International Joint Conference on Catchment And Lake Research.
- Legesse D, Abiye TA, Vallet-Coulomb C, Abate H (2010) Streamflow sensitivity to climate and land cover changes: Meki River, Ethiopia. Hydrol Earth Syst Sci 14: 2277-2287.
- Vallet-Coulomb C, Legesse D, Gasse F, Travi Y, Chernet T, et al. (2001) Lake evaporation estimates in tropical Africa (Lake Ziway Ethiopia). J Hydrol 245: 1-18.
- Hailemariam K (1999) Impact of climate change on the water resources of Awash river basin, Ethiopia. Cli Res Inter Multidisciplinary J 12: 91-96.
- Alemayehu T, Ayenew T, Kebede S (2006) Hydrogeochemical and lake level changes in the Ethiopian Rift valley. J Hydrol 316: 290-300.
- Taylor KE, Stouffer RJ, Meehl GA (2011) An overview of CMIP5 and the experiment design. Bull Am Meteorol Soc 93: 485-498.
- Gebre SL, Tadele K, Gebre-Mariam B (2015) Potential impacts of climate change on the hydrology and water resources availability of didessa catchment, Blue Nile River Basin, Ethiopia. J Geol Geosci 4
- Meehl GA, Moss R, Taylor KE, Eyring V, Stouffer RJ, et al. (2014) Climate model intercomparisons: preparing for the next phase. Eos Trans Agu 95: 77-78
- Legesse D, Vallet-Coulomb C, Gasse F (2004) Analysis of the hydrological response of a tropical terminal lake, Lake Abiyata (Main Ethiopian Rift Valley) to changes in climate and human activities. Hydrol Process 18: 487-504.
- Seibert J (2005) HBV Light – User’s manual, department of physical geography and quaternary geology, Stockholm University, ‎Stockholm, Sweden.
- OEPO (2005) The Oromia National Regional Government, Oromia Environmental Protection Office: A review of the current status and an outline of a future management plan for lake Abiyata and Ziway: Draft final report. Sponsored by UNDP-CCF2 Program 104.
- Van Vurren D, Edmonds J, Kainuma M, Riahi K, Thomson A, et al. (2011) The representative concentration pathways: an overview. Climatic Change 109: 5-31.
- Moss RH, Edmonds JA, Hibbard KA, Manning MR, Rose SK, et al. (2010) The next generation of scenarios for climate change research and assessment. Nature 463: 747-756.
- Asaminew TG, Araya A, Atkilt G, Solomon H (2017) Modeling the potential impact of climate change on cotton (Gossypium hirsutum) production in northeastern semi-arid afar and western Tigray regions of Ethiopia. J Earth Sci Clim Change 8: 390.
- Negash W, Jain MK, Goel NK (2013) Effect of climate change on runoff generation: Application to rift valley lakes basin of ethiopia. J Hydrol Engg p: 18.
- Setegn SG, Rayner D, Melesse AM, Dargahi B, Srinivasan R, et al. (2011) Impact of climate change on the hydroclimatology of Lake Tana Basin, Ethiopia. Water Resour p: 47.
- Taye MT, Ntegeta V, Origamoi NP, Willems P (2011) Assessment of climate change impact on hydrological extremes in two source regions of the Nile river basin. Hydrol Earth Syst Sci 15: 209-222.
- Beyene T, Lettenmaier DP, Kabat P (2010) Hydrologic impact of climate change on the Nile River Basin: implications of the 2007 IPCC scenarios. Clim Change 100: 433-461.
- Jury MR (2015) Statistical evaluation of CMIP5 climate change model simulations for the Ethiopian highlands. Int J Climatol 35: 37-44.
- Fowler HJ, Blenkinsop S, Tebaldi C (2007) Linking climate change modelling to impacts studies: recent advances in downscaling techniques for hydrological modeling. Int J Climatol 27: 1547-1578.
- Leander R, Buishand TA (2007) Resampling of regional climate model output for the simulation of extreme river flows. J Hydrol 332: 487-496.
- Kahsay KD, Pingale SM, Hatiye SD (2018) Impact of climate change on ground water recharge and base flow in the sub-catchment of Tekeze basin, Ethiopia. Ground water for sustainable development 6: 121-133.
- Ho CK, Stephenson DB, Collins M, Ferro CAT, Brown SJ, et al. (2012) Calibration strategies: a source of additional uncertainty in climate change projections. Bull Am Meteorol Soc 93: 21-26.
- Bergstrom S (1976) Development and application of a conceptual runoff model for Scandinavian catchments. SMHI Norrkoping Report RH07.
- Lindstrom G, Johansson B, Persson M, Gardelin M, Bergstrom S, at al. (1997) Development and test of the distributed HBV-96 hydrological model. J. Hydrol 201: 272-288.
- Seibert J, McDonnell JJ, Woodsmith RD (2010) Effects of wildfire on catchment runoff response: a modelling approach to detect changes in snow-dominated forested catchments. Hydrol Res 41: 378-390.
- Wale A, Rientjes T, Gieske A, Getachew H (2009) Ungauged catchment contributions to Lake Tana's water balance. Hydrol Process 23: 3682-3693.
- Worqlul AW, Collick AS, Tilahun SA, Langan S, Reintjes THM, et al. (2015) Comparing TRMM 3B42, CFSR and Ground-Based Rainfall Estimates as Input for hydrological models, in data scarce regions: the upper Blue Nile Basin Ethiopia. Hydrol Earth Syst Sci 12: 2081-2112.
- Buytaert W, Celleri R (2006) Spatial and temporal rainfall variability in mountainous areas: A case study from the south Ecuadorian Andes. J. Hydrol 329: 413-421.
- Allen RG, Pereria LS, Raes D, Smith M (1998) Crop evapotranspiration: Guidelines for computing crop water requirements. FAO, Rome.
- Hargreaves GH, Samani ZA (1982) Estimating potential evapotranspiration. J Irri Drainage Div 108: 225-230.
- Booij MJ (2005) Impact of climate change over river flooding assessed with different spatial model resolutions. J Hydrol 303: 176-198.
- Nash JE, Sutcliffe JV (1970) River flow forecasting through conceptual models Part I—a discussion of principles. J Hydrol 10: 282-290.
- Basheer AK, Lu H, Omer A, Ali AB, Abdelgader AMS, et al. (2016) Impacts of climate change under CMIP5 RCP scenarios on the streamflow in the Dinder River and ecosystem habitats in Dinder National Park, Sudan. Hydrol Earth Syst Sci 20: 1331-1353.
- Wu X, Liang XZ, Zhang GJ (2003) Seasonal migration of ITCZ precipitation across the equator: Why can’t GCMs simulate it? Geophys. Res Lett 30: 1824-1827.
- Belay TK, Rötter RP, Hengsdijk H, Asseng S, Van Ittersum MK, et al. (2012) Climate variability and change in the Central Rift Valley of Ethiopia: challenges for rain fed crop production. J Agri Sci 152: 58-74.
- Monireh F, Karim CA, Saeid AV, Mohammad RF, Alexander JBZ, et al. (2013) Modeling impact of climate change on fresh water availability in Africa. J Hydrol 480: 85-101.
- Riahi K, Rao S, Krey V, Cho C, Chirkov V, et al. (2011) RCP 8.5- A scenario of comparatively high greenhouse gas emissions. Climatic Change 109:33.
- Conway D (2000) Some aspects of climate variability in the north-east ethiopian highlands-wollo and tigray. SINET: Ethiopian Journal of Science 23: 139-161.
- Boberg F, Christensen JH (2012) Overestimation of mediterranean summer temperature projections due to model deficiencies. Nature Climate Change 2: 433-436.
- Philip W, Ralph L (2009) Downscaled climate change data from the HADCM3 and ECHAM5 models on precipitation and temperature for Ethiopia and Kenya. Institute for Environmental Studies, Vrije Universiteit, The Netherlands.
- Rosell S (2011) Regional perspective on rainfall change and variability in the central highlands of Ethiopia, 1978–2007. Applied Geography 31: 329-338.
- Demissie TA, Saathoff F, Seleshi Y, Gebissa A (2013) Climate change impact on the streamflow and simulated sediment flux to Gilgel Gibe 1 hydropower Reservoir-Ethiopia. European International J Sci Tech 2.
- Christensen NS, Wood AW, Voisin N, Lettenmaier DP, Palmer RN (2004) The effects of climate change on the hydrology and water resources of the Colorado River basin. Clim Change 62: 337-363.
- NMSA (2015) National meteorological service agency. Addis Ababa, Ethiopia.
- Schaefli B, Hingray B, Musy A (2007) Climate change and hydropower production in the Swiss Alps: quantification of potential impacts and related modeling uncertainties. Hydrol Earth Syst Sci 11: 1191-1205.
Citation: Abrahama T, Woldemicheala A, Muluneha A, Abateb B (2018) Hydrological Responses of Climate Change on Lake Ziway Catchment, Central Rift Valley of Ethiopia. J Earth Sci Clim Change 9: 474. DOI: 10.4172/2157-7617.1000474
Copyright: © 2018 Abrahama T, et al. This is an open-access article distributed under the terms of the Creative Commons Attribution License, which permits unrestricted use, distribution, and reproduction in any medium, provided the original author and source are credited.
Select your language of interest to view the total content in your interested language
Share This Article
Recommended Journals
Open Access Journals
Article Tools
Article Usage
- Total views: 10481
- [From(publication date): 0-2018 - Oct 06, 2025]
- Breakdown by view type
- HTML page views: 9017
- PDF downloads: 1464