Kinetics of Phosphorus Release in Soils with Different Textures in Intensive Cultivation Systems
Received: 21-Nov-2017 / Accepted Date: 24-Jan-2018 / Published Date: 30-Jan-2018 DOI: 10.4172/2157-7617.1000441
Abstract
In this study, the effect of loam and Sandy loam textures on Phosphorus (P) release was investigated in greenhouse intensive cultivation soils of Kurdistan, Western Iran. Results showed that the kinetic of P release was higher in soils with sandy loam texture than loam texture soils. It probably was due to low positive charge points and adsorption capacity of sandy loam soils in compare with loam soils. So, more attentions must be conducted in sandy loam textures in cultivation systems because of environmental problems. As well as, according to our results other soil properties like organic matter (OM) and Cation exchange capacity (CEC) showed high correlation in respect to P release.
Keywords: Intensive cultivation; Kinetics; Phosphorus; Texture
Introduction
The importance of phosphorus (P) level in soil resources in order to adequate yield has long been recognized. On the other hand, application of P fertilizers to cultivation systems has become a routine part of agriculture [1]. High rate and long-term application of P in to the soils can lead to P accumulation more than that required for optimum plant growth, so increasing the potential for P loss to groundwater resource and change water quality [2]. Application of P fertilizers and P accumulation in intensive greenhouse cultivation systems are more than non-intensive systems [3]. indicated that P accumulation was 5 times more in greenhouse soils than agricultural soils due to long-term repeated application of fertilizers. Residual P can be an important pool in soils that has an important role to plant P supply [4-7].
For optimum nutrition of crop, the replenishment of a P-depleted soil solution is affected by the release of P from clay minerals, OM, and Fe and Al hydroxides. In Iran there are problems about P accumulation in excessive levels in greenhouse soils because of intensity of greenhouse cultivation and high annual rates of fertilizer application [4]. In Kurdistan, application of P fertilizer various with crop type. The large amount and inadequate management of P fertilization in some cultivation systems are mainly responsible for P accumulation in surface soils [5]. While more research has been done on kinetics of P release by different researchers [8], limited information on the influence of soil texture on the kinetics of P release in greenhouse soils is available. So, the aim of this study was determine the P-release kinetics from greenhouse soils by different textures.
Material and Methods
Soil sampling and analysis
Studied area was a greenhouse town in Kurdistan province (latitude 36°00' N and longitude 47°00'E) Western Iran, with an area less than the 700 m2. The management approach in greenhouses of studied area is based on the use of manure and chemical fertilizers in different amounts. The usual style of irrigation
In greenhouses is drip irrigation. The main vegetables in studied greenhouses are cucumber (Cucumis sativus) and tomato (Solanum lycopersicum). Soil samples were collected in August 2016. Eight soil samples were collected from different greenhouses. All samples were collected from surface soils (0-20 cm). Sampling in each site was done using stainless-steel auger. Each soil sample was mixture of five subsamples, was collected in polyethylene bags and was pre-treatment by being air-dried at room temperature (25 ± 1°C), ground and sieved through 2 mm for physiochemical analysis.
Soil properties were determined according to standard methods [6]. Soil pH was measured using 1:5 soil to water ratio suspension with a glass electrode pH meter (model inolab pH 7110). Soil electrical conductivity (EC) was measured using a glass electrode (model 712 conductometer) after mixing the soil with water (1:5,w/v). Organic matter was determined according to the walky-black method, which is based on the oxidation of organic matter with K2Cr2O7 and H2SO4 and titration with FeSO4. Cation exchange capacity (CEC) was measured by saturation the soil with 1 mol l-1 sodium acetate solution (pH 8.2), washing soil soluble sodium (Na+) with 96% ethanol and extracting exchangeable Na+ with 1 mol l-1 of neutral ammonium acetate. Calcium carbonate (CaCO3) was determined after boiling of 2.5 g soil with 25 ml of 0.5 N HCl and titration with 0.25 N NaOH. Soil available P (Olsen-P) is the official factor for assessing soil plant available. Briefly, 1 g of aired-dried soil sample and 20 ml of NaHCO3 (0.5 mol l-1, pH 8.5) were placed into a 50 ml extraction bottle; and the bottles were shaken mechanically for 30 min at room temperature. The suspension was filtered through a free filter paper. The P concentrations in the filtrates were measured by the colorimetric method using ascorbic acid (murphy and riley, 1994) at 820 nm by spectrophotometer (model Cary 100). In order to determined soil total P, 1 g soil was heated in 550°C in Furnace for 1 h and Boiling with 25 ml 1 N HCl in bathroom for 1 h. After cooling, solutions were brought to the mark in 100 cc flasks. Phosphorus content was measured by spectrophotometer. Particle-size distribution was determined by the hydrometer method.
Kinetics of phosphorus release
Duplicate samples of 1 g of soil were suspended in 20 mL of 0.01 M CaCl2 media and equilibrated at 25°C from 0.5 to 88 h (0.5, 1, 4, and between 4 and 88 h every 12 h). The suspensions were shaken for 1 h and left for the equilibrating time and then shaken for another 1 h before the suspensions were centrifuged for 10 min and measurements made on the solution. The soil shaking was repeated, and each time fresh solution was added and contact process repeated. Phosphorus in the extract was determined. In addition to the measurement of P concentration in the extract, pH, EC and Ca were measured. The release of P with time was fitted using the following equations:
Parabolic diffusion model qt=A + R t1/2; (1)
Power function equation ln qt=ln a + b ln t; (2)
Elovich equation qt=α + ß ln t; (3)
First order equation ln (q0 – qt)=B – k t; (4)
Where qt is the cumulative P released at time t, A, ln a, a, and B are initial P released; R, b, and b are P-release rate constants; q0 is the maximum P released; and k the first-order rate constant. These mathematical models were tested by coefficient of determination (r2).
Data analysis was conducted using the SAS (Version 9.3) statically software package (SAS Institute, 2011) and Microsoft Excel 2013.
Results and Discussion
Soils
Selected chemical properties of the soil studied are given in Table 1. The soils were neutral generally in both soil textures and high in EC and OM. Higher OM values were observed in soils with loam texture. The equivalent Ca carbonate contents varied from 10.50% to 18.40% in sandy loam soils and 10.95% to 17.52% in soils with loam texture. There was not significant higher difference between Ca carbonate contents in soils with different textures. For CEC, significant difference was observed between different soil textures. Loam soil samples had more CEC than sandy loam soil samples. The average of CaCl2-P was 74.49 and 62.34 mg kg-1 in sandy loam and loam soil samples respectively. Olsen-P in different soil samples are different (Table 1).
| Soil texture | Number of soil sampled | pH (H2O) | EC (dS m-1) | OM (%) | CEC (cmolc kg-1) | CaCO3 (%) | Olsen-P (mg/kg) | CaCl2-P (mg/kg) | Total-P (mg/kg) | FeO (mg/kg) | Clay (%) | Sand (%) | Silt (%) | |
|---|---|---|---|---|---|---|---|---|---|---|---|---|---|---|
| Sandy | 1 | 7.13 | 1.5 | 2.42 | 25.61 | 10.5 | 213 | 69.7 | 1920.52 | 168.52 | 28 | 50 | 22 | |
| Loam | 2 | 7.63 | 1.54 | 2 | 24.18 | 18.4 | 246.31 | 80.52 | 2050.62 | 184.23 | 21 | 64 | 15 | |
| 3 | 7.03 | 1.76 | 2.22 | 25.13 | 15.5 | 225.52 | 72.81 | 2450.31 | 162.13 | 25 | 55 | 20 | ||
| 4 | 7.66 | 1.82 | 2.32 | 25.66 | 17.62 | 231.42 | 74.93 | 1920.35 | 155.92 | 29 | 50 | 21 | ||
| Mean | - | 7.36 a | 1.65 a | 2.24 b | 25.14 b | 15.50 a | 228.97 a | 74.49 a | 2085.28 a | 167.70 b | - | - | - | |
| Std** | - | 0.32 | 0.15 | 0.17 | 0.68 | 3.55 | 13.69 | 4.55 | 250.79 | 12.16 | - | - | - | |
| Loam | 1 | 7.51 | 1.82 | 3.07 | 30.11 | 17.52 | 193.7 | 63.11 | 2320.11 | 343.21 | 21 | 42 | 37 | |
| 2 | 7.19 | 1.15 | 3.81 | 36.2 | 16.51 | 156.2 | 53.12 | 1980.53 | 339.41 | 22 | 44 | 34 | ||
| 3 | 7.32 | 1.68 | 3.52 | 32.21 | 15.12 | 171.1 | 60.8 | 1900.55 | 375 | 21 | 42 | 37 | ||
| 4 | 7.02 | 1.69 | 2.91 | 29.13 | 10.95 | 210.52 | 72.33 | 2120.69 | 320.25 | 22 | 36 | 42 | ||
| Mean Std** | - | 7.26 a | 1.58 a | 3.32 a | 31.91 a | 15.02 a | 182.88 b | 62.34 b | 2080.47 a | 344.46 a | - | - | - | |
| - | 0.2 | 0.29 | 0.41 | 3.13 | 2.88 | 24.02 | 7.91 | 183.85 | 22.7 | - | - | - | ||
Table 1: Some chemical properties of studied soils with different textures.
Great average olsen-P in soils occurred in sandy loam texture (228.97 mg kg-1). Olsen and total P in this studied soil samples are higher than other studies in other different countries (Table 2).
| Researcher(s) | Country | Average Olsen-P (mg/kg) | Average total P (mg/kg) |
|---|---|---|---|
| Chen et al. in 2013 | China | 120 | 555.3 |
| Yan et al. in 2015 | China | 85 | 390.2 |
| Wong et al. in 2012 | Japan | 92 | 455.1 |
| Kong et al. in 2014 | Turkey | 110 | 460.5 |
| Sungur et al. in 2016 | Spain | 135 | 619.2 |
Table 2: Comparison of Olsen and total P in greenhouse soils of some countries.
It shows the Olsen and total P concentrations in some another countries. Compare with their results, high application of phosphorus fertilizers in agricultural lands especially in intensive crop systems in Iran, results to P accumulation in soils. The amount of manure and chemical fertilizers applied in greenhouses is unknown and change as a function of crop type [7]. Therefore, it indicates that intensive agricultural practices may cause enrichment of P in surface soils and fertilizer-use efficiency is low, although the application rates of P fertilizer were made according to the soil and water research institute recommendations [7].
Kinetics of P release
Phosphorus release by 0.01 M CaCl2 is shown in Figure 1. The release was initially rapid followed by a slower reaction. The two phases of P release are characteristic of a diffusion-controlled process that has been observed for other ions such as k+ [9]. The observed pattern of initial rapid release followed by slower release has also been reported by the two phases of P release can be due to the heterogeneity of the adsorption sites with different adsorption affinities [10-13]. The initial fast release has been mainly attributed to rapid dissolution of poorly crystalline or amorphous phosphates in the soils, which were metastable and ultimately converted to crystalline forms such as octa- Ca-phosphate and Ca-hydroxyl-apatite [11]. The fast phase and the slower second phase may be related to the desorption of surface labile P and slow dissolution of the crystalline phosphate compounds in the soils [10]. They stated that the initial rapid release can be attributed to the labile P while the latter stage may be rated as less mobile [12]. Cumulative P released study ranged from 10 to 85 mg kg-1 and was related to the soil texture. The maximum amount of P was released in soil with sandy loam texture (Figure 1). The minimum P was released in the soils with loam textures. In all soil types, the amount of P released was lower than the olsen-P, and on average olsen-P removed 3 times more P than cumulative P released by 0.01 M CaCl2. Different kinetic models were used to describe P release from the soils. The ability of kinetic models to describe P release has been studied by several researchers [2-9] A linear fit to the parabolic diffusion model (r2=0.95- 0.98) indicates that release of P is a diffusion-controlled process [3]. The parameter R ranges from 4.97 to 7.69 mg kg–1 h–1/2 (Table 3). Successful presentations of a parabolic diffusion [14].
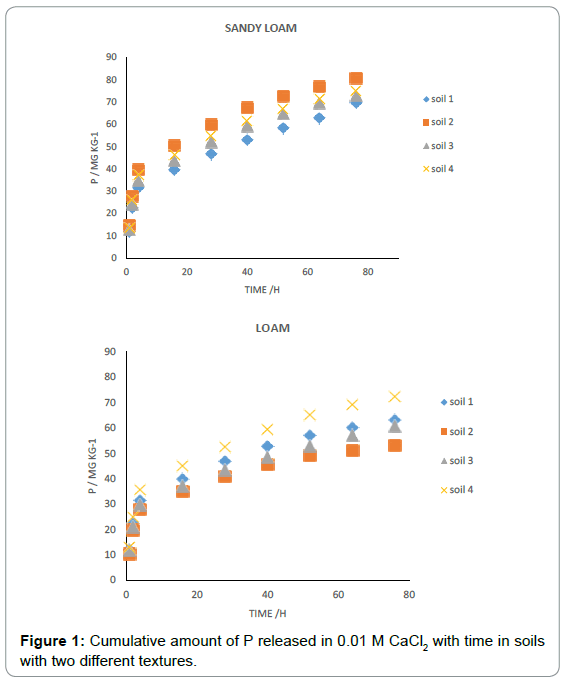
Figure 1: Cumulative amount of P released in 0.01 M CaCl2 with time in soils with two different textures.
| Soil texture | Number of soil samples |
Parabolic equation | Power function equation | Elovich equation | First order equation | ||||||||
|---|---|---|---|---|---|---|---|---|---|---|---|---|---|
| A mg/kg.h | R mg/kg | r2 | a mg/kg.h | b mg/kg |
r2 | α mg/kg.h | ß mg/kg | r2 | B mg/kg.h | k mg/kg | r2 | ||
| Sandy | 1 | 16.1 | 7.01 | 0.95 | 18.35 | 0.33 | 0.93 | 15.64 | 12.85 | 0.97 | 3.99 | 0.04 | 0.97 |
| 2 | 16.82 | 7.69 | 0.95 | 19.29 | 0.33 | 0.93 | 16.21 | 14.13 | 0.98 | 4.08 | 0.4 | 0.98 | |
| 3 | 13.72 | 7.03 | 0.96 | 16.6 | 0.34 | 0.94 | 13.45 | 12.81 | 0.97 | 4.01 | 0.03 | 0.97 | |
| 4 | 15.2 | 7.01 | 0.96 | 17.63 | 0.33 | 0.93 | 14.83 | 12.82 | 0.97 | 4 | 0.3 | 0.97 | |
| Loam | 1 | 13.76 | 5.94 | 0.95 | 15.64 | 0.33 | 0.94 | 13.3 | 10.92 | 0.98 | 3.82 | 0.04 | 0.98 |
| 2 | 12.68 | 4.97 | 0.98 | 13.73 | 0.32 | 0.92 | 12.06 | 9.21 | 0.98 | 3.63 | 0.04 | 0.98 | |
| 3 | 12.87 | 5.61 | 0.96 | 15.02 | 0.32 | 0.94 | 12.65 | 10.23 | 0.97 | 3.78 | 0.03 | 0.97 | |
| 4 | 14.82 | 6.9 | 0.95 | 17.11 | 0.34 | 0.93 | 14.37 | 12.64 | 0.97 | 3.99 | 0.04 | 0.97 | |
Table 3: Parameters of kinetics equation used to describe release kinetics of P in 0.01 M CaCl2 in studied soils.
Equation for P release from soils was earlier reported by also, the cumulative P was fitted to the first order (r2=0.97-0.98) and Elovich models (r2=0.97-0.98). Successful description of P release by the firstorder and Elovich models was previously reported. According to our data, Elovich and first order equations show more r2 than another fitted equations. The Pearson correlation matrix was computed (Table 4).
| Parameters | pH | EC | OM | CEC | CaCO3 | Olsen-P | CaCl2-P | Silt | Sand | Clay | a | b | A |
|---|---|---|---|---|---|---|---|---|---|---|---|---|---|
| pH | 1 | - | - | - | - | - | - | - | - | - | - | - | - |
| EC | 0.54* | 1 | - | - | - | - | - | - | - | - | - | - | - |
| OM | -0.13 | 0.15 | 1 | - | - | - | - | - | - | - | - | ||
| CEC | 2.52 | 0.17 | 0.25* | 1 | - | - | - | - | - | - | - | - | - |
| CaCO3 | 0.52* | 0.36* | 0.23 | 0.26* | 1 | - | - | - | - | - | - | - | - |
| Olsen-P | 0.05 | 0.41* | -0.11 | 0.16 | -0.23 | 1 | - | - | - | - | - | - | - |
| CaCl2-P | 0.12 | 0.26 | -0.06 | 0.12 | -0.14 | 0.82* | 1 | - | - | - | - | - | - |
| Silt | 0.43* | -0.23 | 0.13 | 0.23* | 0.42* | -0.1 | -0.36 | 1 | - | - | - | - | |
| Sand | -0.06 | -0.05 | -0.08 | -0.05 | -0.42 | 0.2 | 0.26* | -0.14 | 1 | - | - | ||
| Clay | 0.25 | 0.33* | -0.23 | 0.52 | 0.65* | -0.12 | -0.11 | -0.05 | -0.12 | 1 | - | ||
| a | 0.08 | 0.26 | -0.01 | -0.11 | -0.26 | 0.23 | 0.45 | -0.11 | 0.23* | -0.12 | 1 | - | - |
| b | 0.15 | -0.12 | 0.23 | 0.1 | 0.22 | -0.54 | -0.11 | 0.26* | -0.15 | 0.36* | -0.03 | 1 | -- |
| A | 0.2 | 0.42 | -0.14 | 0.18 | -0.23 | 0.52* | 0.39 | -0.25 | 0.19 | -0.05 | -0.22 | -0.1 | 1 |
| R | 0.11 | 0.11 | -0.1 | 0.28* | -0.14 | 0.58* | -0.06 | -0.36 | -0.11 | -0.13 | 0.62 | -0.02 | 0.22* |
EC: Electrical Conductivity; OM: Organic Matter; CEC: Cation Exchange Capacity; a, A: Initial P Released; b, R: Release Rate Constants.
Table 4: Pearson correlation coefficients for the soil different parameters.
Criterion value of probabilities (p< 0.05) was used to test correlation significance [15]. A strong positive correlation between CaCl2- P released and Olsen-P (r=0.82) was observed. Previous research has shown that P-release kinetics varies with the composition of the soil showed that P-release rate in acid soils is controlled by Al, Fe, and clay contents, whereas in calcareous soils by CaCO3 and clay contents [16,17].
Conclusion
The effect of soil texture on P release was investigated. The release of P among soils differed between soil textures. Continuation of conventional crop management practices will likely further increase soil P, leading to greater potential release of P. In general, parabolic first order and Elovich equations were found to be appropriate for modeling cumulative P release. Between soil parameters, OM, CEC were most correlated with soil texture. These parameters are known to influence P release from soils and can be used in modeling the release kinetics of P from these calcareous soils.
Acknowledgment
The author grateful to Mr. M.R Panahi for preparing soil samples and Laboratory equipment at Bu-Ali Sina University and Dr. Z. Ahmadi for statistical analysis.
References
- Allison JD, Brown DS, Novo-Gradac KJ (1991) MINTEQA2/ PRODEFA2, A geochemical assessment model for environmental systems: Version 3.0 User’s Manual. US Environmental Protection Agency, Athens, GA, USA.
- Madrid L, De Arambarri P (1985) Adsorption of phosphate by two iron oxides in relation to their porosity. Eur J Soil Sci 36: 523–530.
- Kong X, Cao J, Tang R, Zhang S, Dong F (2014) Pollution of intensively managed greenhouse soils by nutrients and heavy metals in the Yellow River Irrigation Region, Northwest China. Environ Monit Assess 186: 7719-7731.
- Martin JA, Miras JJ, Boluda R, Gil C (2013) Spatial relations of heavy metals in arable and greenhouse soils of a Mediterranean environment region Spain. Geoderma 200: 180-188.
- Shariatmadari H, Shirvani M, Jafari A (2006) Phosphorus release kinetics and availability in calcareous soils of selected arid and semiarid toposequences. Geoderma 132: 261-272.
- Jalali M (2007) Phosphorous status and sorption characteristics of some calcareous soils of Hamedan, western Iran. Environ Geol 53: 365-374.
- Mc Dowell RW, Sharpley AN (2003) Phosphorus solubility and release kinetics as a function of soil test P concentration. Geoderma 112: 143-154.
- Rowell DL (1994) Soil Science: Methods and Applications. Longman Scientific & Technical, Harlow, Essex, England, UK.
- Sungur A, Soylak M, Özcan H (2016) Chemical fractionation, mobility and environmental impacts of heavy metals in greenhouse soils from Canakkale, Turkey. Environ Earth Sci 75: 334.
- Jardine PM, Sparks DL (1984) Potassium-calcium exchange in a multireactive soil system: 1. Kinetics1. Soil Sci Soc Am J 47: 39-45.
- Nafiu A (2009) Effects of soil properties on the kinetics of desorption of phosphate from Alfisols by anion-exchange resins. J Plant Nutr Soil Sci 172: 101-107.
- Steffens D (1994) Phosphorus release kinetics and extractable phosphorus after long term fertilization. Soil Sci Soc Am J 58: 1702-1708.
- Griffin R A, Jurinak JJ (1974) Kinetics of phosphate interaction with calcite1. Soil Sci Soc Am Proc 38: 75-79.
- Horta MD, Torrent J (2007) Phosphorus desorption kinetics in relation to phosphorus forms and sorption properties of Portuguese acid soils. Soil Sci 172: 631-638.
- Murphy J, Riley JP (1962) A modified single solution method for determination of phosphate in natural waters. Anal Chim Acta 27: 31-36.
- Olsen SL, Sommers LE (1982) Phosphorus. In: Page AL (eds) Methods of Soil Analysis, Part II. (2nd edn), Agron. Monogr. No.9, ASA and SSSA, Madison WI, USA. pp. 403-427.
- Toor GS, Bahl GS (1999) Kinetics of phosphate desorption from different soils as influenced by application of poultry manure and fertilizer phosphorus and its uptake by soybean. Biores Technol 69: 117-121.
Citation: Ahmadi F (2018) Kinetics of Phosphorus Release in Soils with Different Textures in Intensive Cultivation Systems. J Earth Sci Clim Change 9: 441. DOI: 10.4172/2157-7617.1000441
Copyright: © 2018 Ahmadi F. This is an open-access article distributed under the terms of the Creative Commons Attribution License, which permits unrestricted use, distribution, and reproduction in any medium, provided the original author and source are credited.
Select your language of interest to view the total content in your interested language
Share This Article
Recommended Journals
Open Access Journals
Article Tools
Article Usage
- Total views: 5349
- [From(publication date): 0-2018 - Nov 29, 2025]
- Breakdown by view type
- HTML page views: 4344
- PDF downloads: 1005