Research Article Open Access
Leukotriene D4 Requires PKC α- Akt Signaling Pathway to Inhibit Na+- Dependent Alanine Cotransporter (ASCT1) in Enterocytes
Jamilur R. Talukder1*, Jaleesa Wright1, Antara Jaima2 and Deja McIntosh1
1Department of Biology, LeMoyne-Owen College, 807 Walker Avenue, Memphis, TN 38126, USA
2Boston University, One Silber Way, Boston, MA 02215, USA
- *Corresponding Author:
- Jamilur R. Talukder
Department of Biology
LeMoyne-Owen College
807 Walker Avenue, Memphis
TN 38126, USA
Tel: +1-(901) 435-1396
Fax: +1-(901) 435-1424
E-mail: Jamil_Talukder@loc.edu
Received date: December 06, 2015Accepted date: December 19, 2015, Published date: December 26, 2015
Citation: Talukder JR, Wright J, Jaima A, McIntosh D (2015) Leukotriene D4 Requires PKCα- Akt Signaling Pathway to Inhibit Na+-Dependent Alanine Cotransporter (ASCT1) in Enterocytes. J Gastrointest Dig Syst 5:364. doi:10.4172/2161-069X.1000364
Copyright: © 2015 Talukder JR, et al. This is an open-access article distributed under the terms of the Creative Commons Attribution License, which permits unrestricted use, distribution, and reproduction in any medium, provided the original author and source are credited.
Visit for more related articles at Journal of Gastrointestinal & Digestive System
Abstract
Background: Varieties of inflammatory cytokines are produced during chronic enteritis including inflammatory bowel disease (IBD), that leads to malabsorption of nutrients and diarrhea. The inflammatory mediators are produced from different tissues of the body. Arachidonic acid metabolite derived via Lipoxygenase pathway, leukotriene D4 (LT) inhibits Na+-dependent alanine (Ala) cotransport (ASCT1, solute carrier, slc1a4) in the apical membrane of enterocytes by decreasing the affinity of cotransporter. However, the intracellular mechanism of LT-mediated inhibition of ASCT1 activity is unknown.
Objective:To investigate the intracellular mechanism of leukotriene D4 (LT) mediated inhibition of ASCT1 activity in enterocytes.
Methods: Rat intestinal epithelial cells (IEC-6) were grown on transwell plates. [3H]-Ala uptake was measured in 10 days postconfluent cells using a scintillation counter. IEC-6 cells were treated with different inhibitors in 8 days postconfluent to intercept different checkpoints of pathways for LT-mediated inhibition of ASCT1 activity. Intracellular Ca2+ and cAMP levels were measured. Immunoblotting, qRT-PCR, and immunocytochemistry were performed following the standard protocols.
Results: LT treatment increased more than 2.5-fold [(cAMP)i] and [(Ca2+ )i]. PKA, PKC-δ and -θ inhibitor did not reverse the LT-mediated inhibition of ASCT1 activity. However, PKC-α inhibitor antagonized LT effect on ASCT1 activity. Further downstream of PKC-α pathway, tyrosine kinase (Akt) inhibitor also reversed LT-mediated inhibition of ASCT1 activity. Immunoblotting, qRT-PCR, immunocytochemistry, and Kinetics studies demonstrated that the mechanism of decreased affinity of ASCT1 by LT was due to decrease in affinity of ASCT1 for Ala transport that was restored by Akt inhibitor.
Conclusion: Therefore, we conclude that LT inhibits ASCT1 activity by decreasing the affinity of ASCT1 to Ala through Ca2+-dependent PKCα-Akt pathway in enterocytes.
Keywords
Na+-Amino Acid Cotransport; Protein kinase C; Akt; Chronic intestinal inflammation
Abbreviations
TMACl: Tetramethylammonium chloride; TMAOH: Tetramethylammonium hydroxide; RMBC: Adenosine 3′,5′-cyclic Monophosphorothioate, 2′-O-Monobutyryl-, Rp-Isomer; BAPTA: 1,2-bis(o-Aminophenoxy) ethane-N,N,N′,N′-tetraacetic Acid Tetra (acetoxymethyl) Ester; Cal C: Calphostin; Akt: ); THSS: I and 1,2,3,4-Tetrahydrostaurosporine
Introduction
Absorption of nutrients in the intestine is altered due to different factors in health and disease. In pathological conditions, malabsorption of nutrients leads to diarrhea due to acute or chronic intestinal inflammation. Only a single layer of epithelial cells separates the luminal contents from effector immune cells in the lamina propria and the internal milieu of the body. Alterations in this single layer of epithelium can lead to pathological exposure of the highly immunoreactive sub-epithelium to the vast number of microbes and antigens in the lumen. In addition, a wide variety of immune-inflammatory mediators are known to be endogenously produced during chronic intestinal inflammation, which have an effect either individually or synergistically on electrolyte and nutrient transport pathways [1,2,3]. Intestinal epithelial cells (IEC) play an active role in chronic intestinal inflammation by releasing multiple cytokines and inflammatory mediators [4]. The constellation of intestinal epithelial cell derived inflammatory molecules includes interleukins, chemokines, prostaglandins, and nitrogen radicals [5].
Amino acids are one of the important nutrients, essential for the body as well as enterocytes, and assimilated through the different amino acid transporters especially Na+-dependent amino acid transporters. Na+-dependent amino acid transporter, Na+-Ala cotransport (e.g. ASCT1, slc1a4) is present on the brush-border membrane (BBM) of the absorptive villus but not the secretory crypt cells [6]. Furthermore, Na+-Ala cotransport is inhibited in villus cells from chronically inflamed rabbit small intestine [6]. It is not clearly known, how arachidonic acid metabolite derived via Lipoxygenase pathway, leukotriene D4 (LT) inhibits ASCT1 in enterocytes. It is generally agreed that the leukotriene-induced events occurring during an inflammatory response are mediated via the interaction of leukotrienes with specific plasma membrane receptors [7]. Recently, we observed that Na+-amino acid cotransporter, ASCT1, is inhibited by LT in IEC-18 cells [8]. Understanding the mechanisms involved in the down-regulation of ASCT1 activity for Ala absorption is critical during chronic intestinal inflammation such as inflammatory bowel diseases where nutrient cotransporter functions are compromised and lead to nutrient malabsorption and at present, the intracellular mechanism of inhibition of ASCT1 by LT is not known. Therefore, we studied the
Materials and Methods
Chemicals
Vendor prepared solutions of Trypsin/EDTA, Dulbecco's Modified Eagle Media (DMEM), fetal bovine serum (FBS), and Dulbecco’s phosphate buffered saline (DPBS) Leibovitz’s L-15 medium powder (L-15), Fluo-3AM were from Invitrogen (Grand Island, NY. Leukotriene D4 (LT) was purchased from Cayman Chemical (Ann Arbor, MI., USA), Tetramethylammonium chloride (TMACl), Tetramethylammonium hydroxide (TMAOH), HEPES buffer, L-Ala including other amino acids used as substrate, and β-hydroxy butyric acid from Sigma Chemical (St. Louis, MO, USA), insulin from Novo Nordisk (Plainsboro, NJ, USA). [3H]-L-alanine ([3H]-Ala) was purchased from Perkins Elmer and cAMP EIA kit from Assay Designs (Ann Arbor, MI, USA). Adenosine 3’,5’-cyclic monophosphate, 8-bromo sodium salt (cAMP agonist), Adenosine 3′,5′-cyclic Monophosphorothioate, 2′-O-Monobutyryl-, Rp-Isomer, Sodium Salt (cAMP antagonist, RMBC), 1,2-bis(o-Aminophenoxy) ethane-N,N,N′,N′-tetraacetic Acid Tetra (acetoxymethyl) Ester (BAPTA, cytosolic Ca2+ chelator), Calphostin C (PKC inhibitor), Gö 6983, PKC-α and β, γ, δ and –zeta/ ζ; Gö 6976 (PKC-α and-β inhibitor), Rottlerin (PKC-δ and -θ inhibitor), Akt inhibitor [)] were purchased from Calbiochem (La Jolla, CA, USA) and 1,2,3,4-Tetrahydrostaurosporine (PKC-α inhibitor) from Abcam (Cambridge, MA, USA).
Cell culture
The normal, diploid, rat small intestinal epithelial cell (IEC-6) line (CRL-1592 American Type Culture Collection, Manassas, VA, USA) was used between passages 15 and 30. Density of IEC-6 cells were approximately 2x10⁶ cells/ well, were grown on six-transwell or 5x10⁶ cells/ 100 mm dish (Corning, NY, USA) in DMEM (high glucose 4.5 g/L, sodium bicarbonate 3.7 g/L) containing 2 mM L-glutamine, 10% vol/vol bovine fetal serum, and 0.01% insulin, 0.25% β-hydroxybutyric acid without any antibiotics in a humidified atmosphere of 10% CO2 at 37°C. The medium was changed every 2-3 days, cells were treated on the eighth day and experiments were carried out on the tenth day of postconfluence.
Alanine transport
Alanine influx studies were performed in 6-well transwell plates using triplicate wells for each time point. Each experiment was performed at 10 days postconfluence. Cells were rinsed once with oxygenated Leibovitz’s (L-15, 100% oxygen) media (pH 7.4, pH was adjusted with TMAOH) supplemented with 10% bovine fetal serum, 20 mM HEPES, and incubated at room temperature for 1 h. Cells were washed once with TMAHEPES buffer (4.7 mM KCl, 1 mM MgSO4, 1.2 mM KH2PO4, 20 mM HEPES, 125 mM CaCl2, 130 mM TMACl, pH 7.4, pH was adjusted with TMAOH) and incubated with TMAHEPES (Na+-free) buffer for 10 minutes in room temperature. Cells were incubated with reaction mixture containing 200 μM of cold (does not contain isotope) and [3H]-L-Ala, in TMAHEPES buffer (Na+-free), and with 130 mM NaCl (Na+-HEPES) for a specified time. The reaction was stopped and washed twice with ice-cold TMAHEPES (Na+-free) buffer. NaOH (800 μl, 1 M) was added on membrane in each transwell and incubated for 30 min at 70 °C to digest the cells. Cell extracts were transferred into a scintillation vial and 5 ml of scintillation fluid (Ecoscint A) was added. The vial was kept in the dark for 48 h and counted for measuring [3H]-L-Ala in a (Beckman Coulter TM, LS 6500, USA) scintillation counter.
Specificity of Alanine, Serine, Cysteine Transporter (ASCT)
Since, there are few Na+-Ala cotransporters with a variety of substrate specificities, we performed substrate specificity and siRNA transfection studies. For substrate specificities, 5 mM of cold Ala, Ser, Cys, Glu, Trp, Gln, His, and Asp were used in separate reaction medium except in control for uptake studies along with [3H]-L-Ala for 4 minutes in 10 days postconfluent.
To Knockdown the mRNA of solute carrier family 1 (glutamate/neutral amino acid transporter), member 4 (slc14a, LOCUS NP_942058, UniGene ID Rn.52251, RefSeq NM_198763.1, Entrez Gene ID 305540, Location 14q22) gene responsible for ASCT1 protein was performed using Silencer® Select Pre-designed rat siRNA (ID# 191697; ThermoFisher Scientific, Waltham, MA, USA) in IEC-6 cells. Five hundred nM gene specific and scrambled siRNA (control) were transfected into IEC-6 cells by electroporation technique using Electroporation kit (Lonza, Walkersville, MD, USA). IEC-6 cells grown to 80% confluent in 75-cm2 flasks were trypsinized and resuspended in electroporation buffer and used according to the manufacturer’s instruction.
Protein determination
Total protein in cell lysates was measured by Bradford method [9], using a Bio-Rad protein assay kit (Hercules, CA, USA) where bovine serum albumin (BSA) was used as standard.
Determination of Cell Viability
IEC-6 cells grown on transparent transwell inserts, were treated with either vehicle (ethanol) or different concentrations of LT (0-2 μM) in FBS free growth medium in 8 days postconfluent. After 48 h, medium was aspirated and cells were washed twice with pre-warmed (370C) DPBS. Trypan blue exclusion technique was used to determine the viability or dead cells. The number of dead cells was determined using 0.5% Trypan blue per data point per 5 microscopic fields.
Caspase-3 Assay
A ready-to-use Caspase-3 Fluorometric Assay Kit (GenScript) was used according to manufacturer’s protocol. IEC-6 cells were grown on 6-well transwell membrane. Eight days postconfluent cells were treated with different concentrations of LT (treated group) on both sides and control group received only vehicle for 48 h. Caspase-3 activity was measured using cellular lysates as described previously[10].
Determination of intracellular cyclic adenosine monophosphate ([cAMP]i)
IEC-6 cells were cultured on 100 mm transwell dishes and treated group received LT (0.5 μM) in 8 days postconfluent for 48 h. Cells were washed twice with ice-cold DPBS and harvested following scraping the transwell membrane. [cAMP]i was determined following the non-acetylated version using EIA kit, methods described and provided by Assay Designs (Ann Arbor, MI, USA).
Measurement cytosolic free Ca2+ levels ([Ca2+]i)
Fluo-3AM was used as fluorescence indicator for ([Ca2+]i determination. The 10 days postconfluent IEC-6 cells (control and LT-treated: 0.5 μM) on transwell plates were washed twice with PBS. Fluo-3AM and pluronic acid was added in F-12 medium and incubated for 15 min at 37°C. Cells were washed twice with PBS to remove the extracellular dye and incubated in 0.1% BSA-HEPES buffer (pH 7.4) for 30 min at 25°C to allow intracellular dye hydrolysis. Plates were loaded without a lid in the fluorometer and holder of a Hitachi F-2000 automatic spectrofluorometer to measure ([Ca2+]i at different time intervals. This set-up was also equipped with a computer and thermostatic chamber which allowed the cells to be maintained at 37°C during the experiment. Fluorescence of Ca2+-bound and unbound Fluo-3AM was measured from the top of the plate (epifluorescence mode) with alternating excitation wavelengths of 485 nm and emission wavelength of 530 nm. The slit widths were set at 10 nm for the excitation and at 20 nm for emission. The system calculated the ratio of two fluorescence intensities. Each well was read 6 times automatically and 3 wells were used in each group. Fluorescence produced by unloaded Flou-3AM was subtracted from the total fluorescence data for the corrections of autofluorescence to achieve the net fluorescence.
Quantification of MRNA with Quantitative Real-Time Polymerase Chain Reaction (QRT-PCR)
A StepOne Real-Time PCR system was used according to the manufacturer’s instruction. IEC-6 cells were grown on transwell plates, treated cells received LT (0.5 μM), and Akt inhibitor (10 μM) on both compartments in FBS free DMEM medium in 8 days postconfluent for 48 h. To quantify specific ASCT1 and GAPDH mRNA, qRT-PCR were used using TaqMan® Gene Expression Cells-to-CT Assay kit using assay ID Rn00564718_m1, and RN99999916_S1, respectively (Applied Biosystems, Carlsbad, CA, USA). All experiments were performed in triplicate.
Immunoblotting
The IEC-6 cells that were grown in 100 mm transwell dishes were treated in 8 days postconfluent with LT (0.5 μM), Akt inhibitor (10 μM), and vehicle (control) for 48 h in FBS-free DMEM. Cells were washed three times with ice-cold PBS, scraped, and pelleted by centrifugation. Cellular lysates (plasma membranes) from control, LT, Akt inhibitor, and Akt inhibitor-LT treated IEC-6 cells were prepared according to the previously published protocol [8] and solubilized in RIPA buffer that contained a protease inhibitor cocktail. SDS-PAGE was performed and 75 μg of proteins were separated in precast (12%) gel (Bio-Rad; Hercules, CA, USA) and transferred onto PVDF membranes. Rabbit polyclonal ASCT1 (1:500 dilution) and goat antirabbit-HRP (1:2000 dilution) antibodies were used. Thereafter, the membrane was washed and incubated with ECL Western blotting detection reagents (GE Healthcare Bio-Sciences Corp, Piscataway, NJ, USA) and the resultant chemiluminescence was detected using X-ray films to visualize ASCT1 bands. The intensity of the bands was quantitated using a Densitometric scanner. All experiments were performed in triplicate.
Immunocytochemistry
The detail method was previously described by Talukder et al. [10,11]. Briefly, IEC-6 cells grown on glass coverslips were treated with either vehicle (control), or LT (0.5 μM), and Akt inhibitor (10 μM) for 48 h. Cells were washed with PBS and fixed with 4% paraformaldehyde. The permeabilization step was excluded, allowing primary antibody to bind with extracellular epitopes of ASCT1 protein only on plasma membrane not intracellular ASCT1 and blocked with 10% goat serum. ASCT1 primary antibody (1:200) and goat anti-rabbit IgG-CFL488 (1:500) were used. Finally, cells were treated with DAPI. Coverslips were mounted on each glass slide, examined under a computerized NIKON immunofluorescence microscope, and the fluorescence was quantitated.
Statistical Analysis
Data were analyzed by ANOVA and Student’s t-test using mean values and the associated standard errors where is needed. Statistical significance was accepted at P<0.05 or as indicated. All data are presented as mean ± standard error of the mean (SEM).
Results
Alanine (Ala) uptake in IEC-6 cells
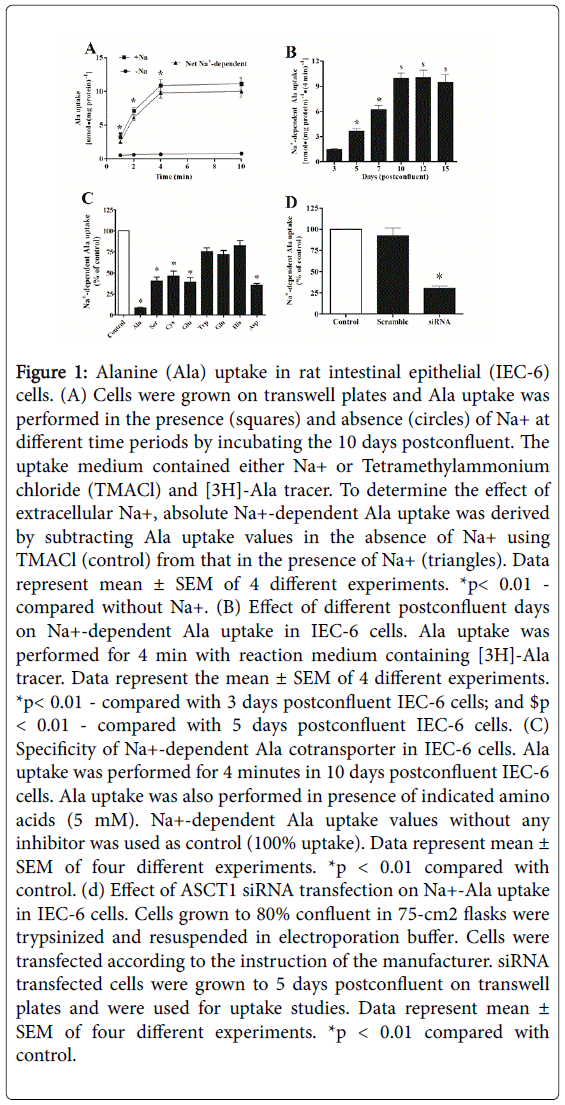
In order to examine the presence of ASCT1 activity in IEC-6 cells, we performed Ala uptake studies in these cells. In this regard, on the basis of previous studies [8,10,11,12] , we used 10 days postconfluent IEC-6 cells monolayer. Figure 1, panel A shows the activity of Ala cotransport in IEC-6 cells in the presence or absence of Na+ in different time intervals. These data show that the uptake of Ala was significantly higher in the presence of Na+ in comparison to control (-Na+). In contrast, Ala uptake in the absence of Na+ is almost identical at all the time points. In order to determine the presence of Na+-dependent Ala cotransport in IEC-6 cells, uptake values in absence of Na+ were subtracted from the values in the presence of Na+. The net Na+-dependent Ala uptake was 4 to 14-fold higher in all time points and 4 min would be optimum for maximum Ala uptake. These data show that the significant amount of Ala was transported by Na+-dependent Ala cotransporter which is consistent with our previous studies in IEC-18 cells [8]. In addition, 10th day of postconfluency of IEC-6 cells may not allow for the most optimal level of cellular differentiation because cellular differentiation is very critical for nutrient cotransporters. Therefore, further detailed postconfluent experiments were designed using different days of postconfluent for Na+-dependent Ala cotransport studies although our previous studies showed maximum uptake was in 10th days postconfluent. Figure 1, panel B shows that Na+-dependent Ala uptake was significantly increased in 5 and 7 days as compared with 3 days postconfluent. The net Na+-dependent Ala uptake was increased 2.75-fold in 10 days as compared with 5 days postconfluent and there were insignificant alterations among 10, 12, and 15 days postconfluent. It indicated that maximum cellular differentiation takes place for Na+-dependent Ala cotransport functions at 10 days postconfluence and would be the most optimal for further Ala uptake studies.
Figure 1: Alanine (Ala) uptake in rat intestinal epithelial (IEC-6) cells. (A) Cells were grown on transwell plates and Ala uptake was performed in the presence (squares) and absence (circles) of Na+ at different time periods by incubating the 10 days postconfluent. The uptake medium contained either Na+ or Tetramethylammonium chloride (TMACl) and [3H]-Ala tracer. To determine the effect of extracellular Na+, absolute Na+-dependent Ala uptake was derived by subtracting Ala uptake values in the absence of Na+ using TMACl (control) from that in the presence of Na+ (triangles). Data represent mean ± SEM of 4 different experiments. *p< 0.01 - compared without Na+. (B) Effect of different postconfluent days on Na+-dependent Ala uptake in IEC-6 cells. Ala uptake was performed for 4 min with reaction medium containing [3H]-Ala tracer. Data represent the mean ± SEM of 4 different experiments. *p< 0.01 - compared with 3 days postconfluent IEC-6 cells; and $p < 0.01 - compared with 5 days postconfluent IEC-6 cells. (C) Specificity of Na+-dependent Ala cotransporter in IEC-6 cells. Ala uptake was performed for 4 minutes in 10 days postconfluent IEC-6 cells. Ala uptake was also performed in presence of indicated amino acids (5 mM). Na+-dependent Ala uptake values without any inhibitor was used as control (100% uptake). Data represent mean ± SEM of four different experiments. *p < 0.01 compared with control. (d) Effect of ASCT1 siRNA transfection on Na+-Ala uptake in IEC-6 cells. Cells grown to 80% confluent in 75-cm2 flasks were trypsinized and resuspended in electroporation buffer. Cells were transfected according to the instruction of the manufacturer. siRNA transfected cells were grown to 5 days postconfluent on transwell plates and were used for uptake studies. Data represent mean ± SEM of four different experiments. *p < 0.01 compared with control.
Specificity of ASCT1 transporter in IEC cells
ASCTs (alanine, serine, and cysteine transporters) belong to the solute carrier family1 (SLC1). Figure 1, panel C shows that net Na+-dependent Ala uptake was inhibited by the presence of cold Ala (91%), Ser (60%), Cys (54%), Glu (60%), and Asp (65%) which indicated that the maximum amount of Ala was transported by ASCT1 not ASCT2. In addition, Na+-dependent Ala uptake was inhibited by the presence of cold Trp (25%), Gln (28%), and His (18%) which indicated that Ala was neither transported by SN2 nor B0AT1. Furthermore, ASCT1 knockdown studies (Figure 1, panel D) revealed that siRNA for ASCT1 inhibited 70% of Na+-dependent Ala uptake. These studies demonstrated that more than 70-90% of Ala was transported by ASCT1 not ASCT2 in IEC-6 cells.
Effect of LT concentration and time-course on Ala uptake
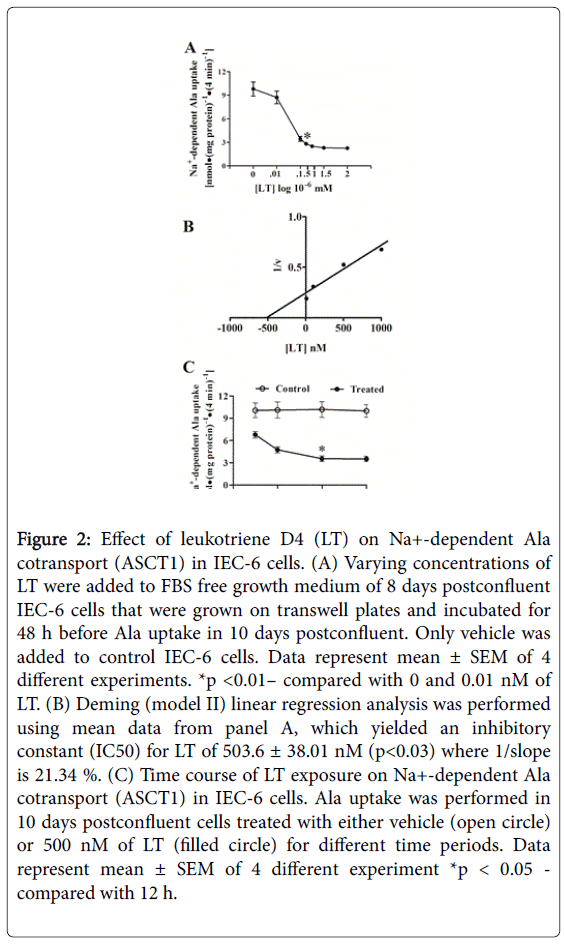
Different concentrations of LT were used to determine dose-response effects on ASCT1 activity in IEC-6 cells (Figure 2, panel A). Ten days postconfluent IEC-6 cells were used, treated at 8 days postconfluent for 48 h, and Ala uptake was performed at 4 min. Increasing LT concentrations (10-500 nM) increasingly inhibited Na+-dependent Ala uptake. These data showed that LT inhibits Na+-Ala uptake even at 10 nM and the maximum was by 1500 nM LT treatments. Na+-dependent Ala uptake was reduced 3.5-fold by 500.0 and 4.3-fold by 1500.0 nM of LT treatments as compared with control. Figure 2, panel B shows the Deming linear regression (Model II) analysis of mean data from Figure 2, panel A yielded an inhibitory constant (IC50) for LT of 503.6 ± 38.0 nM (p<0.05) where 1/slope is 21.34 %.
Figure 2: Effect of leukotriene D4 (LT) on Na+-dependent Ala cotransport (ASCT1) in IEC-6 cells. (A) Varying concentrations of LT were added to FBS free growth medium of 8 days postconfluent IEC-6 cells that were grown on transwell plates and incubated for 48 h before Ala uptake in 10 days postconfluent. Only vehicle was added to control IEC-6 cells. Data represent mean ± SEM of 4 different experiments. *p <0.01– compared with 0 and 0.01 nM of LT. (B) Deming (model II) linear regression analysis was performed using mean data from panel A, which yielded an inhibitory constant (IC50) for LT of 503.6 ± 38.01 nM (p<0.03) where 1/slope is 21.34 %. (C) Time course of LT exposure on Na+-dependent Ala cotransport (ASCT1) in IEC-6 cells. Ala uptake was performed in 10 days postconfluent cells treated with either vehicle (open circle) or 500 nM of LT (filled circle) for different time periods. Data represent mean ± SEM of 4 different experiment *p < 0.05 - compared with 12 h.
All these data indicated that LT inhibits ASCT1 in IEC-6 cells and options for the lowest dose with the most inhibition are 500.0 nM. In order to determine the optimum LT treatment time for maximum inhibition of ASCT1, Na+-dependent Ala uptake studies were performed in control (vehicle ) or LT treated IEC-6 cells with different time intervals.
Cells were treated with 500.0 nM of LT for 12, 24, 48, and 72 h before the uptake studies that were performed at 10 days postconfluent. Figure 2, panel C demonstrates that minimal inhibition of Na+-Ala uptake was at 12 h of LT treatment and maximum inhibition began to taper off at 48 h of treatment as compared with control.
Since, there is no significant difference in Na+-Ala uptake between 48 and 72 h, thus concluded that 48 h of treatment with LT would be the best optimal exposure time to inhibit ASCT1 activity in IEC-6 cells.
LT augmented a dose-dependent cell death and apoptosis
It has been shown that the blockade of the LTB4-signaling pathway induces apoptosis via the inhibition of ERK activation in colon cancer cells [13]. Thus, we hypothesize that LT may lead to apoptosis or cell death in IEC-6 cells which may cause the ASCT1 inhibition.
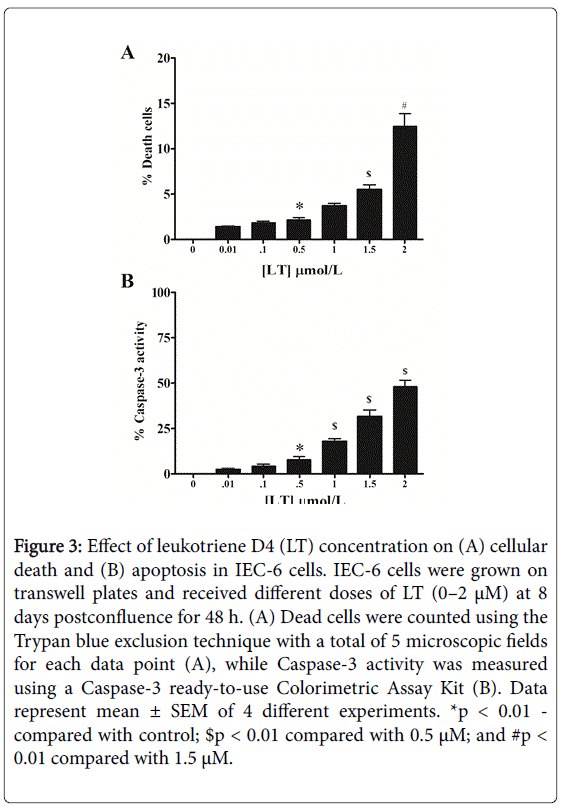
Therefore, in order to determine the effects of LT on enterocyte survival, we treated IEC-6 cells for 48 h with increasing concentrations of LT (10–2000 nM) and measured cellular death by Trypan Blue, and apoptosis by Caspase-3 activity (Figure 3).
Control groups (vehicle treated) did not show any significant increase in either cell death or apoptosis over that were observed in treated cells.
In contrast, LT concentrations of 1000-2000 nM significantly increased the number of dead cells as compared with 500 nM (Figure 3, panel A).
Figure 3: Effect of leukotriene D4 (LT) concentration on (A) cellular death and (B) apoptosis in IEC-6 cells. IEC-6 cells were grown on transwell plates and received different doses of LT (0–2 μM) at 8 days postconfluence for 48 h. (A) Dead cells were counted using the Trypan blue exclusion technique with a total of 5 microscopic fields for each data point (A), while Caspase-3 activity was measured using a Caspase-3 ready-to-use Colorimetric Assay Kit (B). Data represent mean ± SEM of 4 different experiments. *p < 0.01 - compared with control; $p < 0.01 compared with 0.5 μM; and #p < 0.01 compared with 1.5 μM.
Furthermore, Caspase-3 activity was significantly increased in 500 nM of LT- treated cells as compared with lower concentrations (Figure 3, panel B). While, there is a robust increase of Caspase-3 in 2000 nM as compared with 500 nM of LT-treated cells.
Both studies show that LT augmented a concentration-dependent increase in cell death or apoptosis with maximal effects seen at 2000 nM.
Thus, these data indicated that increased cell death and apoptosis (by 500 nM of LT) minimally may affect ASCT1 activity, which is consistent with the Deming analysis of LT concentration-response effect (Figure 2, panel B) in IEC-6 cells.
Cytokine specificity for ASCT1
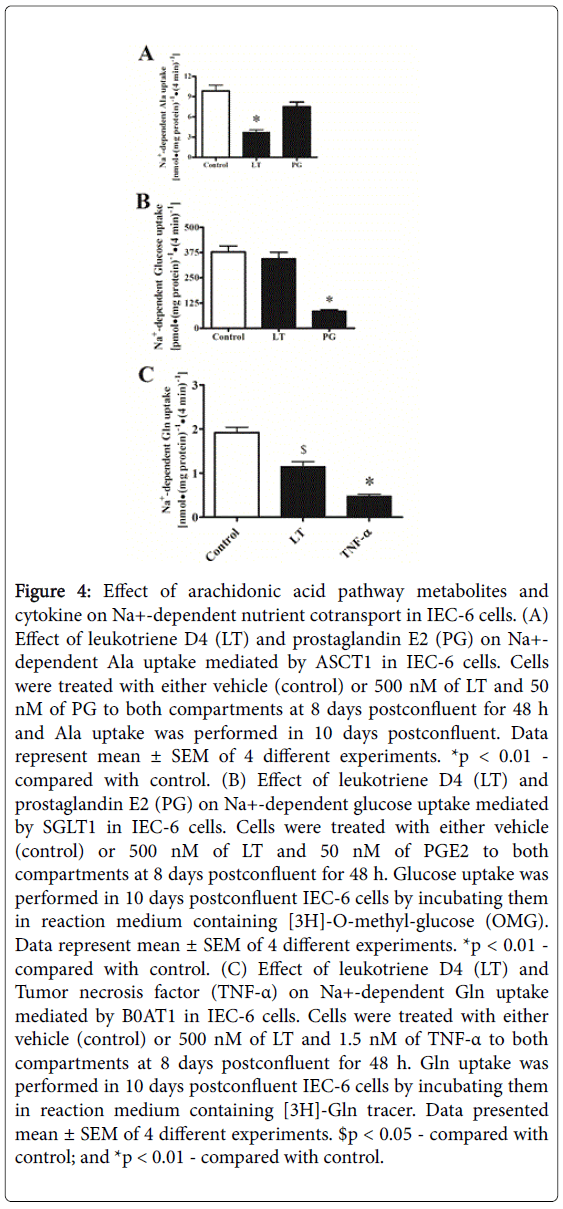
The arachidonic acid pathway leads to (i) cyclooxygenase pathway to produce PGE2 (PG) and (ii) Lipoxygenase to produce Leukotriene D4 (LT) derived from 5-lipooxygenase pathway. It has been shown that LT inhibits Na+-dependent Ala cotransporter (ASCT1) in enterocytes [8] which also transports glutamine (Gln). Furthermore, TNF-α inhibits Na+-glutamine (Gln) cotransport in IEC-6 cells [10]. Therefore, we examined the effects of LT, PG, and TNF-α on Ala, glucose, and Gln cotransport, respectively, in IEC-6 cells. Cells were grown on transwell membrane, treated with either LT (500 nM, 48 h), PG (50 nM, 24 h), TNF-α (1.5 nM, 24 h) or control (vehicle) and Na+-Ala, Na+-glucose, and Na+-Gln uptake studies were performed at 10 days postconfluent. Figure 4, panel A shows that PG insignificantly inhibited ASCT1 (Na+-Ala uptake) as compared with control but LT did ASCT1 inhibition. In contrast, LT treatment did not inhibit SGLT1 (Na+-glucose uptake) but PG significantly inhibited (Figure 4, panel B). Moreover, as shown in Figure 4, panel C, Na+-dependent Gln uptake studies revealed that both LT and TNF-α inhibited B0AT1 activity for Gln influx. These data showed that inflammatory cytokine, LT specifically affects ASCT1 for Ala transport in IEC-6 cells.
Figure 4: Effect of arachidonic acid pathway metabolites and cytokine on Na+-dependent nutrient cotransport in IEC-6 cells. (A) Effect of leukotriene D4 (LT) and prostaglandin E2 (PG) on Na+- dependent Ala uptake mediated by ASCT1 in IEC-6 cells. Cells were treated with either vehicle (control) or 500 nM of LT and 50 nM of PG to both compartments at 8 days postconfluent for 48 h and Ala uptake was performed in 10 days postconfluent. Data represent mean ± SEM of 4 different experiments. *p < 0.01 - compared with control. (B) Effect of leukotriene D4 (LT) and prostaglandin E2 (PG) on Na+-dependent glucose uptake mediated by SGLT1 in IEC-6 cells. Cells were treated with either vehicle (control) or 500 nM of LT and 50 nM of PGE2 to both compartments at 8 days postconfluent for 48 h. Glucose uptake was performed in 10 days postconfluent IEC-6 cells by incubating them in reaction medium containing [3H]-O-methyl-glucose (OMG). Data represent mean ± SEM of 4 different experiments. *p < 0.01 - compared with control. (C) Effect of leukotriene D4 (LT) and Tumor necrosis factor (TNF-α) on Na+-dependent Gln uptake mediated by B0AT1 in IEC-6 cells. Cells were treated with either vehicle (control) or 500 nM of LT and 1.5 nM of TNF-α to both compartments at 8 days postconfluent for 48 h. Gln uptake was performed in 10 days postconfluent IEC-6 cells by incubating them in reaction medium containing [3H]-Gln tracer. Data presented mean ± SEM of 4 different experiments. $p < 0.05 - compared with control; and *p < 0.01 - compared with control.
Effect of LT on cytosolic cAMP [(cAMP)i]
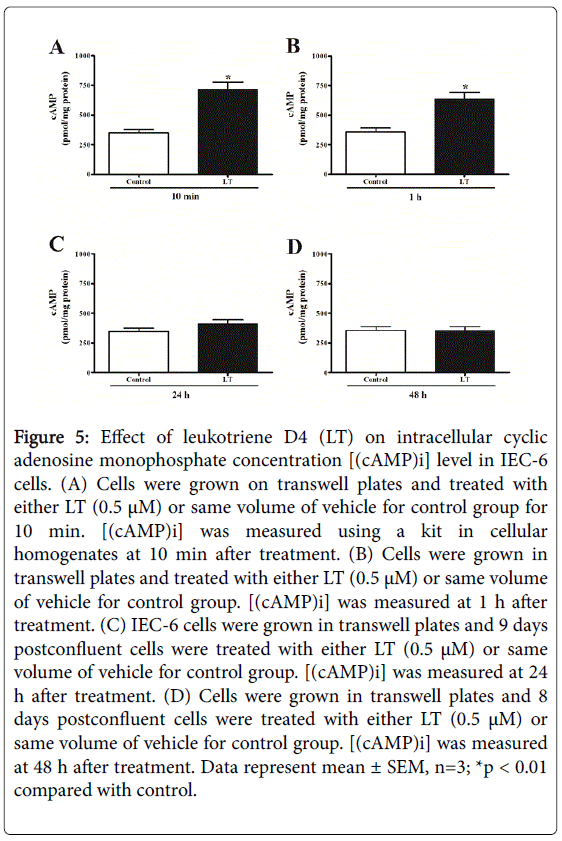
“Second messengers” such as cAMP, are one of the most important intracellular key compounds involved as a modulator of pathophysiological processes. It has been shown that [(cAMP)i] involved in different systems including immune mechanisms, cell growth and differentiation, and general metabolism [14]. Therefore, [(cAMP)i] measurement may pave the way to understand the pathophysiology of LT in enterocytes. IEC-6 cells were grown on transwell dishes, treated with 500 nM of LT at 8 days postconfluent and cAMP concentrations were measured. Figure 5 shows the [(cAMP)i] levels in control and LT treated IEC-6 cells in different time points. LT treatment significantly stimulated [(cAMP)i] levels at 10 and 60 min as compared with control. This finding suggested that LT may function through PKA pathway to down-regulate ASCT1 activity in enterocytes.
Figure 5: Effect of leukotriene D4 (LT) on intracellular cyclic adenosine monophosphate concentration [(cAMP)i] level in IEC-6 cells. (A) Cells were grown on transwell plates and treated with either LT (0.5 μM) or same volume of vehicle for control group for 10 min. [(cAMP)i] was measured using a kit in cellular homogenates at 10 min after treatment. (B) Cells were grown in transwell plates and treated with either LT (0.5 μM) or same volume of vehicle for control group. [(cAMP)i] was measured at 1 h after treatment. (C) IEC-6 cells were grown in transwell plates and 9 days postconfluent cells were treated with either LT (0.5 μM) or same volume of vehicle for control group. [(cAMP)i] was measured at 24 h after treatment. (D) Cells were grown in transwell plates and 8 days postconfluent cells were treated with either LT (0.5 μM) or same volume of vehicle for control group. [(cAMP)i] was measured at 48 h after treatment. Data represent mean ± SEM, n=3; *p < 0.01 compared with control.
Effect of PKA inhibitor on LT-mediated inhibition of ASCT1
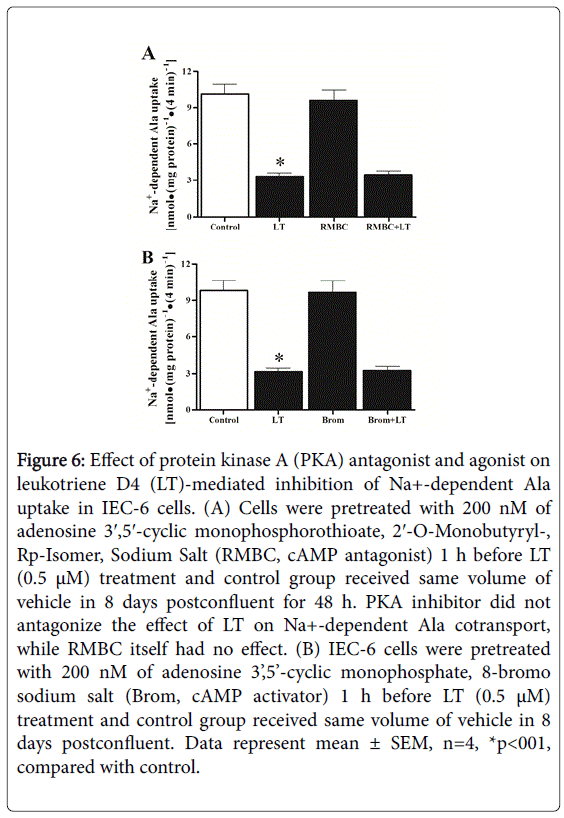
Adenosine 3′,5′-cyclic Monophosphorothioate, 2′-O-Monobutyryl-, Rp-Isomer, Sodium Salt (RMBC), and cAMP antagonist, acts as a competitive inhibitor of PKA. The inhibitor and butyrate are released during metabolic activation by esterases. IEC-6 cells were grown on transwell plates, treated with either vehicle (control) or 200 nM (our unpublished data) of RMBC at 8 days postconfluent and Ala uptake was performed at 4 min in 10 days postconfluent. As shown in Figure 6, panel A, RMBC itself did not affect Na+-dependent Ala uptake. In addition, RMBC also did not reverse LT-mediated inhibition of Ala uptake as compared with control. Further, adenosine 3’,5’-cyclic monophosphate, 8-bromo sodium salt (Brom) also did not alter Na+-dependent Ala uptake (Figure 6, panel B). These data indicated that inhibition of ASCT1 by LT is not mediated by PKA pathway rather than increased [(cAMP)i] concentrations that might have some other functions that remain unknown in enterocytes.
Figure 6: Effect of protein kinase A (PKA) antagonist and agonist on leukotriene D4 (LT)-mediated inhibition of Na+-dependent Ala uptake in IEC-6 cells. (A) Cells were pretreated with 200 nM of adenosine 3′,5′-cyclic monophosphorothioate, 2′-O-Monobutyryl-, Rp-Isomer, Sodium Salt (RMBC, cAMP antagonist) 1 h before LT (0.5 μM) treatment and control group received same volume of vehicle in 8 days postconfluent for 48 h. PKA inhibitor did not antagonize the effect of LT on Na+-dependent Ala cotransport, while RMBC itself had no effect. (B) IEC-6 cells were pretreated with 200 nM of adenosine 3’,5’-cyclic monophosphate, 8-bromo sodium salt (Brom, cAMP activator) 1 h before LT (0.5 μM) treatment and control group received same volume of vehicle in 8 days postconfluent. Data represent mean ± SEM, n=4, *p<001, compared with control.
Effect of LT on cytosolic Ca2+ levels [(Ca2+)i]
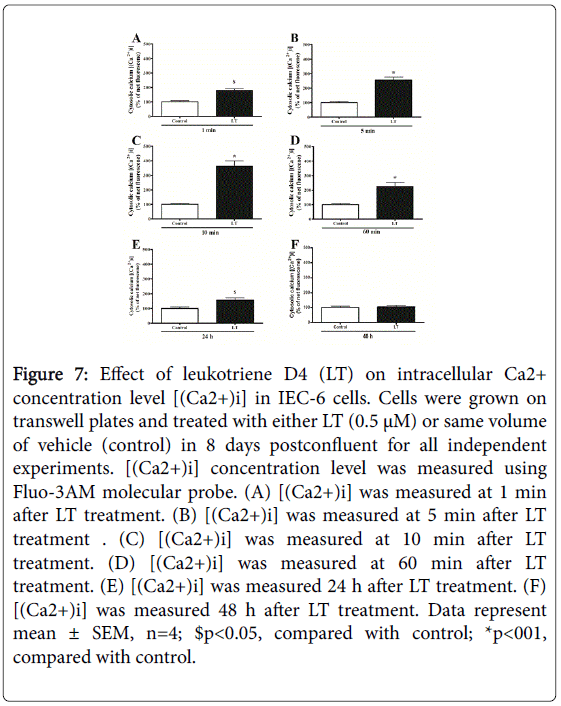
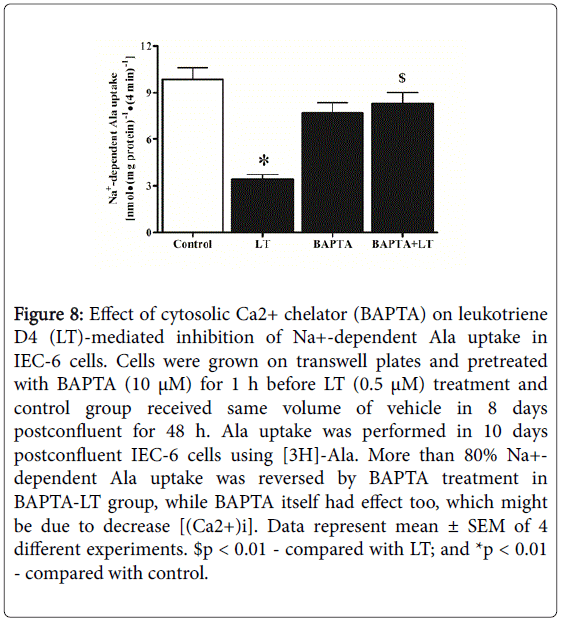
Ca2+, a second messenger is being used to control many cellular pathophysiological processes including secretion, excitability, cell proliferation and cell death. Therefore, we addressed the effect of LT on [(Ca2+)i] levels. The intracellular Ca2+ response to treatment with LT is shown in Figure 7. LT treatment significantly increased [(Ca2+)i] level even at 1 min (Figure 7, panel A), more than 2-fold at 5 min (Figure 7, panel B), and 3-fold at 10 min (Figure 7, panel C) followed by a decrease at 60 min (Figure 7, panel D) and 24 h (Figure 7, panel E). These data indicated that LT inhibits ASCT1 most likely by a Ca2+-dependent second messenger pathway. To confirm the involvement of [(Ca2+)i] along with LT to inhibit ASCT1 activity, we used 1,2-bis(o-Aminophenoxy) ethane-N,N,N′,N′-tetraacetic Acid Tetra (acetoxymethyl) Ester (BAPTA) which is widely used as an intracellular Ca2+ chelator. We investigated the effect of intracellular Ca2+ chelation on LT meditated inhibition of Ala uptake in IEC-6 cells (Figure 8)BAPTA significantly (80%) alleviated LT-mediated inhibition of Na+-dependent Ala uptake although BAPTA itself inhibited (BAPTA 35% Vs LT 71% compared with control) Ala uptake. These alterations might be due to decrease of [(Ca2+)i] concentrations and changes of Ca2+ homeostasis as well as activation of Ca2+-dependent kinases. These data demonstrated that LT-mediated inhibition of ASCT1 is Ca2+-dependent and next, we looked for the involvement of any kinases for this regulation.
Figure 7: Effect of leukotriene D4 (LT) on intracellular Ca2+ concentration level [(Ca2+)i] in IEC-6 cells. Cells were grown on transwell plates and treated with either LT (0.5 μM) or same volume of vehicle (control) in 8 days postconfluent for all independent experiments. [(Ca2+)i] concentration level was measured using Fluo-3AM molecular probe. (A) [(Ca2+)i] was measured at 1 min after LT treatment. (B) [(Ca2+)i] was measured at 5 min after LT treatment . (C) [(Ca2+)i] was measured at 10 min after LT treatment. (D) [(Ca2+)i] was measured at 60 min after LT treatment. (E) [(Ca2+)i] was measured 24 h after LT treatment. (F) [(Ca2+)i] was measured 48 h after LT treatment. Data represent mean ± SEM, n=4; $p<0.05, compared with control; *p<001, compared with control.
Figure 8: Effect of cytosolic Ca2+ chelator (BAPTA) on leukotriene D4 (LT)-mediated inhibition of Na+-dependent Ala uptake in IEC-6 cells. Cells were grown on transwell plates and pretreated with BAPTA (10 μM) for 1 h before LT (0.5 μM) treatment and control group received same volume of vehicle in 8 days postconfluent for 48 h. Ala uptake was performed in 10 days postconfluent IEC-6 cells using [3H]-Ala. More than 80% Na+- dependent Ala uptake was reversed by BAPTA treatment in BAPTA-LT group, while BAPTA itself had effect too, which might be due to decrease [(Ca2+)i]. Data represent mean ± SEM of 4 different experiments. $p < 0.01 - compared with LT; and *p < 0.01 - compared with control.
Effect of PKC and PKC isoenzymes inhibitor on LT-mediated inhibition of ASCT1
Cells use a large number of clearly defined signaling pathways to regulate their activity. Protein kinase C (PKC) is a multifunctional, cyclic nucleotide-independent protein kinase, involved in signal transduction associated with cell proliferation, differentiation, and apoptosis [15]. Activation of PKC's is critically dependent on [Ca2+]i. Indeed, the level of Ca2+ under resting conditions is insufficient to activate PKC. Upon receptor stimulation, and subsequent Ca2+ mobilization, the [Ca2+]i increases transiently and of sufficient magnitude to promote translocation of inactive PKC from the cytosol to the plasma membrane for attachment and activation.
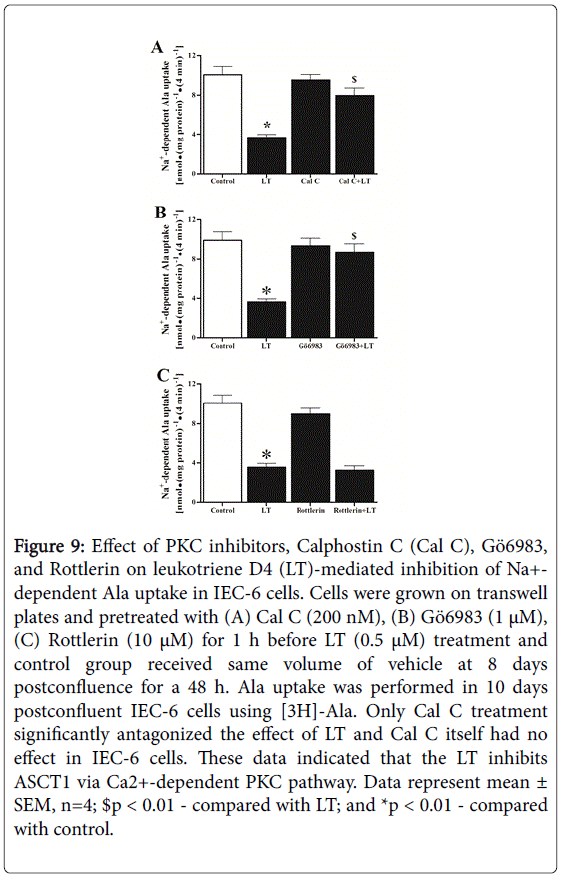
Thus, it is well known that the binding of Ca2+ translocates PKC to the membrane. In addition, altered PKC activity is linked with various types of malignancies [16]. Higher levels of PKC and differential activation of various PKC isozymes have been reported in breast tumors, adenomatous pituitaries, thyroid cancer tissue, leukemic cells, and lung cancer cells [16,17]. We used Calphostin C, a cell permeable, highly specific inhibitor of PKC that interacts with the protein’s regulatory domain by competing at the binding site of diacylglycerol and phorbol esters. It does not compete with Ca2+ or phospholipids. Figure 9, panel A shows the effect of Calphostin C on LT-mediated inhibition of Na+-dependent Ala uptake in IEC-6 cells. Calphostin C (Cal C, 200 nM) itself did not affect Na+-Ala uptake in IEC-6 cells. Calphostin C treatment Conventional PKC isozymes (α, β, γ) are Ca2+-dependent, while novel and atypical isozymes (δ, ε, η, ???μ?do not require Ca2+ for their activation.
Figure 9: Effect of PKC inhibitors, Calphostin C (Cal C), Gö6983, and Rottlerin on leukotriene D4 (LT)-mediated inhibition of Na+- dependent Ala uptake in IEC-6 cells. Cells were grown on transwell plates and pretreated with (A) Cal C (200 nM), (B) Gö6983 (1 μM), (C) Rottlerin (10 μM) for 1 h before LT (0.5 μM) treatment and control group received same volume of vehicle at 8 days postconfluence for a 48 h. Ala uptake was performed in 10 days postconfluent IEC-6 cells using [3H]-Ala. Only Cal C treatment significantly antagonized the effect of LT and Cal C itself had no effect in IEC-6 cells. These data indicated that the LT inhibits ASCT1 via Ca2+-dependent PKC pathway. Data represent mean ± SEM, n=4; $p < 0.01 - compared with LT; and *p < 0.01 - compared with control.
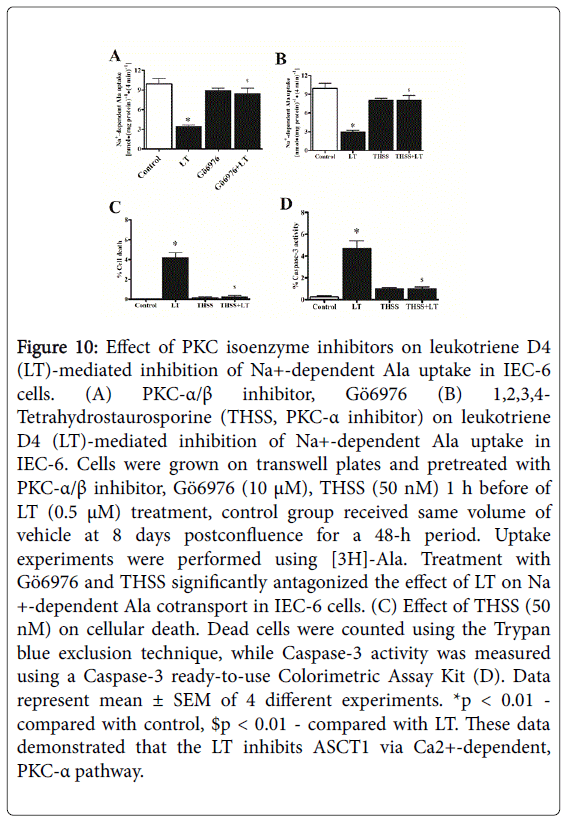
We used Gö6983 (10 µM), a cell-permeable and inhibits Ca2+-dependent PKC [α, β, γ] isozymes not the Ca2+-independent PKC isozymes. Therefore, we addressed the role of PKC-δ? isozyme, although they do not require Ca2+ for their activation. In this regard, we used Rottlerin (10 µM), a cell-permeable and exhibits greater selectivity for PKC-? and -?inhibition as shown in Figure 9, panel C. Rottlerin did not intercept LT-mediated inhibition Na+-dependent Ala uptake. Moreover, we used 10 µM of Gö6976 as Ca2+-dependent PKC-α/β inhibitor [17].
As shown in Figure 10, panel A, inhibition of PKC-α/β with Gö6976 reversed 84% of LT-mediated inhibition of Na+-dependent Ala uptake as compared with control. In addition, to identify the specific PKC isoenzyme, we used PKC-α inhibitor, THSS (50 nM) as shown in Figure 10, panel B. It also significantly intercepted LT-mediated inhibition of Na+-dependent Ala uptake. Additionally, we addressed whether THSS prevents LT effects on cellular death and Caspase-3 activity.
Figure 10: Effect of PKC isoenzyme inhibitors on leukotriene D4 (LT)-mediated inhibition of Na+-dependent Ala uptake in IEC-6 cells. (A) PKC-α/β inhibitor, Gö6976 (B) 1,2,3,4- Tetrahydrostaurosporine (THSS, PKC-α inhibitor) on leukotriene D4 (LT)-mediated inhibition of Na+-dependent Ala uptake in IEC-6. Cells were grown on transwell plates and pretreated with PKC-α/β inhibitor, Gö6976 (10 μM), THSS (50 nM) 1 h before of LT (0.5 μM) treatment, control group received same volume of vehicle at 8 days postconfluence for a 48-h period. Uptake experiments were performed using [3H]-Ala. Treatment with Gö6976 and THSS significantly antagonized the effect of LT on Na +-dependent Ala cotransport in IEC-6 cells. (C) Effect of THSS (50 nM) on cellular death. Dead cells were counted using the Trypan blue exclusion technique, while Caspase-3 activity was measured using a Caspase-3 ready-to-use Colorimetric Assay Kit (D). Data represent mean ± SEM of 4 different experiments. *p < 0.01 - compared with control, $p < 0.01 - compared with LT. These data demonstrated that the LT inhibits ASCT1 via Ca2+-dependent, PKC-α pathway.
These studies demonstrated that cellular death (Figure 10, panel C) and caspase-3 activity (Figure 10, panel D) was significantly reduced in THSS-LT treated cells. These studies revealed that LT requires Ca2+-dependent PKC-α isozyme to inhibit ASCT1 in IEC-6 cells.
Effect of Akt inhibitor on LT-mediated inhibition of ASCT1
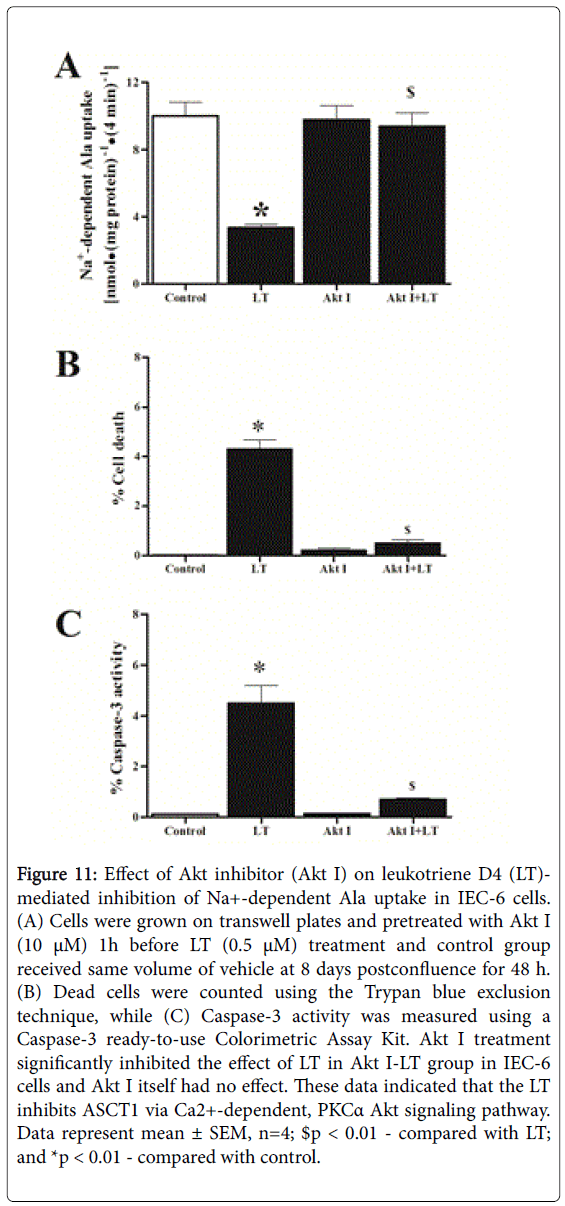
There are a large number of intracellular signaling pathways responsible for transmitting information within the cell. Li et al. [18] demonstrated that suppression of apoptosis by PKC-alpha correlates with its ability of activating endogenous Akt, a serine/ threonine kinase. Furthermore, activation of overexpressed Akt by PKC-alpha is consistent with their synergistic effect on suppressing apoptosis, provided the strong evidence of cross talk between Akt and PKC-alpha. Therefore, we looked the involvement of Akt on LT-mediated inhibition of ASCT1. We used Akt inhibitor (Akt I, as shown in Figure 11, panel A. Akt I, itself did not significantly inhibit Na+-dependent Ala uptake. In contrast, when cells were treated with Akt I and then LT, it Figure 11, panel D)These data indicated that 2+ -
Figure 11: Effect of Akt inhibitor (Akt I) on leukotriene D4 (LT)- mediated inhibition of Na+-dependent Ala uptake in IEC-6 cells. (A) Cells were grown on transwell plates and pretreated with Akt I (10 μM) 1h before LT (0.5 μM) treatment and control group received same volume of vehicle at 8 days postconfluence for 48 h. (B) Dead cells were counted using the Trypan blue exclusion technique, while (C) Caspase-3 activity was measured using a Caspase-3 ready-to-use Colorimetric Assay Kit. Akt I treatment significantly inhibited the effect of LT in Akt I-LT group in IEC-6 cells and Akt I itself had no effect. These data indicated that the LT inhibits ASCT1 via Ca2+-dependent, PKCα Akt signaling pathway. Data represent mean ± SEM, n=4; $p < 0.01 - compared with LT; and *p < 0.01 - compared with control.
Effect of Akt inhibitor on ASCT1 mRNA abundance and ASCT1 protein expression
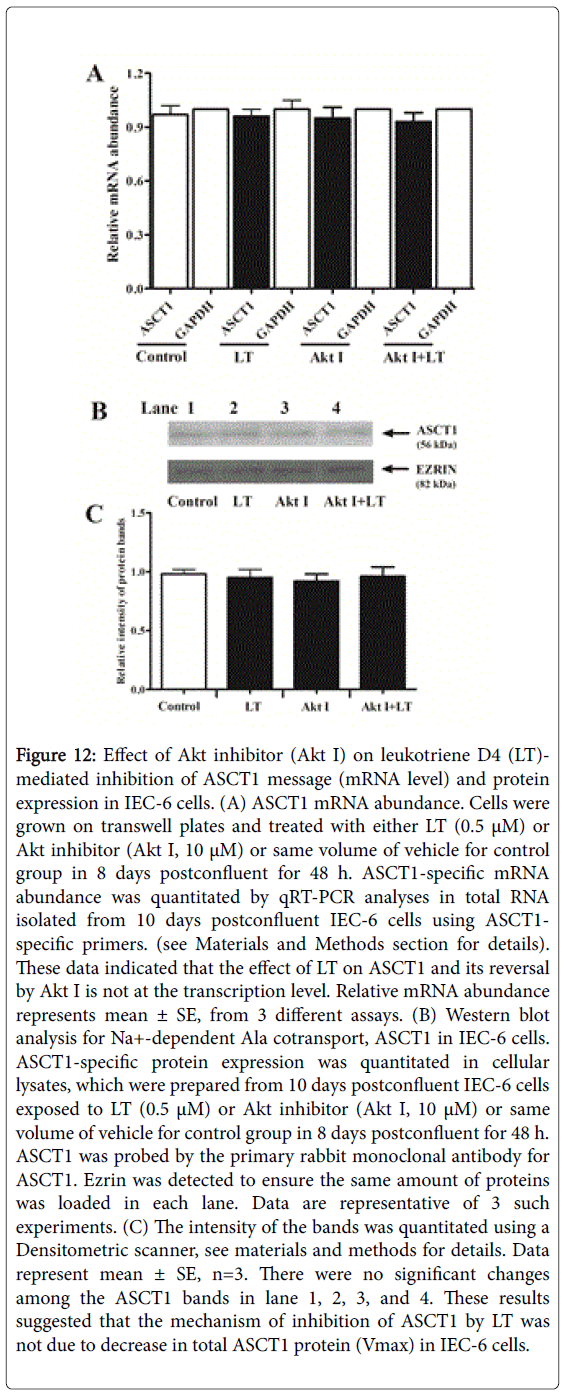
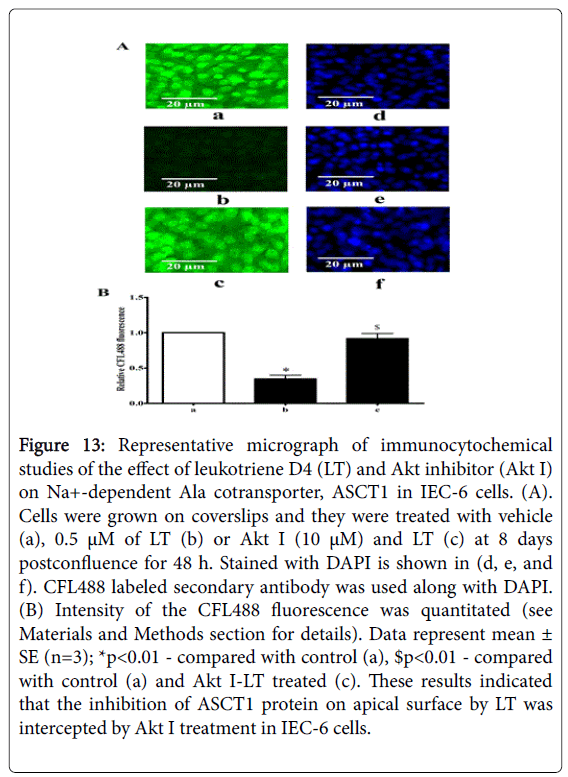
To further determine the reversal of -mediated inhibition of ASCT1 by Akt inhibitor (Akt I), we performed molecular studies. Figure 12, panel A illustrates ASCT1 mRNA abundance in control and treated IEC-6 cells. It shows that neither nor Akt I, and Akt I-LT affected ASCT1 mRNA and GAPDH abundance. Since, mRNA abundance may not correlate with functional ASCT1 protein levels on plasma membrane, ASCT1 immunoreactive protein levels were measured by Western blotting. We quantitated ASCT1 immunoreactive protein level in control, LT, Akt I, and Akt I-LT treated IEC-6 cells. There was no significant difference in the ASCT1 protein levels of the cellular lysates among the groups (Figure 12, panel B, lane 2, 3, and 4) compared with control (Lane 1), confirmed by Densitometric quantitation of these bands in panel 12C. The localization of ASCT1 proteins on apical membrane of IEC-6 cells was investigated by immunocytochemical studies and the data are presented in Figure 13, panel A. Intensity of specific fluorescence for a specific group is shown in panel 13B. These data showed that about 3-fold fluorescence is inhibited in LT treated group (Figure 13, panel A: b) as compared with control (Figure 13, panel A: a). In contrast, there is no significant difference in total fluorescence between Akt I-LT treated (Figure 13, panel A: c) and control group (Figure 13, panel A: a). The discrepancy between the results of immunoblotting and immunocytochemistry might be due to the affinity of ASCT1 epitope on cellular lysates and apical membrane. Thus, these findings indicated that Akt inhibitor intercepted LT effects on ASCT1 in IEC-6 cells most likely by increasing the affinity (1/Km) of cotransporters without altering the total ASCT1 protein (Vmax) levels.
Figure 12: Effect of Akt inhibitor (Akt I) on leukotriene D4 (LT)- mediated inhibition of ASCT1 message (mRNA level) and protein expression in IEC-6 cells. (A) ASCT1 mRNA abundance. Cells were grown on transwell plates and treated with either LT (0.5 μM) or Akt inhibitor (Akt I, 10 μM) or same volume of vehicle for control group in 8 days postconfluent for 48 h. ASCT1-specific mRNA abundance was quantitated by qRT-PCR analyses in total RNA isolated from 10 days postconfluent IEC-6 cells using ASCT1- specific primers. (see Materials and Methods section for details). These data indicated that the effect of LT on ASCT1 and its reversal by Akt I is not at the transcription level. Relative mRNA abundance represents mean ± SE, from 3 different assays. (B) Western blot analysis for Na+-dependent Ala cotransport, ASCT1 in IEC-6 cells. ASCT1-specific protein expression was quantitated in cellular lysates, which were prepared from 10 days postconfluent IEC-6 cells exposed to LT (0.5 μM) or Akt inhibitor (Akt I, 10 μM) or same volume of vehicle for control group in 8 days postconfluent for 48 h. ASCT1 was probed by the primary rabbit monoclonal antibody for ASCT1. Ezrin was detected to ensure the same amount of proteins was loaded in each lane. Data are representative of 3 such experiments. (C) The intensity of the bands was quantitated using a Densitometric scanner, see materials and methods for details. Data represent mean ± SE, n=3. There were no significant changes among the ASCT1 bands in lane 1, 2, 3, and 4. These results suggested that the mechanism of inhibition of ASCT1 by LT was not due to decrease in total ASCT1 protein (Vmax) in IEC-6 cells.
Figure 13: Representative micrograph of immunocytochemical studies of the effect of leukotriene D4 (LT) and Akt inhibitor (Akt I) on Na+-dependent Ala cotransporter, ASCT1 in IEC-6 cells. (A). Cells were grown on coverslips and they were treated with vehicle (a), 0.5 μM of LT (b) or Akt I (10 μM) and LT (c) at 8 days postconfluence for 48 h. Stained with DAPI is shown in (d, e, and f). CFL488 labeled secondary antibody was used along with DAPI. (B) Intensity of the CFL488 fluorescence was quantitated (see Materials and Methods section for details). Data represent mean ± SE (n=3); *p<0.01 - compared with control (a), $p<0.01 - compared with control (a) and Akt I-LT treated (c). These results indicated that the inhibition of ASCT1 protein on apical surface by LT was intercepted by Akt I treatment in IEC-6 cells.
Effect of Akt inhibitor on kinetics of ASCT1
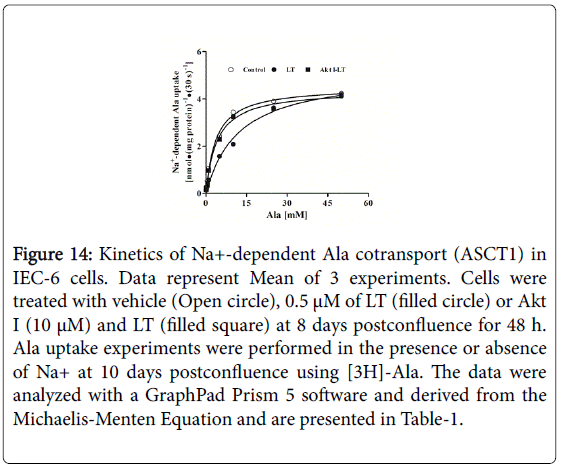
In order to confirm the immunocytochemical findings, further we performed kinetic studies to determine the mechanism of reversal of inhibition of ASCT1 by the Akt inhibitor. The data are presented in Figure 14. Uptake for all the substrate concentrations was carried out at 30 s because the initial uptake studies for Na+-dependent Ala uptake in IEC-6 cells were linear for at least 120 s (data not shown).
Figure 14: Kinetics of Na+-dependent Ala cotransport (ASCT1) in IEC-6 cells. Data represent Mean of 3 experiments. Cells were treated with vehicle (Open circle), 0.5 μM of LT (filled circle) or Akt I (10 μM) and LT (filled square) at 8 days postconfluence for 48 h. Ala uptake experiments were performed in the presence or absence of Na+ at 10 days postconfluence using [3H]-Ala. The data were analyzed with a GraphPad Prism 5 software and derived from the Michaelis-Menten Equation and are presented in Table-1.
In all the conditions Ala uptake was stimulated and became saturated. Table 1 shows the parameters of kinetics of Ala uptake in IEC-6 cells derived from Michaelis-Menten equation. Maximal rate of uptake or Vmax is not affected in any of these conditions.
| Treatment | Vmax[nmol.(mg protein)-1.(30 s) -1] | Km(mM) |
|---|---|---|
| Control | 4.53 ± 0.09 | 3.72 ± 0.32 |
| LT | 5.17 ± 0.31 | 12.20 ± 2.01 $ |
| Akt I-LT | 4.39 ± 0.14 | 4.07 ± 0.50 * |
Table 1: Kinetic parameters (from kinetic studies analyses) derived from the Michaelis-Menten equation
In contrast, inhibited ASCT1 activity by decreasing the affinity (1/Km) which is consistent with the findings of immunocytochemical, immunoblotting, and mRNA abundance of ASCT1. Further, reversal of -mediated inhibition of ASCT1 by Akt inhibitor is due to the restoration of affinity (1/Km).
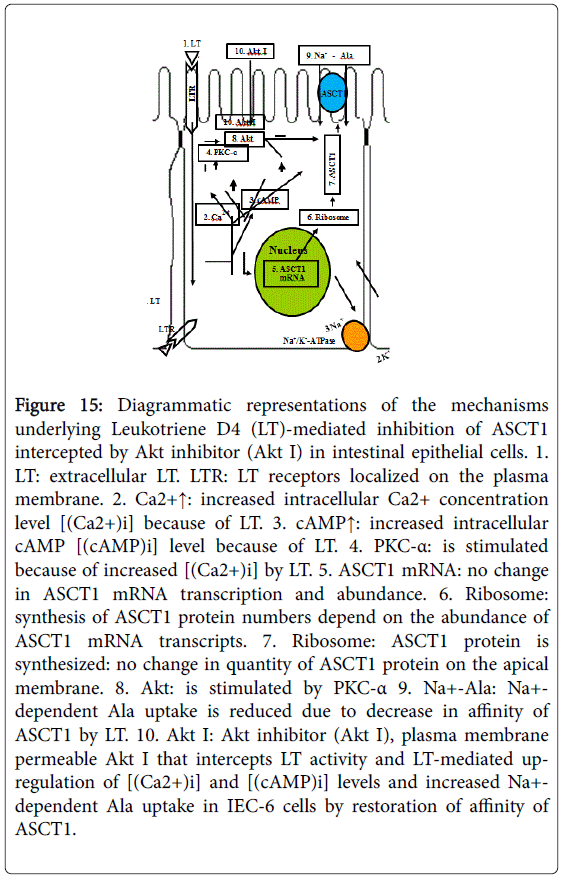
In conclusion, all of the data demonstrated that inhibits ASCT1 at the level of affinity of the cotransporters by decreasing the affinity rather than cotransporter numbers (Vmax) through Ca2+-dependent PKC-α via Akt pathway to inhibit Ala transport in IEC-6 cells, depicted in Figure 15.
Figure 15: Diagrammatic representations of the mechanisms underlying Leukotriene D4 (LT)-mediated inhibition of ASCT1 intercepted by Akt inhibitor (Akt I) in intestinal epithelial cells. 1. LT: extracellular LT. LTR: LT receptors localized on the plasma membrane. 2. Ca2+↑: increased intracellular Ca2+ concentration level [(Ca2+)i] because of LT. 3. cAMP↑: increased intracellular cAMP [(cAMP)i] level because of LT. 4. PKC-α: is stimulated because of increased [(Ca2+)i] by LT. 5. ASCT1 mRNA: no change in ASCT1 mRNA transcription and abundance. 6. Ribosome: synthesis of ASCT1 protein numbers depend on the abundance of ASCT1 mRNA transcripts. 7. Ribosome: ASCT1 protein is synthesized: no change in quantity of ASCT1 protein on the apical membrane. 8. Akt: is stimulated by PKC-α 9. Na+-Ala: Na+- dependent Ala uptake is reduced due to decrease in affinity of ASCT1 by LT. 10. Akt I: Akt inhibitor (Akt I), plasma membrane permeable Akt I that intercepts LT activity and LT-mediated upregulation of [(Ca2+)i] and [(cAMP)i] levels and increased Na+- dependent Ala uptake in IEC-6 cells by restoration of affinity of ASCT1.
Discussion
Leukotriene D4 (LT), the end product of arachidonic acid metabolite derived via incites a cascade of intracellular changes in intestinal epithelial cells. Leukotriene D4 treatment inhibited Na+-dependent Ala uptake 3-fold in IEC-6 cells (Figure 2, panel C). Thus, given the numerous immune-inflammatory mediators, are produced in chronically inflamed intestine and given that at least some of them are capable of altering transport pathways indicate that different immune-inflammatory mediators may regulate different cotransport during chronic enteritis leads to malabsorption of nutrients and diarrhea.
Cyclic adenosine monophosphate (cAMP) is a second messenger that is important in many biological processes such as transferring the effects of hormones like glucagon and adrenaline, which cannot get through the cell membrane. In this study, LT treatment increased [(cAMP)i] more than 2-fold in IEC-6 cells (Figure 5, panel A). [(cAMP)i] levels remained significantly high for 1 h after LT treatment (panel 5B) and remained insignificantly high till 24 h. These results suggest that once [(cAMP)i] level is augmented, it may “turn on” intracellular effects on different cAMP-dependent pathways that may not require increased levels for days (48 h). It is well known that cAMP is involved in the activation of protein kinases and regulates the effects of different hormones [19] and some research has suggested that a dysregulation of cAMP pathways and an aberrant activation of cAMP-controlled genes is linked to develop diseases including cancers [20,21]. We treated IEC-6 cells in conjunction with LT, PKA inhibitor (RMBC) and performed Na+-dependent Ala uptake studies. We observed that treatment with RMBC did not reverse LT-mediated inhibition of ASCT1 activity in IEC-6 cells (Figure 6, panel A). This finding indicated that LT does not down regulate ASCT1 activity via PKA pathway for Na+-dependent Ala uptake in enterocytes. We cannot rule out the possibility of other functions of the augmented [(cAMP)i] by LT but it is not linked to ASCT1 inhibition.
Ca2+ is one of the common signaling mechanisms; once it enters the cytoplasm it exerts allosteric regulatory effects on many enzymes and proteins. [(Ca2+)i] can act in signal transduction after influx resulting from activation of ion channels or as a second messenger caused by indirect signal transduction pathways such as G protein-coupled receptors. Grönroos et al. [22] demonstrated that LT induces calcium signaling in the intestinal epithelial cell line Int 407. We also found that LT treatment increased more than 2-fold [(Ca2+)i] concentration in IEC-6 cells (Figure 7) which is in agreement with the findings of Thodeti and Sj?lander [23] where they used human intestinal cells. These findings indicated that LT inhibits ASCT1 most likely via Ca2+-dependent pathway.
The protein kinases C (PKC) are signal transducers implicated in the phosphorylation of several nuclear receptors. PKC isozymes are classified in three groups on the basis of their structure and ability to bind diacylglycerol (DAG) and Ca2+ [24]. Moreover, individual protein kinase C (PKC) isozymes have been implicated in many cellular responses important in health and disease, including permeability, contraction, migration, hypertrophy, proliferation, apoptosis, and secretion [25]. We investigated the effect of PKC inhibitor (Calphostin C) on LT-mediated inhibition of ASCT1 in IEC-6 cells. We observed that Ca2+-dependent PKC inhibitors almost fully reversed LT-mediated inhibition of ASCT1 activity in IEC-6 cells. These data revealed that LT inhibits ASCT1 via Ca2+-dependent PKC pathway. Since, PKC isozymes are classified into three groups, further we studied for the involvement of specific PKC isotypes. Out of three PKC isozyme groups, the classical PKC such as PKCα, display a physiological requirement for DAG and need Ca2+ for activation. PKCα seems to be ubiquitous and found in most tissues. Given the plethora of substrates, numerous functions have been attributed to PKC. Among many functions, PKCs are involved in receptor desensitization, in modulating membrane structure, in regulating transcription, in mediating immune responses and in regulating cell growth. PKC inhibitors have been identified and classified according to their site of interaction with the PKC protein [26]. In order to determine the specific PKC isotypes that may play a crucial role in ASCT1 regulation, we used PKCα antagonist (THSS) since PKCα needs Ca2+ for activation. Intriguingly, when IEC-6 cells were treated with THSS and then LT, Ala uptake studies revealed that PKCα inhibitor more than 90% reverses LT-mediated inhibition of ASCT1 as well as cellular death and apoptosis. These data revealed that LT inhibits ASCT1 activity through Ca2+-dependent PKCα pathway. PKCα and Ca2+ generate intracellular signaling pathways and having many diverse roles, including membrane trafficking along the endocytic pathway, cytoskeletal organization, adhesion, cell growth, and apoptosis [27]. Furthermore, Li et al. [19] demonstrated that PKCα overexpression stimulates Akt activity and suppresses apoptosis in myeloid progenitor cells. They also showed that PKCα, but not PKCδ or PKCε, specifically activated and Akt was overexpressed. Debra et al. [28] observed that PI3-kinase-Akt signaling pathway is essential in the induction of physiological cardiac hypertrophy. Given these backgrounds, in this present study we looked more downstream of PKCα for the role of Akt in LT-mediated inhibition of ASCT1. We treated IEC-6 cells with Akt inhibitor, followed by LT. Alanine uptake studies showed that Akt inhibitor completely reversed LT-mediated inhibition of ASCT1 (Figure 11). Together all these studies revealed that LT inhibits ASCT1 through Ca2+-dependent PKCα via Akt pathway.
Our previous studies of kinetic parameters demonstrated that the mechanism of inhibition of ASCT1 by LT was due to a reduction in the affinity of the cotransporters for Ala rather than a decrease in the number of cotransporters [8]. Therefore, we performed kinetic studies using Akt inhibitor and LT whether it restores affinity of ASCT1. The present Kinetic studies demonstrated that Akt inhibitor completely antagonized LT actions in IEC-6 cells and the mechanism was the restoration of affinity of the cotransport without a change in total number of cotransporters, Vmax (Table 1). Quantitative Real-Time PCR (qRT-PCR) data demonstrated the presence of the message for ASCT1 in control, and the mRNA abundance was not affected in LT, Akt inhibitor, and Akt inhibitor-LT treated IEC-6 cells (Figure 12, panel A) as ASCT1 is responsible for Na+-dependent Ala cotransport. The changes in affinity of the cotransporter might be due to glycosylation of ASCT1. Glycosylation studies revealed that ASCT1 was not glycosylated due to LT treatment in IEC-6 cells (data not shown). Furthermore, Western blot and immunocytochemical analyses (Figure 12, panel B and Figure 13, panel A: a) demonstrated the presence of functional ASCT1 protein in cellular lysates (Control). Western blot showed that ASCT1 immunoreactive protein levels were not reduced in LT treated cells as compared with control. In contrast, immunocytochemical analyses demonstrated a significant reduction in fluorescence. This discrepancy might be due to either localization or affinity of ASCT1 epitope on apical membrane of enterocytes. However, Akt inhibitor prevented LT-mediated inhibition of ASCT1 (Figure 11; Figure 12, panel B; Figure 13, panel A: c). These findings demonstrated that the reversal mechanism of inhibition of ASCT1 by Akt inhibitor is due to the restoration of affinity of the cotransporter rather than an alteration in the number of cotransporters in IEC-6 cells. Thus, the summarized mechanisms underlying LT-mediated inhibition of ASCT1 in enterocyte is depicted in Figure 15. It shows that LT initially increases [(Ca2+)i] and [(cAMP)i] levels. Although the starring role of augmented [(cAMP)i] for ASCT1 remained unclear but an increase in [(Ca2+)i] level is essential to stimulate PKCα. This stimulation leads to activation of Akt pathway which decreases the affinity of ASCT1 in enterocytes. LT did neither affect ASCT1 gene expression nor protein synthesis. The reduction of affinity of ASCT1 down regulated the absorption of Ala by enterocytes during chronic enteritis such as IBD.
Conclusions
Understanding of intracellular mechanism, second messenger pathways of leukotriene mediated inhibition of sodium-dependent Ala transport (ASCT1) in enterocytes is important for future studies for nutrient malabsorption, potentially provided the basis for more novel and efficacious nutritional and treatment therapies for diarrhea. Different inhibitors in pathway-checkpoint would lead us to find efficacious treatments for nutrient malabsorption during enteritis. LT inhibited Na+-dependent Ala cotransporter, ASCT1 and increased [(cAMP)i] and [(Ca2+)i] levels. PKA inhibitor did not reverse the LT-mediated inhibition of ASCT1. In contrast, both PKC and PKCα inhibitors fully antagonized LT effects on ASCT1 but not PKCδ and –θ inhibitor. Understanding these novel insight mechanisms of this study involved in the down regulation of ASCT1 by LT and it’s restoration by Akt inhibitor for Ala absorption during chronic intestinal inflammation such as IBD that may crystallize the basis for designing new and more efficacious therapies.
Acknowledgements
This work was supported by National Science Foundation Grants HRD-1332459 to Dr. Golden (LeMoyne-Owen College), Dr. Talukder, and Dr. Hamada; and a UNCF Fellowship to Dr. Talukder. We also thank Dr. Harris, our Chair of the Division of Natural and Mathematical Sciences for her support.
References
- Castro GA (1990) Immunological regulation of electrolyte transport. In: E. Lebenthan and M.E. Duffey. Textbook of Secretory Diarrhea. New York: Raven 31–46.
- Powell DW (1991) Immunophysiology of intestinal electrolyte transport. In: Handbook of Physiology. The Gastrointestinal System. Intestinal Absorption and Secretion. Bethesda, MD: American Physiological Society, sect. 6, vol. IV, chapter 25: 591–641.
- Sartor RB, Powell DW (1991) Mechanisms of diarrhea in inflammation and hypersensitivity: immune system modulation of intestinal transport. In: M. Field. Current Topics in Gastroenterology: Diarrheal Diseases. New York: Elsevier Science 75–114.
- Sundaram U, Hassanain H, Suntres Z, Yu JG, Cooke HJ, et al. (2003) Rabbit chronic ileitis leads to up-regulation of adenosine A1/A3 gene products, oxidative stress, and immune modulation. BiochemPharmacol 65: 1529-1538.
- Stadnyk AW (2002) Intestinal epithelial cells as a source of inflammatory cytokines and chemokines. Can J Gastroenterol 16: 241-246.
- Sundaram U, Wisel S, Fromkes JJ (1998) Unique mechanism of inhibition of Na+-amino acid cotransport during chronic ileal inflammation. Am J Physiol 275: G483-489.
- Sarau HM, Mong S, Foley JJ, Wu HL, Crooke ST (1987) Identification and characterization of leukotriene D4 receptors and signal transduction processes in rat basophilic leukemia cells. J BiolChem 262: 4034-4041.
- Talukder JR, Kekuda R, Saha P, Sundaram U (2008) Mechanism of leukotriene D4 inhibition of Na-alanine cotransport in intestinal epithelial cells. Am J PhysiolGastrointest Liver Physiol 295: G1-1G6.
- Bradford MM (1976) A rapid and sensitive method for the quantitation of microgram quantities of protein utilizing the principle of protein-dye binding. Anal Biochem 72: 248-254.
- Talukder JR, Boyd B, Griffin A, Jaima A, Rajendran VM (2013) Inflammatory cytokine TNF-α inhibits Na(+)-glutamine cotransport in intestinal epithelial cells. Can J PhysiolPharmacol 91: 275-284.
- Talukder JR, Griffin A, Jaima A, Boyd B, Wright J (2014) Lactoferrin ameliorates Prostaglandin E2-mediated inhibition of Na+-Glucose cotransport in enterocytes. Canadian J of Physiol and Pharmacol 92: 9-20.
- Lostao MP, Hirayama BA, Loo DD, Wright EM (1994) Phenylglucosides and the Na+/glucose cotransporter (SGLT1): analysis of interactions. J MembrBiol 142: 161-170.
- Huang SK, White ES, Wettlaufer SH, Grifka H, Hogaboam CM, et al. (2009) Prostaglandin E(2) induces fibroblast apoptosis by modulating multiple survival pathways. FASEB J 23: 4317-4326.
- Hamet P, Sugimoto H, Umeda F, Franks DJ (1983) Platelets and vascular smooth muscle: abnormalities of phosphodiesterase, aggregation, and cell growth in experimental and human diabetes. Metabolism 32: 124-130.
- Pysz MA, Leontieva OV, Bateman NW, Uronis JM, Curry KJ, et al. (2009) PKCalpha tumor suppression in the intestine is associated with transcriptional and translational inhibition of cyclin D1. Exp Cell Res 315: 1415-1428.
- Black AR, Black JD (2013) Protein kinase C signaling and cell cycle regulation. Front Immunol 3: 423.
- Ansari HR, Teng B, Nadeem A, Roush KP, Martin KH, et al. (2009) A(1) adenosine receptor-mediated PKC and p42/p44 MAPK signaling in mouse coronary artery smooth muscle cells. Am J Physiol Heart CircPhysiol 297: H1032-1039.
- Li W, Zhang J, Flechner L, Hyun T, Yam A, Franke TF, et al. (1999) Protein kinase C-alpha overexpression stimulates Akt activity and suppresses apoptosis induced by interleukin 3 withdrawal. Oncogene 18: 6564-72.
- Frohman LA, Kineman RD (2002) Growth hormone-releasing hormone and pituitary development, hyperplasia and tumorigenesis. Trends EndocrinolMetab 13: 299-303.
- Abramovitch R, Tavor E, Jacob-Hirsch J, Zeira E, Amariglio N, et al. (2004) A pivotal role of cyclic AMP-responsive element binding protein in tumor progression. Cancer Res 64: 1338-1346.
- Dumaz N, Hayward R, Martin J, Ogilvie L, Hedley D, et al. (2006) In melanoma, RAS mutations are accompanied by switching signaling from BRAF to CRAF and disrupted cyclic AMP signaling. Cancer Res 66: 9483-9491.
- Grönroos E, Andersson T, Schippert A, Zheng L, Sjölander A (1996) Leukotriene D4-induced mobilization of intracellular Ca2+ in epithelial cells is critically dependent on activation of the small GTP-binding protein Rho. Biochem Journal 316: 239-245.
- Thodeti CK, Sjölander A (2002) Leukotriene D4-induced calcium signaling in human intestinal epithelial cells. AdvExp Med Biol 507: 187-191.
- Liu WS, Heckman CA (1998) The sevenfold way of PKC regulation. Cell Signal 10: 529-542.
- Dempsey EC, Newton AC, Mochly-Rosen D, Fields AP, Reyland ME, et al. (2000) Protein kinase C isozymes and the regulation of diverse cell responses. Am J Physiol Lung Cell MolPhysiol 279: L429-438.
- Webb BL, Hirst SJ, Giembycz MA (2000) Protein kinase C isoenzymes: a review of their structure, regulation and role in regulating airways smooth muscle tone and mitogenesis. Br J Pharmacol 130: 1433-1452.
- Michie AM, Nakagawa R (2005) The link between PKCalpha regulation and cellular transformation. ImmunolLett 96: 155-162.
- Rigor DL, Bodyak N, Bae S, Choi JH, Zhang L, et al. (2009) Phosphoinositide 3-kinase Akt signaling pathway interacts with protein kinase Cbeta2 in the regulation of physiologic developmental hypertrophy and heart function. Am J Physiol Heart CircPhysiol 296: H566-572.
Relevant Topics
- Constipation
- Digestive Enzymes
- Endoscopy
- Epigastric Pain
- Gall Bladder
- Gastric Cancer
- Gastrointestinal Bleeding
- Gastrointestinal Hormones
- Gastrointestinal Infections
- Gastrointestinal Inflammation
- Gastrointestinal Pathology
- Gastrointestinal Pharmacology
- Gastrointestinal Radiology
- Gastrointestinal Surgery
- Gastrointestinal Tuberculosis
- GIST Sarcoma
- Intestinal Blockage
- Pancreas
- Salivary Glands
- Stomach Bloating
- Stomach Cramps
- Stomach Disorders
- Stomach Ulcer
Recommended Journals
Article Tools
Article Usage
- Total views: 11344
- [From(publication date):
December-2015 - Aug 29, 2025] - Breakdown by view type
- HTML page views : 10361
- PDF downloads : 983
