Life Cycle Assessment of the Environmental Impact of Biosurfactant Production from Oil Waste by a Diculture of Azotobacter vinelandii and Pseudomonas sp.
Received: 23-Feb-2018 / Accepted Date: 16-Mar-2018 / Published Date: 19-Mar-2018 DOI: 10.4172/2155-6199.1000435
Abstract
This study is aimed at carrying out a life cycle assessment of the environmental impact of biosurfactant production from oily waste by a diculture of Azotobacter vinelandii and Pseudomonassp. The methodology used was the life cycle assessment according to the ISO 14-040 standard. The microorganisms used in the study were also isolated from the environment. The biosurfactant produced were quantified and the CO2 and NH3 that were produced were quantified also. The life cycle assessment as a gate – to – gate assessment was considered in this study. Two impact categories were selected for their relevance (global warming, and acidification/eutrophication potentials). The functional unit used for the impact analysis was based on the production of 1000 Kg of biosurfactant. The result showed that during the bioprocess of the biosurfactant production (by the diculture), the volume of CO2 evolved was 28.23 ± 5.08 cm3, which is equivalent to 0.056 ± 0.01 g CO2 per 100 ml of broth. In terms of g CO2/1000 Kg biosurfactant, 4545 ± 817.93 g CO2 were Produced in this bioprocess. The life cycle impact assessment of biosurfactant production by this consortium, based on global warming potential was 0.046 tonnes/ 1000 Kg biosurfactant. Other impact values calculated for acidification and eutrophication potentials were 0.008 tonnes/1000 Kg and 0.0014 tonnes/1000 Kg of biosurfactant. In this work also, the consortium produced 1.22 ± 0.04 mg biosurfactant per 100 ml of cell – free broth. However, the individual organisms Pseudomonassp. and Azotobacter vinelandii produced 1.03 ± 0.02 and 0.08 ± 0.001 mg of biosurfactants per 100 ml cell-free broth respectively. These values when compared with the individual organisms shows that using a consortium for the Bioprocess is more sustainable.
Keywords: LCA; Global warming potential; Acidification; Eutrophication potentials
Introduction
Crude oil exploration and exploitation activities have resulted in inadvertent oil spill incidences. In Nigeria, increase in oil spill has been reported due to sabotage by the host communities in the Niger Delta region. Hence crude oil waste abounds in the Niger Delta areas of Nigeria. Oil wastes generated in the oil industries can be channeled into various biotechnologically tools. Environmental research is often technology dependent with new advances in thinking. Biotechnological conversion of the petroleum oily wastes into biosurfactant by a consortium of Azotobacter vinelandii and Pseudomonassp is a welcome idea. In this work, we evaluated the environmental impact of biosurfactant production from oily waste by this consortium. The use of biosurfactants has gained ground due to the following advantages it possesses over the chemical surfactant. These include its biodegradability [1], low toxicity and availability of raw materials [2]. Biosurfactants also have some wide range of application in food and cosmetics industries and enhanced oil recovery and in bioremediation of the polluted ecosystem [3]. Due to these applications and demand, there is an increase in the use of microorganism in the production of biosurfactants.
The use microorganism in the production process of biosurfactants complies with the 12 principles of green chemistry. The principles include;
1. Prevention, 2. Atom Economy, 3. Less Hazardous Chemical Syntheses 4. Designing Safer Chemicals, 5. Safer Solvents and Auxiliaries, 6. Design for Energy Efficiency, 7. Use of Renewable Feedstocks, 8. Reduce Derivatives, 9. Catalysis, 10. Design for Degradation 11. Real-time analysis of Pollution Prevention and 12. Inherently Safer Chemistry for Accident Prevention [4,5].
Surfactants are amphiphillic molecules that accumulate at interfaces, decrease interfacial tensions and form aggregate structures such as micelles [6]. They normally possess both hydrophilic and hydrophobic moieties which confer the ability to accumulate in the oil and water interface. Biosurfactants on the other hand, are a structurally diverse group of surface-active substances produced by microorganisms. All biosurfactants are amphiphiles. They consist of two parts—a polar (hydrophilic) moiety and non-polar (hydrophobic) group that enables them to interact with the hydrophobic phase as well as the hydrophilic phase [7]. A hydrophilic group consists of mono-, oligo- or polysaccharides, peptides or proteins and a hydrophobic moiety usually contains saturated, unsaturated and hydroxylated fatty acids or fatty alcohols [8]. They are known to have surfactant activities which make them an interesting group of materials for application in many areas such as agriculture, pharmaceutical, cosmetic industries, waste utilization, and environmental pollution control such as degradation of hydrocarbons present in soil.
Biosurfactant are classified based on the nature of their polar groups. They are categorized mainly by their chemical structure and their microbial origin. In general, their structure which includes a hydrophilic moiety consisting of amino acids or peptides anions or cations; mono-, di-, or polysaccharides; and a hydrophobic moiety consisting of unsaturated, saturated, or hydroxylated fatty acids. The major classes of biosurfactants include glycolipids, lipopeptides and lipoproteins, phospholipids and fatty acids, polymeric surfactants, and particulate surfactants [9].
Biosurfactants have unique functional properties which drew much attention towards their use and applications. They have a broad range of functional properties. Most important is their environmental acceptability, because they are readily biodegradable and have lower toxicity than synthetic surfactants. The unique properties of biosurfactants allow their use and possible replacement of chemically synthesized surfactants in a great number of industrial operations. Moreover, they are ecologically safe and can be applied in bioremediation and wastewater treatment [10]. Some of the potential applications of biosurfactants include microbially-enhanced oil recovery, hydrocarbon degradation in soil environment and hexachlorocyclohexane degradation, and removal of heavy-metal from contaminated soil and hydrocarbons in aquatic environments [11].
Some microorganisms have the ability to utilize crude oil as a carbon source for biomass formation and energy. During this fermentation process, carbon iv oxide is produced and other processes in the product life cycle of the biosurfactant production have some environmental implications. To this end, it is necessary to assess the life cycle assessment of the production of biosurfactant in a view to find the areas of environmental hotspot. In this study, therefore, the environmental impact of producing biosurfactant from the consortium of Azotobacter vinelandii and Pseudomonassp. was evaluated using Life Cycle Assessment (LCA) tools which is an analytical tool for the systematic evaluation of the environmental aspects of a product or service system through all stages of its life cycle. It is a methodological framework for determining and assessing the environmental impacts attributable to the life cycle of a product, such as climate change, stratospheric ozone depletion, eutrophication, acidification, toxicological stress on human health and ecosystems, the depletion of resources, water use, land use, and noise and others [12]. According to the Society for Environmental Toxicology and Chemistry (SETAC), LCA is defined as the: Process to evaluate the environmental burdens associated with a product, process or activity by identifying and quantifying energy and materials used and wastes released to the environment; to assess the impact of those energy and material uses and releases to the environment; and to identify and evaluate opportunities to affect environmental improvements [13]. Therefore, Life cycle assessment is a tool for assessing the environmental impacts of a product or product system over its entire life cycle. In a life cycle assessment (LCA), the different phases of a product’s life cycle, like extraction of natural resources/raw material, production and manufacturing, distribution, use, maintenance, end-of-life treatment, recycling and final disposal, are included [14]. In this assessment, a Gate – to – Gate Life Cycle Assessment was considered.
Life cycle assessment (LCA) is necessary when assessing environmental impacts, in order to get the most precise idea of the environmental impact connected to a product or service delivered from a system [15]. By using LCA, issues of problem shifting can be revealed [15]. The problem shifting can be used in two ways: In the process of solving an environmental problem, the problem might either be shifted to another stage in the value chain or create a new environmental problem. This makes it crucial to have a consistent system description with clearly stated system boundaries. According to ISO 14040 [14]. Conducting LCA can be broken down into four main steps (Goal and scope definition, Inventory analysis, Impact assessment and Interpretation) as presented in the Figure 1.

Figure 1: The main steps of conducting an LCA [14].
LCA Methodology
Goal and scope definition
The goal and scope definition is the first thing that needs to be defined when conducting an LCA [16,17]. The goal of an LCA states the intended application, the reasons for carrying out the study and the intended audience for the assessment [14]. The goal and scope of this study is to determine the environmental implication of producing biosurfactant using Azotobacter vinelandii and Pseudomonassp to determine which organism produces a more environmental impact. This study does not cover the whole product life cycle (cradle – to – grave) assessment, but rather, it covers a gate – to – gate assessment, where the assessment starts at some point in the technosphere but do not get to the end of life stage (disposal). The data generated will be used not just for academic purposes, but also for a comparism between other available data on biosurfactant. The processes with environmental hotspot will be identified while the type of impact will be identified and calculated.
Functional unit and reference flow
An important part of the scope process is to decide the functional unit (FU) which provide a comparison basis. The functional unit describes the kind of function or service a product system delivers [18]. The primary purpose of a functional unit is to provide a reference to which the inputs and outputs are related [19]. The functional unit is a quantitative description of the service performance of the investigated product system [12]. Therefore, all of the environmental impact results from the LCA will be quantified relative to the functional unit, so the functional unit itself also has to be quantifiable. This makes it possible to compare results with other similar LCA studies with the same functional unit. The functional unit provides a reference to which the inputs and outputs are related [20]. This reference is necessary to ensure comparability of LCA results assessed on a common basis. Functional unit assesses the function performed by a product and indicates how much of this function is considered [21]. To be consistent with the surfactant manufacture processes, the functional unit of both surfactants manufactures was defined as the environmental performance per 1000 kg or per tonne of final biosurfactant. For example, the functional unit of CO2 emission for this biosurfactant production is kg CO2/1000 kg Biosurfactant or tonne CO2/tonne Biosurfactant (t CO2/t Biosurfactant).
Assumptions and limitations: Since the full-scale manufacturing of the biosurfactant is still under development, a scaled-up production and application process will be proposed with a series of assumptions. To collect data for life cycle inventory, these assumptions provides important prerequisites to carry out calculations and estimations of the process data. Therefore, the LCA undertaken on the biosurfactant production process model is “from gate to gate” or partial rather than “from cradle to grave”
System boundaries
The system boundaries of a life cycle assessment study are defined by the inputs of raw materials, outputs of products and by-products, energy- and material flows that are involved in the process. System boundaries determine which processes are included (or excluded) in an LCA. Consequently, it is important to carefully consider where to draw the line between what should be included in the life cycle and what is insignificant for a given study [22-24]. Generally, system boundaries of LCA include the processes of raw material acquisition, manufacturing, use/reuse/maintenance, and recycle/disposal combined with the inputs and outputs related to the individual process (i.e., Raw materials, energy, emissions, wastes and releases). Disregarding the raw materials acquisition, energy extraction, product delivery, or application, the system boundary was restricted on the currently available simulated large-scale manufacturing process model.
It focused on the primary unit processes of manufacture and the proposed recycle utility of chloroform/ethanol, as shown below. In this system boundary, the gate-to-gate LCA analysis resources were inputs (raw materials and consumed energy) and outputs (emissions in air, water or solid wastes) associated with each life cycle stage of the manufacturing process (Figure 2).

Figure 2: Assessment Boundary of LCA on Biosurfactant.
Life cycle inventory
Upon completion of identifying the scope of the LCA, the next step is to conduct a life cycle inventory analysis (LCI), covering the data collection and calculation procedures [25]. Inventory analysis aims to quantify the inputs and outputs that cross the system boundary. The result of an inventory is a long list of material and energy requirements, products and co-products as well as waste and releases into air, soil and water. This list is referred to as the mass and energy balance or the inventory (Table 1) [26].
| Item | Quantity |
|---|---|
| Water | 1000 ml |
| Crude oil | 50 ml |
| MgSO4.7H2O | 0.2 g |
| NaCl | 0.1 g |
| (NH4)2SO4 | 0.1 g |
| FeCl3 | 0.02 g |
| Pseudomonas | 0.5 × 10⁷ cell/ml |
| Chloroform | 660 ml |
| Methanol | 330 ml |
| Azotobacter vinelandii | 0.5 × 10⁷ cell/ml |
| Sodium Benzoate | 1.0 g |
| K2HPO4 | 0. 5 g |
| Mannitol | 0.5 g |
| Ethanol | 1.0 ml |
Table 1: Raw material for biosurfactant production in the laboratory scale and functional unit.
Procedures for data collection: To establish a life cycle inventory, the first phase is to survey and collect the life cycle data related to the product system, from inputs to outputs. In this case, the data collection was conducted on the entire Biosurfactant production process, as follows:
• Identify the inputs and outputs for each individual unit process for the industrial scale simulation of Biosurfactant production;
• Undertake mass and energy balance for the entire process;
• Quantify the amount of product, waste, material source and energy consumption;
• Convert the industrial scale data to the baseline of selected functional unit (mass per 1000 kg or tonne Biosurfactant).
Biosurfactant production model and process assumptions: Biosurfactants are produced as exogenous materials by microorganisms. During the breakdown of crude oil by organisms such as Pseudomonas , the produce exopolymeric substances that will help them to solubilize the crude oil. Therefore, in a media contain crude oil, these organisms can secrete surfactants which are harvested and used to improve remediation processes. There are also other uses of biosurfactant other than remediation. This process can be scaled up by using some software such as Super Pro Designer. The software is capable of handling material and energy balances, equipment sizing and costing, economic evaluation, environmental impact assessment, process scheduling and debottlenecking of batch and continuous processes [27].
Life cycle impact assessment (LCIA)
Life cycle impact assessment (LCIA) is a phase where the results of the inventory are interpreted in terms of their impacts on the environment. LCIA provides the basis for analyzing the potential contributions of the resource extractions and waste/emissions in an inventory to a number of potential impacts. Raw material requirement is the sum of the net quantities (kg or tonne) of each raw material used within the process - subtraction between materials flowed in and out of the system:

Energy requirement is the sum of electricity consumption (the primary energy source based on the simulated process), which is converted to the energy requirement:

Pollution potentials include
a) Global warming potential is a relative parameter which uses CO2 as a reference. The global warming potential of a given substance is defined as the extent to which a mass unit of the substance can absorb infrared radiation compared with a mass unit of CO2. In this way atmospheric emissions can be converted to CO2 emissions with an equivalent greenhouse effect:

 [28]
[28]
For example, a process has 2.4 tonnes CO2 emissions and 1.5 tonnes CH4 emissions. The GWP factor for CO2 and CH4 is 1 tonne/tonne and 4 tonne/tonne, respectively. Thus, the GWP for this process=2.4 × 1+1.5 × 4=8.4 tonnes.
b) Nullification made by various forms of intervention in the environment can be determined by weighting with NP factors which are a measure of the capacity to form biomass, compared with phosphate Emissions to the atmosphere, water or soil (tonnes) is converted, using the NPi to an equivalent phosphate emissions (tonnes) in terms of eutrophication:

For example, a process has 1.5 tonnes NH3 emissions to the air. The NP factor for NH3 (air or water) is 0.33 tonne/tonne. Thus, the NP for this process=1.5 × 0.33=0.495 tonnes.
c) Acidification potential (AP) is the result of the release of nitrogen and sulfur oxides into the atmosphere, on soil and water that can vary the acidity in soil and water, with influences on both plants and fauna. It is measured with a reference to the effect of 1 kg SO2.
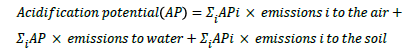
For example, a process has 1.5 tonnes NH3 emissions to the air and 0.8 tonnes NH3 emissions to the water. The AP factor for NH3 (air) and NH3 (water) is both 1.88 tonne/tonne. Thus, the AP for this process=(1.5+0.8) × 1.88=4.324 tonnes.
Life cycle interpretation
Life cycle interpretation occurs at every stage in an LCA. If two product alternatives are compared and one alternative shows higher consumption of each material and of energy and other impact indicators, an interpretation purely based on the LCIA can be conclusive [29]. In interpretation, a practitioner needs to analyze results, reach conclusions, explain the limitations and provide recommendations in accordance with the findings of previous phases of LCA, and to report the LCA results.
Statistical Analysis
The analysis of variance was used to analysis the results using the statistical package for social science (SPSS v21). The result of the experiment will be presented as mean ± standard deviation, while the significant differences in mean will be determined at p ≤ 0.05.
Results
Studies of the microbial growth
The result in Figure 3 above shows that the Pseudomonassp has grown faster than the Azotobacter vinelandii . It also shows that the Pseudomonassp has a lower generation time than the Azotobacter vinelandii . It reveals that the Pseudomonassp attained maximum growth at about 12 hours while the Azotobacter vinelandii took about 60 hours to attain maximum growth.

Figure 3: Time-Growth curve of Azotobacter vinelandii and Pseudomonassp. in their different basal media using glucose as a carbon source.
Figure 4 reveals that Pseudomonassp. and a consortium of Pseudomonassp and Azotobacter vinelandii grow better in crude oil media when compared with the Azotobacter vinelandii. It also showed that the generation of time of the Pseudomonassp. was lower than that of the consortium. While Azotobacter vinelandii did not show much growth in the media using crude oil as a carbon source.

Figure 4: Time - Growth curve of Azotobacter vinelandii and Pseudomonassp. in their different basal media using crude oil as a carbon source.
Isolation of biosurfactants
Table 2 shows that the consortium of the organisms produced the highest amount of Biosurfactant (1.22 ± 0.03 mg/100 ml of cell free broth) when compared with the Pseudomonassp. and the Azotobacter vinelandii while the amount produced by the Azotobacter vinelandii (0.08 ± 0.02 mg/100 ml of cell free broth) was found to be the lowest of them all.
| Organism | Amount of Biosurfactants Produced (mg/100 ml) of cell free broth |
|---|---|
| Pseudomonas sp. | 1.03 ± 0.03 |
| A. vinelandii | 0.08 ± 0.02 |
| A consortium (Pseudomonas sp. and A. vinelandii) | 1.22 ± 0.03 |
Table 2: Quantification of the Biosurfactants Produced by the organisms.
Life cycle analysis
Determination of global warming potential (GWP) during the production of Biosurfactant.
The environmental impact of the biosurfactants was assessed by determining the global warming potential (GWP).
Table 3 reveal the global warming potential (GWP) for the production of 1000 Kg of Biosurfactant. Pseudomonassp. gave a global warming potential of 4.576 ± 0.825 tonnes/000 Kg of biosurfactant, Azotobacter vinelandii alone gave 8.757 ± 1.555 tonnes/1000 Kg of biosurfactant and the consortium of both organisms gave 4.545 ± 0.817 tonnes/1000 Kg of biosurfactant produced.
| Ps Media | Az Media | Ps+Az Media | |
|---|---|---|---|
| CO2 Released (cm3) | 24.00 ± 4.33 | 3.56 ± 0.63 | 28.23 ± 5.08 |
| Amount of CO2 (g) released | 0.047 ± 0.009 | 0.007 ± 0.001 | 0.056 ± 0.01 |
| CO2(g)/1000 Kg of Biosurfactant | 4576.98 ± 825.13 | 8757.44 ± 555.06 | 4545.76 ± 817.93 |
| Global warming potential (GWP) (tonnes/1000 kg of Biosurfactant | 4.576 ± 0.825 | 8.757 ± 0.555 | 4.545 ± 0.8173 |
Table 3: The amount of CO2 emission given by producing 1000 Kg of Biosurfactant.
Determination of acidification potential (AP) during the production of biosurfactant
The environmental impact of the biosurfactants was assessed by determining the acidification potential (AP)
The result in Table 4 showed the environmental impact of the biosurfactants assessed by determining the Acidification potential (AP). The AP showed that Azotobacter vinelandii produced the highest GWP while the consortium produced the least.
| Ps Media | Az Media | Ps+Az Media | |
|---|---|---|---|
| NH3 Released (mg/100 cm3) | 0.402 ± 0.09 | 0.521 ± 0.01 | 0.496 ± 0.02 |
| NH3(Kg)/1000 Kg of Biosurfactant | 0.39 ± 0.01 | 6.50 ± 0.01 | 0.41 ± 0.01 |
| Acidification potential (AP) (tonnes/1000 kg of Biosurfactant | 0.733 | 12.22 | 0.771 |
Table 4: the amount of emission given by producing 1000 Kg of Biosurfactant.
Electric Energy input during the production of biosurfactant
Table 5 showed that a total of 9.1875 KJ of Electric energy was used to produce 1.22 mg of Biosurfactant. Therefore, to produce 1000 Kg of Biosurfactant, a total of 7.531 GJ of Electricity will be consumed.
| Equipment | Rating (W) | Time of used (hr) | Energy used (KJ) |
|---|---|---|---|
| Autoclave | 750 | 0.25 | 0.1875 |
| Waterbath | 750 | 2 | 1.500 |
| Refrigerator | 250 | 24 | 6.000 |
| Centrifuge | 250 | 2 | 0.500 |
| Oven | 500 | 2 | 1.000 |
| Total | 2500 | 30.25 | 9.1875 |
Table 5: Electric Energy consumption during the biosurfactant production.
Total Emissions to the environment during the biosurfactant production process
Table 6 showed the emissions to the environment which was calculated with the understanding that the Power transmission efficiency is at about 33%. Therefore the actual energy produced from natural gas will be 22.593 GJ. The result showed that about 1265 Kg CO2 will be introduced into the environment when 1.22 g of Biosurfactant is produced from the consortium.
| EPA Emission factors of burning natural gas | Output to Nature |
|---|---|
| 56 Kg CO2/GJ | 1265.208 Kg CO2 |
| 44 g NOx/GJ | 994.092 g NOx |
| 19 g CO/GJ | 429.267 g CO |
| 4 g PM/GJ | 90.372 g PM |
Table 6: Evaluation of Output to the environment from burning of Natural gas. Keys: CO2=Carbon (IV) oxide; NOx=Nitrogen oxides; CO=Carbon (II) oxide; PM=Particulate Matter.
Discussion
The effect of crude oil pollution in Nigeria and its effect on the environment has been a major concern to the environmental scientist and the government at large. Methods of remediating polluted sites have been reviewed by many authors and the results have shown some level of successes. Out of the various methods of remediation, bioremediation has been proven to be the best method of remediation due to its environmentally friendliness and sustainability. One the microbial products used in the remediation of the environment is the Biosurfactant (a surface active compound). Biosurfactants on their own do not remove oily waste from the environment, but they have the potentials to lower the surface tension of these oily wastes (i.e., Emulsifying the oil) and to make them available for the indigenous organisms to degrade.
The result of the microbial growth using basal media for the organisms was determined and the result showed that the Pseudomonassp grows faster when compared to the A. vinelandii . This is because A. vinelandii prefers mannose as carbon source and increase in biomass more than glucose probably that was why Mannose was used in the specific isolation of A. vinelandii . Also in the presence of high concentration of oxygen in the air, A. vinelandii uses more energy for protecting the enzyme (nitrogenase) and consequently produces a lower cell yield. It tends to consume more oxygen at the surface, thereby protecting the nitrogenase from inactivation by Oxygen. It can also increase the activities that may uncoupled respiratory electron transport system. In this process, the A. vinelandii uses the glucose more often to produce ATP and CO2 instead of channeling it to biomass production. The ATP, thus produced is then channeled into nitrogenase protection. Thereby the growth of Azotobacter in the presence of oxygen is reduced. Pseudomonas on the other hand, uses oxygen and glucose. Though from the same genus as Azotobacter , Pseudomonas show no intolerance to glucose or oxygen. In using an in vivo expression technology (IVET), Redierset et al. screened a nitrogen-fixing Pseudomonas stutzeri strain for genes specifically expressed in rice rhizosphere. Sequence analysis of these genes revealed high sequence similarity not only to genes of several other Pseudomonas strains but also to A. vinelandii genes. These observations and the availability of a genome sequence of A. vinelandii and several Pseudomonasspecies shows the phylogenetic relationship of A. vinelandii to Pseudomonas sensustricto . In practice, Pseudomonas can be used to create an anaerobic environment due to its ability to consume a lot of oxygen. Pseudomonassp use glucose for ATP production and also for biomass production.
The growth of the A. vinelandii , Pseudomonassp. and a consortium of A. vinelandii and Pseudomonasspecies were determined in a mineral medium using crude oil as the sole carbon source. The result revealed that crude oil did not really support the growth of Azotobacter as the growth was very minimal when compared with the growth of Pseudomonas and a consortium of Pseudomonas and Azotobacter vinelandii (Figure 4). From the result, Pseudomonassp was able to achieve maximum growth within 24 hours while the consortium was able to reach a maximum growth after about 48 hours. The exponential growth rate of the Pseudomonassp. were found to higher with lower doubling time when compared with the Azotobacter vinelandii and the consortium. Some of the factors that can affect the generation time, which directly or indirectly affects generation include; environmental factors, availability of nutrient, temperature, pH and the size of the organism. From this result, one could suggest that crude oil is not a preferred nutrient source for A. vinelandii . But the Pseudomonassp. grew well in the broth using the crude oil as a carbon source. After 24 hours, there was a decline in the microbial growth even when the crude oil has not been exhausted, suggesting that the crude oil being a mixture of organic and inorganic compounds containing some components which cannot easily be degraded by the organism. Some other reason could be that the Pseudomonassp. has depleted some of the limiting nutrients such as nitrogen and phosphorus. In the consortium (A. vinelandii and Pseudomonassp.), the microbial growth stained log phase of the microbial growth till about 48 hours suggesting that the interactions between the organisms which favor both organism.
The life cycle tools were used to access the environmental impact of producing 1000 Kg of biosurfactants. The Carbon iv oxide (CO2) produced by the organisms was used as a marker to determine the Global Warming Potential (GWP) of the production process. The result in Table 3 showed that Pseudomonassp. produced 4576.9 ± 825.13 g of CO2 during the production of 1000 Kg of biosurfactants. This amount to the GWP of 4.576 ± 0.83 tons per 1000 Kg of biosurfactant. The Azotobacter vinelandii and the consortium gave 8.757 ± 1.568 and 4.545 ± 0.82 tons per 1000 Kg of biosurfactants respectively. The GWP follows this other Azotobacter vinelandii >Pseudomonassp.>Azotobacter vinelandii and Pseudomonassp.
Table 4 also showed the Acidification Potential (AP) of producing biosurfactant. The process of producing biosurfactant from Azotobacter vinelandii gave a high AP (12.22 tonnes/1000 Kg) of biosurfactant while the consortium gave 0.771 tonnes/1000 Kg of biosurfactant which is highly reduced when compared with Azotobacter .
The environment hotspot zone in the production of biosurfactant was assessed by determining the energy input in the form of electric energy use. In Table 5 the result showed that 9.1875 KJ of energy was consumed to produce 1.22 g of biosurfactant. Therefore, to produce 1000 Kg of biosurfactant, a total of 7.531 GJ of electricity will be consumed. According to the US power Agency, the national grid that supply electric energy from the combustion of natural gas is 33% efficient. In other words, total energy the plant need to supply is about 22.593 GJ of energy. According to the EPA, there are emission factors associated with burning of natural gas. The conversion factor show that 1265.21 KgCO2, 994.09 g NOx, 429.27 g CO and 90.37 g of particulate matter (PM) will be produced (Table 6). Using this LCA information, it will be noted that the transmission of power produced the highest environmental impact.
Conclusion
The LCA shows that the process of producing biosurfactant did not show much impact on the environment. But the major environment hotspot was on the supply of power from natural gas. One would suggest that the purpose of producing the surfactant should be considered. If the purpose is for environmental bioremediation, it will be wise to apply the organisms directly to the soil. Since they can produce exopolymers with surfactant activities and also increase soil fertility. On the other hand, the use of hydroelectric power should be considered when it comes to the production of biosurfactant since the major pollution was coming from the supply of electricity.
References
- El-Sheshtawy HS, Doheim MM (2014) Selection of Pseudomonas aeruginosa for biosurfactant production and studies of its antimicrobial activity. Egyptian Journal of Petroleum 23: 1-6.
- Waghmode S, Kulkarni C, Shukla S, Sursawant P, Velhal C (2014) Low cost production of biosurfactant from different substrates and their comparative study with commercially available chemical surfactant. International Journal of Scientific and Technology Research 3: 146-149.
- Marchant R, Banat IM (2012) Microbial biosurfactants: challenges and opportunities for future exploitation. Trends in Biotechnology 30: 558-565.
- Anastas PT, Warner JC (1998) Green Chemistry: Theory and Practice. Oxford University Press, New York, USA, p: 30.
- Wardencki W, Curylo J, Namieṥnik J (2005) Review: Green Chemistry — Current and Future Issues. Polish Journal of Environmental Studies 14: 389-395.
- Van Hamme JD, Singh A, Ward OP (2006) Physiological aspects Part 1 in a series of papers devoted to surfactants in microbiology and biotechnology. Biotechnology Advances 24: 604-620.
- Matvyeyeva OL, Vasylchenko ОÐ, Aliievа OR (2014) Microbial Biosurfactants Role in Oil Products Biodegradation. International Journal of Environmental Bioremediation and Biodegradation 2: 69-74.
- Lang S (2002) Biological amphiphiles (microbial biosurfactants). Current Opinion in Colloid & Interface Science 7: 12-20.
- Desai JD, Banat IM (1997) Microbial production of surfactants and their commercial potential. Microbiology and Molecular Biology Reviews 61: 47-64.
- Juwarkar AA, Misra RR, Sharma JK (2014) Recent Trends in Bioremediation. Geomicrobiology and Biogeochemistry Soil Biology 39: 81-100.
- Bhatnagar S, Kumari R (2013) Bioremediation: A Sustainable Tool for Environmental Management – A Review. Annual Review and Research in Biology 3: 974-993.
- Rebitzer G, Ekvall T, Frischknecht R, Hunkeler D, Norris G, et al. (2004) Review: Life cycle assessment Part 1: Framework, goal and scope definition, inventory analysis, and applications. Environment International 30: 701-720.
- US EPA (1994) United States Environmental Protection Agency Revision 1 - Mercury in solid or semisolid waste (manual cold-vapor technique). In: SW-846 manual.
- International Organization for Standardization ISO (2006) Environmental labels and declarations type III environmental declarations principles and procedures. European Standard EN ISO 14025.
- Strømman AH (2010) Methodological Essentials of Life Cycle Assessment. Norwegian University of Science and Technology, Trondheim, Norway.
- Dunmade I (2013) The Role of Sustainable Remediation in the Preservation of Biodiversity: Areas of Opportunities. Journal of Biodiversity Management and Forestry 2: 1-2.
- Stefanova M, Tripepi C, Zamagni A, Masoni P (2014) Goal and Scope in Life Cycle Sustainability Analysis: The Case of Hydrogen Production from Biomass. Sustainability 6: 5463-5475.
- Kellens K, Dewulf W, Overcash M, Hauschild M, Duflou J (2012) Methodology for systematic analysis and improvement of manufacturing unit process life-cycle inventory (UPLCI)-COPE! initiative (cooperative effort on process emissions in manufacturing). Part 1: Methodology description, International Journal of Life Cycle Assessment 17: 69-76.
- ISO 14044 (2006) Environmental Management-Life cycle assessment-Requirements and guidelines.
- ISO (1998) Environmental management–Life cycle assessment–Goal and scope definition and inventory analysis.
- Heijungs R, Guine JB, Huppes G, Lankreiier RM, Udo de Haes HA, et al. (1992) Environmental life cycle assessment of products. Guide, NOH report 9266, Leiden, The Netherlands.
- Tillman AM, Ekvall T, Baumann H, Rydberg T (1994) Choice of system boundaries in life cycle assessment. Journal of Cleaner Production 2: 21-29.
- Jacquemin L, Pontalier PY, Sablayrolles C (2012) Life cycle assessment (LCA) applied to the process industry: a review. International Journal of Life Cycle Assessment 17: 1028-1041.
- Roer AG, Korsaeth A, Henriksen TM, Michelsen O, Strømman AH (2012) Review: The influence of system boundaries on life cycle assessment of grain production in central southeast Norway. Agricultural Systems 111: 75-84.
- AS/NZS ISO 14041 (1999) Environmental Management-Life cycle assessment-Goal and scope definition Australia/New Zealand Standards. Standards Australia.
- Miettinen P, Hamalainen RP (1997) How to benefit from decision analysis in environmental life cycle assessment (LCA). European Journal of Operational Research 102: 279-294.
- Harrison RG, Todd PW, Rudge SR, Petrides D (2002) Bioseparations Science and Engineering; Topics in Chemical Engineering. Oxford University Press, London, UK P: 233
- Huang Y, Sun W, Su Q (2014) Environmental Issues for the Chinese Strong Aromatic Liquor Industry: an Assessment for the Brewing System. Environ Model Assess 19: 153-165.
- Sharma S (2011) Life Cycle Assessment of Municipal Solid Waste Management regarding Green House Gas Emission: A Case Study of Östersund Municipality, Sweden. Thesis for the degree of Master of Science in Environmental Engineering, Department of Engineering and Sustainable Development, Mid Sweden University, Östersund, Sweden.
Citation: Aru OO, Ikechukwu NEO (2018) Life Cycle Assessment of the Environmental Impact of Biosurfactant Production from Oil Waste by a Diculture of Azotobacter vinelandii and Pseudomonassp. J Bioremediat Biodegrad 9: 435. DOI: 10.4172/2155-6199.1000435
Copyright: © 2018 Aru OO, et al. This is an open-access article distributed under the terms of the Creative Commons Attribution License, which permits unrestricted use, distribution, and reproduction in any medium, provided the original author and source are credited.
Select your language of interest to view the total content in your interested language
Share This Article
Recommended Journals
Open Access Journals
Article Tools
Article Usage
- Total views: 7083
- [From(publication date): 0-2018 - Aug 01, 2025]
- Breakdown by view type
- HTML page views: 6062
- PDF downloads: 1021