Long-term Temperature and Rainfall Trends over Northeast Brazil and Cape Verde
Received: 30-Jul-2015 / Accepted Date: 28-Aug-2015 / Published Date: 08-Sep-2015 DOI: 10.4172/2157-7617.1000296
Abstract
This study investigates long-term climate trends in Pernambuco, Northeast Brazil (Nordeste), and in the Tropical Atlantic islands of Fernando de Noronha and Cape Verde. The study is based on meteorological station time series and model simulations of present and future climates. Past trends are compared with numerical simulations of present and future climate scenarios for the periods of 1960-2000 and 2010-2050. Both the station data analyses and numerical simulations revealed trends of increasing temperature maxima and diminishing precipitation. While station data analyses showed modest warming in Fernando de Noronha they revealed strong warming and drying trends in Cape Verde similar to the trends detected over the semiarid Nordeste. The water-balance calculations for the study sites showed reduced soil moisture availability and total rainfall in all areas. The observed temperature and precipitation trends are indicative that aridification processes are underway in Pernambuco and Cape Verde. The atmospheric model simulations were consistent with the station data regarding the present warming; the climate change scenarios for 2010-2050 indicated a faster increase of daily temperature maxima over Nordeste compared to that simulated for the recent past.
Keywords: Anthropogenic origin; Global temperature; Meteorological; Rainfall; Temperature
11876Introduction
Climate change scenarios have been published by numerous research centers around the world and were summarized in the Intergovernmental Panel on Climate Change annual reports [1,2]. Such scenarios show coherent positive trends in global temperature and less coherent changes in rainfall patterns; these trends are attributed with great certainty to human activities due to the burning of fossil fuels and deforestation of tropical forests. Recent studies on global warming and food security in Brazil indicate that climate change might affect national food production and extend the areas at risk [3,4]. Studies on the impacts of climate change on the stability of Brazilian biomes revealed that the Caatinga biome of Northeast Brazil (Nordeste) is highly vulnerable to rising global temperatures [5]. The region is on alert because the effects of climate change represent an additional pressure regarding the aridification of anthropogenic origin [6]. In the long term, this factor alone can trigger the replacement of existing biomes by those adapted to drier climates. Such replacements are exemplified in the work of Nobre and Assad [7], Nobre et al. [8] in which savannas replaced forests, Caatinga replaced savannas, and semi-deserts replaced Caatinga, respectively. Marengo et al. [9] showed that the semiarid Nordeste will be more greatly affected by climate change. With the risk of accelerated desertification, the region may become unsuitable for most currently cultivated crops, particularly cassava and maize [10]. To decelerate this process while still offering food alternatives for people and livestock, several researchers have argued that the solution lies in cultures of Caatinga [5]. In the case of semiarid Pernambuco, there is evidence of an increase in short-lived torrential rains [11]. Additionally, a higher frequency of consecutive dry days and heat waves is expected to increase the frequency of dry spells in the region [9]. This process, besides threatening species (plant and animal) and ecosystems, threatens water security of populations, particularly those inhabiting semiarid regions; these people may become climate refugees and may head toward large urban centers. Therefore, more areas will have high climatic risks [12]. Observational studies have documented a decrease in the total annual rainfall over the tropics and an increase in the occurrence of intense precipitation episodes [13,14]. However, the consequences of global warming in the tropics are basically an increase in the temperature, evaporation, and evapotranspiration, with possible impacts on the hydrological cycle and water availability [15]. The climate change scenario in Brazil is similar [9,16]. In terms of climate simulations, the Eta regional atmospheric model has been used to downscale global climate change scenarios in South America [6,10,17]. The model has been modified for long-term decadal integrations and has reproduced the present climate reasonably well when forced by HadCM3 global outputs [18]; the model is able to generate high-resolution downscaled climate change scenarios for future climates [9].
A description of the same regional models and the diverse aspects of their simulated climatology are provided in Chou et al. [18]; Marengo et al. [9] and Solman et al. [19]. The code, including an updated version is available for download at the NCEP website [20]. Marengo et al. [19] described regionalized future climate scenarios (2071-2100) for South America. The scenarios were derived from Eta-CCS, RegCM3 and HadRM3 at a spatial resolution of 50 km and were forced by the outputs of the global atmospheric model HadAM3 for extreme emission scenarios A2 and B2 of IPCC AR4. In the A2 scenario, temperatures increase by 2°C to 4°C and rainfall decreases by 15-20% (2-4 mm/day) in the semiarid Nordeste by the end of the XXI century. In the B2 scenario, the warming is 1-3°C and the rain decreases by 10-15% (1-2 mm/day). Therefore, the aims of this study were to (1) identify temperature and precipitation trends over the Nordeste of Brazil and over the tropical Atlantic islands using station time series and (2) formulate climate change scenarios over the Nordeste using a regional atmospheric model.
Materials And Methods
Station data time series
The station data used in this study are daily time series of rainfall and temperature for 1911 to 2011. Because of the scarcity of continuous historical station data for temperature, time series of varying lengths were used (Table 1). Six locations with data from 1950-1965 to 2010, namely, the Araripina (40.42°S; 7.46°W), Petrolina (40.33°S; 9.08°W), Caruaru (35.92°S; 8.24°W), Vitória de Santo Antão (35.30°S; 8.13°W), and Recife (34.92S; 8.05°W) stations in the State of Pernambuco, Fernando de Noronha Archipelago (32.42°S, 3.85°W), in the western equatorial Atlantic, and the Cape Verde Islands Station (15.11°N, 23.62°W) in the northeastern Tropical Atlantic were used for the temperature analyses. For the rainfall analyses, 33 stations with time series of at least 45 years (within 1960-2004) and 22 stations with 70+ year time series (within 1911-2011) were used to enhance the spatial representativeness of the rainfall trends1 in Pernambuco. Data time series consistency checks were performed at multiple levels. First, each station’s metadata (e.g., thermometer location, sensor changes, and outliers due to digitation errors) were used to determine data gaps and outliers, checked against the original data sheets and manually corrected in the digital database. Then, the systematic data quality tests provided by RClimdex [21] were applied. The package generates 27 indexes to detect climate change, six of which are related to temperature, e.g., the linear trend of a time series by the least squares method, the level of statistical significance of the trend (p value), the coefficient of determination (r2), and the standard error of the estimate. Thus, the tendencies considered as indicative of possible long-term climatic changes were those for which the index showed a linear trend (positive or negative) greater than the standard error of the estimate and statistically significant (i.e., p-value <0.1). In assessing the homogeneity of the data and calculating the index, the methodology of Zhang et al. [22] and Haylock et al. The indices of climate extremes for monitoring and detecting climate change “RClimdex indices” have been used in the fourth IPCC report [1]. All indices for the temperature and rainfall listed in Table 1 were calculated with the RClimdex package, as documented at the Comprehensive R Archive Network website. The validation of climate extreme indices using RClimdex and the projected changes simulated by the CMIP5 models are presented in Sillmann et al. [23] and Sillmann et al. [24].
| Sites | Period | Temperature Trend (°C/decade) | Precipitation Trend (mm/decade) | |||
|---|---|---|---|---|---|---|
| Txx | Txn | Tnx | Tnn | PRCPTOT | ||
| Araripina | 1962 -2011 | 0.72 (*) | 1.82 | -0.40 | 0.05 | -25.4 |
| Caruaru | 1960 -2011 | 0.28 | 0.10 | -0.37 | -0.30 | -03.5 |
| Petrolina | 1965 -2007 | 0.19 | 0.39 | 0.13 | 0.12 | -42.0 |
| Vitoria | 1957 -2011 | 0.45 | 0.50 | 0.43 | -0.01 | 07.5 |
| Recife | 1962 -2009 | 0.19 | 0.20 | 0.18 | 0.27 | -44.2 |
Table 1: Trends and average values for the maximum and minimum of the highest temperature, maximum and minimum of the lowest temperature (°C/decade), rainfall trend (mm/decade) and average annual values for several locations. The featured colors (bold, blue, and black) indicate statistical significance of the trend indices: bold (99%), blue (95%), and black (90%). The values without statistical significance are in red.
The time series of 33 stations with 45 years of data were spatially aggregated for Sertão (Araripina, Petrolina), Agreste (Caruaru) and Mata (Recife, Vitória de Santo Antão). Original data were aggregated by normalizing the monthly time series using the long-term means and standard deviations of each series according to the expression:
 (1)
(1)
The equation (1) is Data normalization equation, where i refers to the year of the observation, j refers to each calendar month of the year, P is the monthly rainfall, [P] is the monthly climatology of P, and S is the monthly standard deviation. The variable Z has a normal distribution of probabilities, with a zero mean and a unit standard deviation, providing an average time series from distinct stations. This normalization method has already been used by Back [25]; Jin and Chow [26].
Water balance analysis
The second step was the calculation of the annual water balances [27] at five meteorological stations (Araripina, Petrolina, Caruaru, Vitoria, and Recife) by considering the daily precipitation and temperature data over 40 years. The water-balance monthly output variables are potential evapotranspiration (PET) and water storage in the soil (ARM).
Simulations for the present and future climates
The third methodological step consisted of numerical simulations for the present and future climates using the Eta Regional Atmospheric Model [6,19] nested in two global climate models, HadCM3 and BESM, described below.
Regional scenarios were generated for the Nordeste, with a spatial resolution of 40 km over the entire tropical Atlantic Ocean and the tropical portion of South America. The experiments with the Eta model were used for two atmospheric CO2 concentrations: 380 ppmv (1960 to 2000) and 760 ppmv (2010-2050). Simulations for the present climate (1960-2000 with 380 ppmv) and future scenarios (2010-2050 with 760 ppmv) were conducted using atmospheric lateral boundary conditions from the global climate model HadCM3, as also used in previous [28]. In this study, the simulations with the Brazilian Climate Model (BESM), an ocean-atmosphere-cryosphere-biosphere-coupled global model described in detail in Nobre et al. [29], was used to characterize the present climate over the Nordeste. The results of the simulations with the Eta model nested in BESM were used for the present climate characterization. Future climate scenarios with BESM were also used. The results of the simulations with the BESM 4X present atmospheric CO2 concentration sensitivity experiments (i.e., 1,200 ppm CO2). A future climate scenario for the year 2100 under the CMIP5 Radiative Concentration Pathway 8.5 (RCP 8.5) [30] was contrasted with the control experiment with a fixed CO2 concentration of 374 ppm (representing the current climate).
Results
Table 1 summarizes the results of the trend analysis applied to the historical time series of precipitation and temperature for the available sites. Simple linear regression to estimate linear trends (i.e., the linear slope) present in the time series was used. All results in Table 1 were generated by RClindex software. The statistical significance was tested via a Student t-test. The null hypothesis is that no trend occurs (i.e., the climate is unchanging). The trend analyses were based on trends with a statistical significance greater than or equal to 95% (i.e., p<0.05) and 99% (p<0.01), shown in Table 1 as blue and bold black, respectively. The table shows values corresponding to the maximum (Txx) and minimum (Txn) of the maximum temperatures, and the maximum (Tnx) and minimum (Tnn) of the minimum temperatures. All sites showed positive trends for Txx, particularly in Araripina and Vitória, where the trends reached 0.72 and 0.45°C per decade, respectively. For the case of Txn, all trend values were also positive, with Araripina showing a positive trend of 1.82°C per decade. In the case of minimum temperatures, two of the five stations showed negative trends for Tnx (Araripina and Caruaru), while the remaining three stations showed positive trends. Note that the steep positive Txn and negative Tnx for the site of Araripina, associated with a significant negative trend of precipitation (Table 1), suggest an intense aridification process (with a simultaneous increase in the maximum daytime and decrease in the minimum nighttime temperatures). To a lesser extent, Caruaru also showed the same pattern of an increase in the maximum and decrease in the minimum temperatures. The trend analysis of rainfall showed statistically significant negative values for all stations but Vitória and Caruaru, which showed non-significant trend values. The highest rainfall reductions were detected in Petrolina and Recife, with trend values exceeding -40 mm/decade. The station data trend analyses showed increased maximum temperatures over all stations and decreased rainfall over all stations but Vitória’s. However, the minimum temperature trends showed both positive and negative values. The linear trends for both the maximum and minimum annual mean temperatures for the five temperature sites are shown in Figure 1. While the unabated increase in the maximum temperatures is present at all sites, the highest rates were detected in Araripina, Vitória, and Petrolina at 1.28, 0.83, and 0.42°C/decade, respectively. Two of the sites showed negative minimum temperature trends: Araripina and Caruaru at -0.09°C/decade and -0.08°C/decade, respectively. At all other sites, the minimum temperatures are increasing (Figure 1). As a result, the combination of increasing annual maximum temperatures and decreasing minimum temperatures over the years is suggestive of aridification in both Araripina and Caruaru. To resolve possible differences in the long-term maximum and minimum temperatures each month of the year, trend analyses were performed for each month individually, as shown in Figure 2. Araripina and Caruaru show an increase in the maximum temperature and a reduction in the minimum temperature over the decades, suggesting that aridification processes. The largest maximum temperature trend in Araripina is 1.6°C/decade in June, whereas the minimum temperature decline reaches -0.45°C/ decade in December. In Caruaru, while the minimum temperature decreases throughout the year, the maximum temperature trend is positive during the first half and negative during part of the second half of the year. The decreasing trends of minimum temperature in Caruaru and trends of increased maximum temperature are similar to those in Araripina (Figures 2a and 2e). In Vitoria and Petrolina, there was an increase in both the maximum and minimum temperatures in all months, with a larger maximum temperature trend increase in Vitoria than in Petrolina. In contrast to all other continental stations, Recife showed a larger positive minimum temperature trend than the maximum temperature trend during the station’s dry seasons (August to February). During the wet season (March to July), the maximum temperature trend exceeded the minimum temperature trend. While the temperature tends to be a spatially well-behaved field, the rainfall does not have such a field, particularly over tropical regions where the rainfall is discontinuous in time and space. Considering both rainfall discontinuities and the larger number of rain gauge time series (relative to temperature) with up to 100 years of daily rain data, the spatial sampling of rainfall increased to 22 stations relative to the five stations used for temperature analyses. The station time series were aggregated according to Equation 1 over the areas of Sertão, Agreste, and Mata. Considering the long historical series (100 years), the rainfall trend analyses revealed a positive trend of 11.0 mm/decade, -8.4 mm/decade, and 2.9 mm/decade over Sertão, Agreste, and Mata, respectively. Moreover, the results of the trend analyses of consecutive dry days revealed that Sertão experienced an increase of 7.2 days/ decade, Agreste experienced an increase of 1.4 days/decade and Mata experienced an increase of 1.1 days/decade.
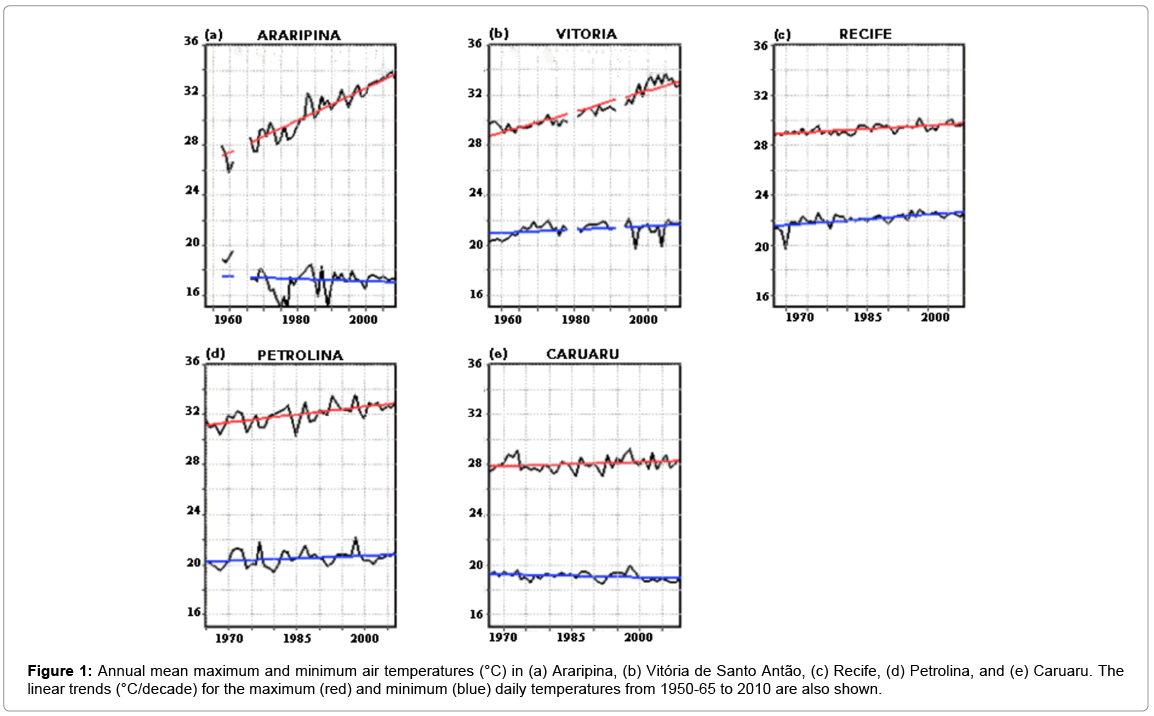
Figure 1: Annual mean maximum and minimum air temperatures (°C) in (a) Araripina, (b) Vitória de Santo Antão, (c) Recife, (d) Petrolina, and (e) Caruaru. The linear trends (°C/decade) for the maximum (red) and minimum (blue) daily temperatures from 1950-65 to 2010 are also shown.
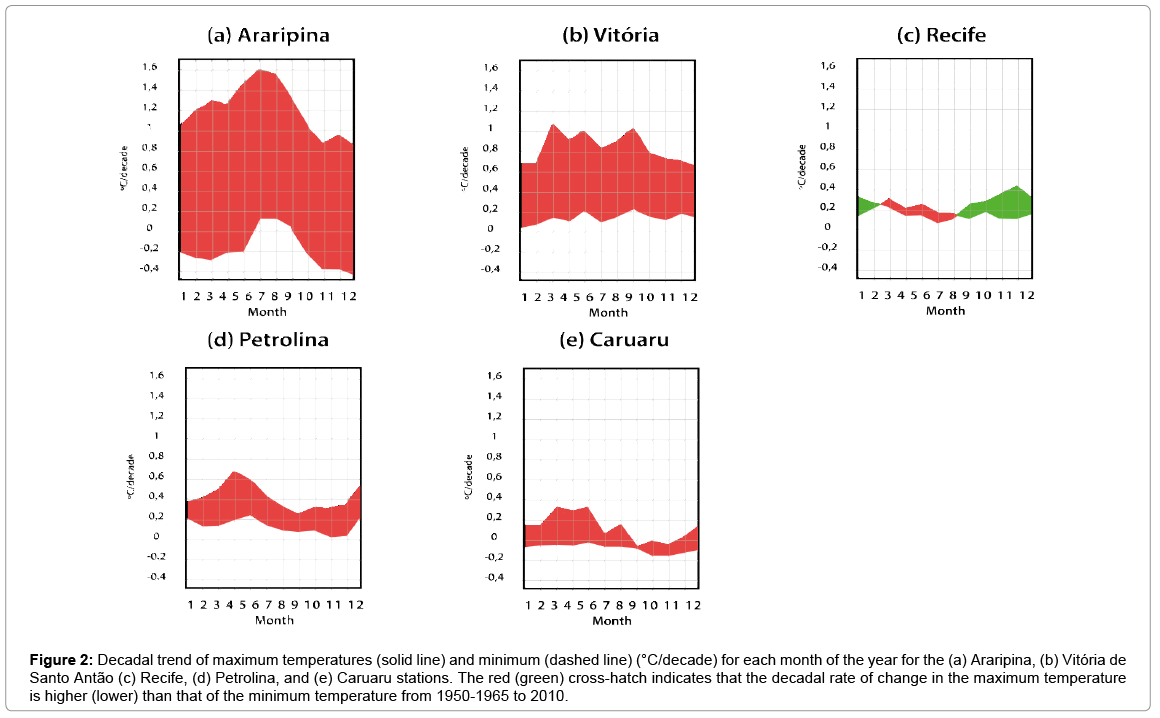
Figure 2: Decadal trend of maximum temperatures (solid line) and minimum (dashed line) (°C/decade) for each month of the year for the (a) Araripina, (b) Vitória de Santo Antão (c) Recife, (d) Petrolina, and (e) Caruaru stations. The red (green) cross-hatch indicates that the decadal rate of change in the maximum temperature is higher (lower) than that of the minimum temperature from 1950-1965 to 2010.
Soil water-balance calculations were based on 40 years of daily time series of precipitation and temperature to PET and water storage in the soil (ARM). Figure 3 shows the decadal trend of the PET for each month of the year at the five meteorological stations. The largest decadal trend of the PET occurred in Araripina (Figure 3a) with values of nearly 15 mm/decade during the dry season (May to August) followed by Vitoria (Figure 3b) at 12 mm/decade during August, which is the last month of the wet season. The remaining stations showed a smaller decadal trend of the PET, with positive values throughout the year over Petrolina and Recife (Figure 3c and 3d). Caruaru (Figure 3e) showed positive trends during the first half of the year and negative trends thereafter. Such negative trends of the PET during part of the year are consistent with the negative trend of both the maximum and minimum surface temperatures observed over Caruaru during the second half of the year, as shown in Figure 2e. Note the doubling of the PET in Araripina over 40 years during August, with 60 mm/month in 1960 and 120 mm/ month in 2010; the same PET occurs in the dry period from October to December. Therefore, the decadal trends of the PET for all stations studied are consistent with the maximum temperature trends in all stations (Figure 2). In Recife, the trend of the increasing rates of PET was nearly invariant throughout the months, equaling approximately 1 mm/decade, and was consistent with the small temperature trends shown in Figure 2c. Figure 4 shows the decadal trends of ARM for each calendar month. In Araripina (Figure 4a), there was a greater tendency for water storage reduction during all months of the year, with the highest reduction rates in February and May at -12 mm/decade and -9 mm/decade, respectively; these values are consistent with the greater tendency for a decrease in the total precipitation (Table 1). In the case of Petrolina (Figure 4d), a positive trend of ARM during January and February was identified at rates of approximately 4 mm/decade, and a negative trend occurred for the rest of the year. The maximum reduction of ARM in Petrolina was detected during December and April at approximately -18 mm/decade. In Caruaru (Figure 4e), trends of ARM are negative during March and April (at -8 mm/decade) and May (-4 mm/decade); in the remaining months, the trend is positive, with the largest trend in August (8 mm/decade). In Vitória (Figure 4b), the trend for each month was predominantly negative, except in March and April. January had the highest negative trend of approximately -8 mm/decade. In Recife (Figure 4c), there were negative trends during May, June, August, and September and positive trends in the remaining months.
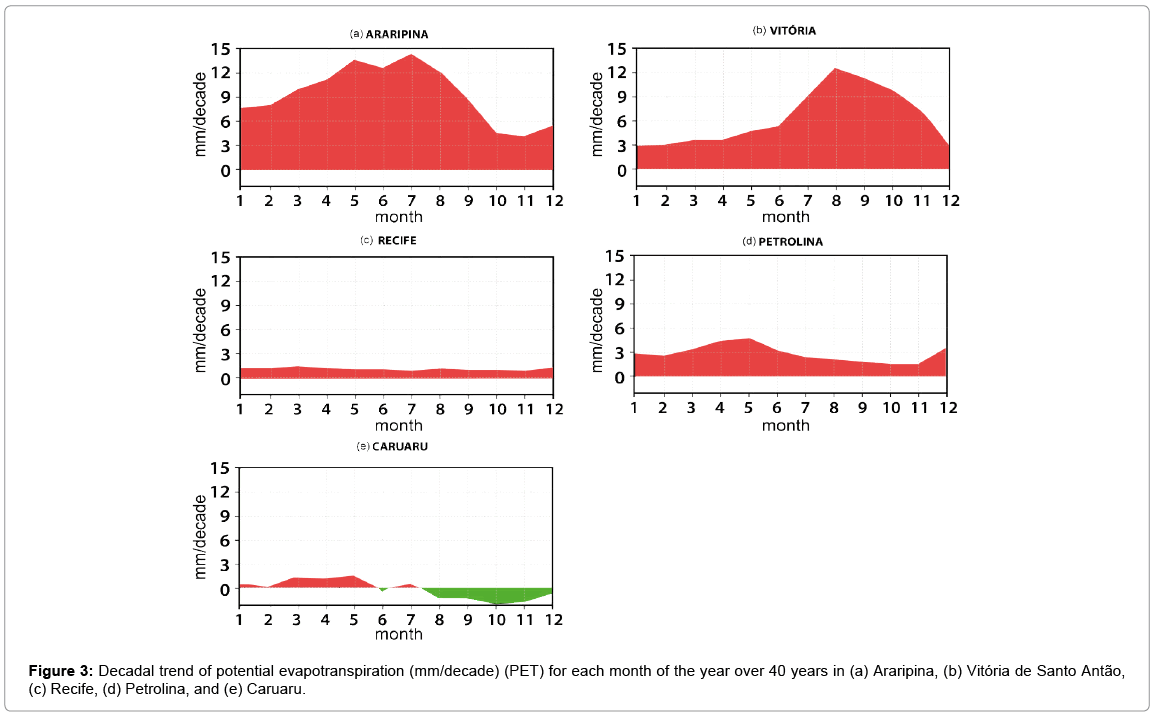
Figure 3: Decadal trend of potential evapotranspiration (mm/decade) (PET) for each month of the year over 40 years in (a) Araripina, (b) Vitória de Santo Antão, (c) Recife, (d) Petrolina, and (e) Caruaru.
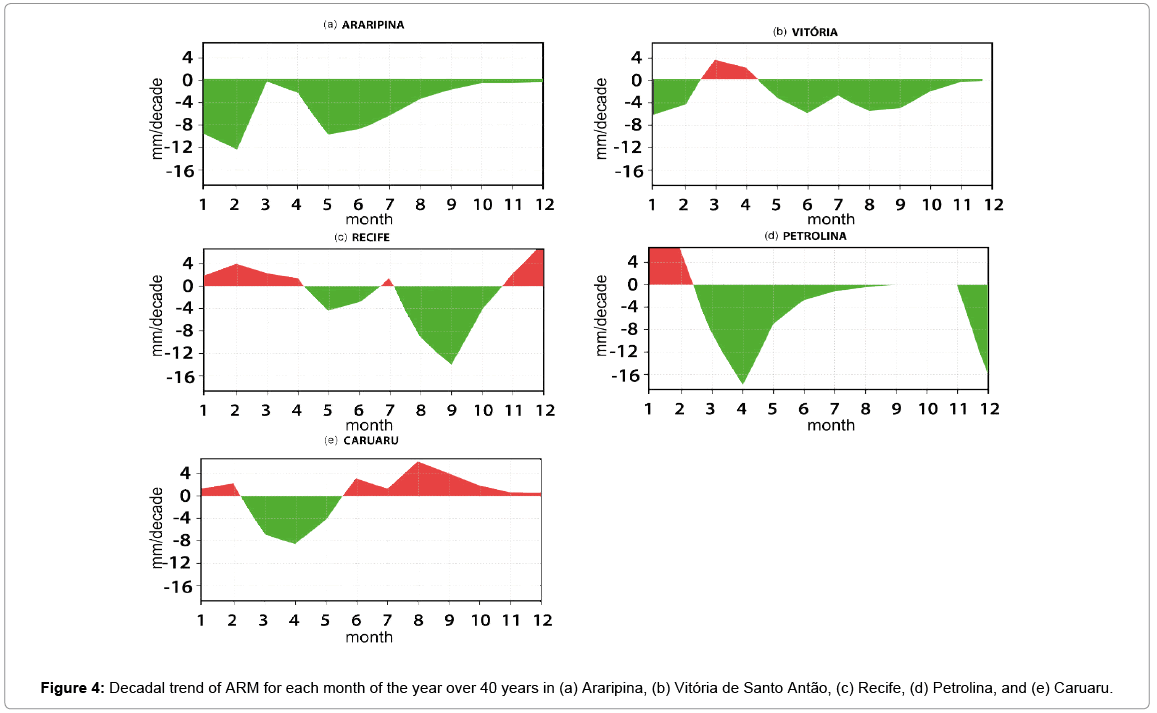
Figure 4: Decadal trend of ARM for each month of the year over 40 years in (a) Araripina, (b) Vitória de Santo Antão, (c) Recife, (d) Petrolina, and (e) Caruaru.
Atlantic ocean islands
The climate regimes over Fernando de Noronha and Cape Verde are similar to that over the semiarid mainland of Nordeste, in which the rainy season is three to four months. High temperatures occur all year and the wind is dominated by the easterlies. On the east side of the Tropical Atlantic, near the Cape Verde Archipelago, the monthly decadal trends of temperature at the Island of Sal (Figure 5b) show positive maximum temperature and negative minimum temperature trends, similarly to that documented in Araripina (Figure 2a) in the semiarid Nordeste. In both Recife and Fernando de Noronha, however, the positive trends of the minimum temperatures were higher than those for the maximum temperature observed throughout the year (Figures 2c and 5a), indicating an increased frequency of warmer nights, which may be a consequence of global warming. The marked differences between the temperature trends in Fernando de Noronha and Cape Verde in the western and eastern Equatorial Atlantic are noteworthy (Figures 5a and 5b). Figure 6 shows the precipitation and temperature trends for Fernando de Noronha and Cape Verde Islands over 1956-2010. Note that the precipitation trends for both islands were negative: -4.0 and -4.7 mm/decade in Cape Verde and Fernando de Noronha, respectively. However, the temperature trends at the islands are different. While both the maximum and minimum temperature trends are positive in Fernando de Noronha (0.12 and 0.13°C/decade, respectively), the temperature trends in Cape Verde are positive for the maximum (0.50°C/decade) but negative for the minimum temperatures (-0.17°C/decade). This finding strongly indicates that Cape Verde is undergoing an aridification process similar to Araripina (Figures 1 and 2).The hypothesis is that such large differences in temperature trends over both Atlantic Island stations are due to the predominantly maritime air masses that reach Fernando de Noronha after crossing the South Atlantic, whereas the air masses that reach Cape Verde have Saharan Desert characteristics. Such evidence is supported by the differences in the stations; dry warm winds reach Cape Verde from the east and moist warm winds reach Fernando de Noronha from the southeast. Thus far, Fernando de Noronha represents an optimal location for the long-term observation of atmospheric conditions that are not directly influenced by human activities or continental air masses. Cape Verde is strongly affected by the continental conditions prevailing over the dry African Sahel upstream of the island.
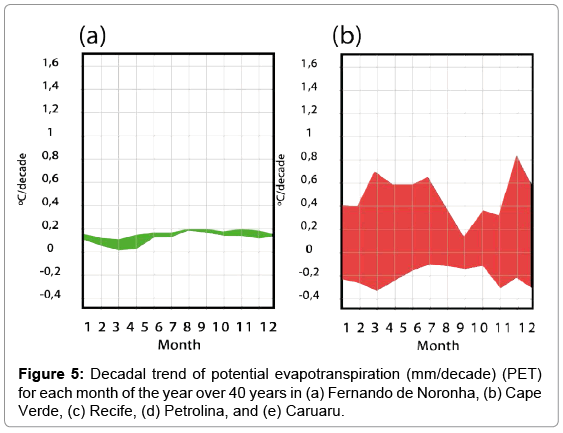
Figure 5: Decadal trend of potential evapotranspiration (mm/decade) (PET) for each month of the year over 40 years in (a) Fernando de Noronha, (b) Cape Verde, (c) Recife, (d) Petrolina, and (e) Caruaru.
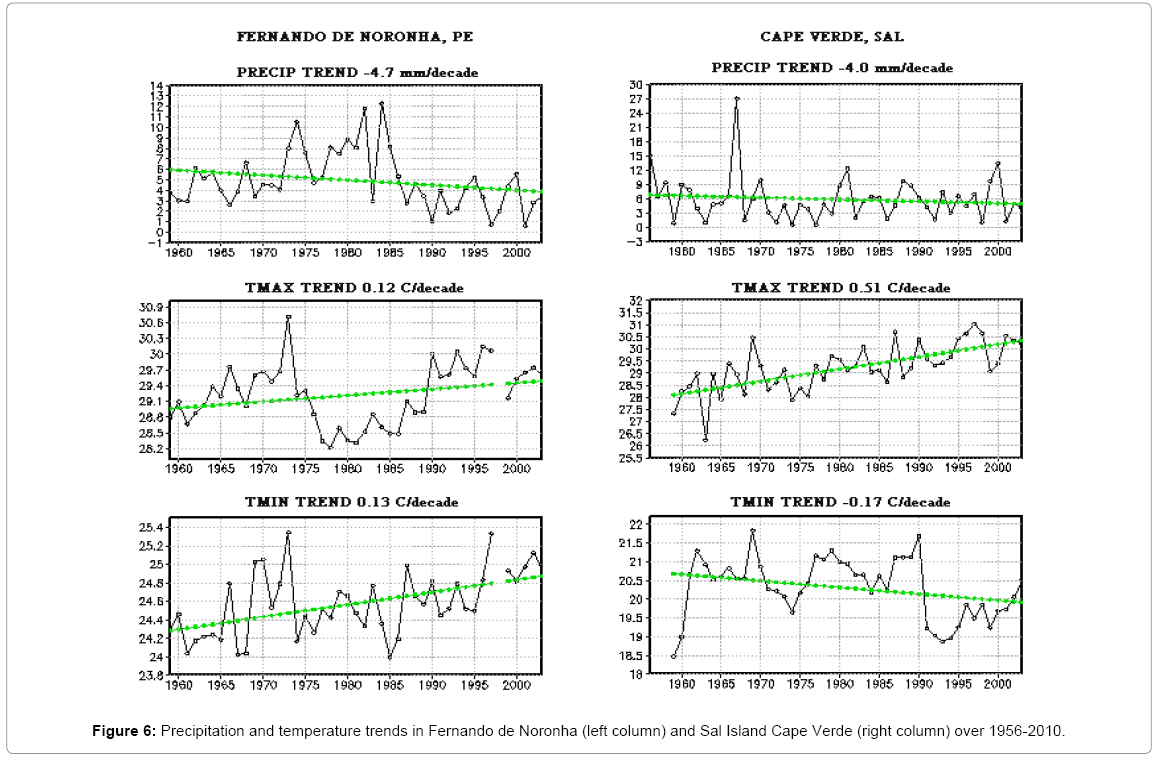
Figure 6: Precipitation and temperature trends in Fernando de Noronha (left column) and Sal Island Cape Verde (right column) over 1956-2010.
Modeling results
This section presents the results of the climate simulations for the present and future climates over the Nordeste. Figure 7 shows the rates of change in the air temperature from National Centers for Environmental Prediction (NCEP) reanalysis data (Figure 7a), the climate simulated by the Eta model nested in the HadCM3 for the present (Figure 7b), the output of the Eta model nested in the BESM for the present (Figure 7c), and the Eta-HadCM3 output for the future climate scenario (2010-2050) (Figure 7d). The similarities among the patterns of the temperature changes over the region are shown in Figure 7, with greater heating of the inland region of the continent; both the reanalysis and Eta simulations are noteworthy. Additionally, the future climate change includes atmospheric warming that is twice as large as the value simulated for the present climate. Comparing the present climate simulation with the reanalysis in Figure 7, the regional model does not capture the rate of warming already detected by the reanalysis, partly because of changes in the land use, which are indirectly assimilated in the reanalysis data but are not represented in the simulations with the regional atmospheric model.
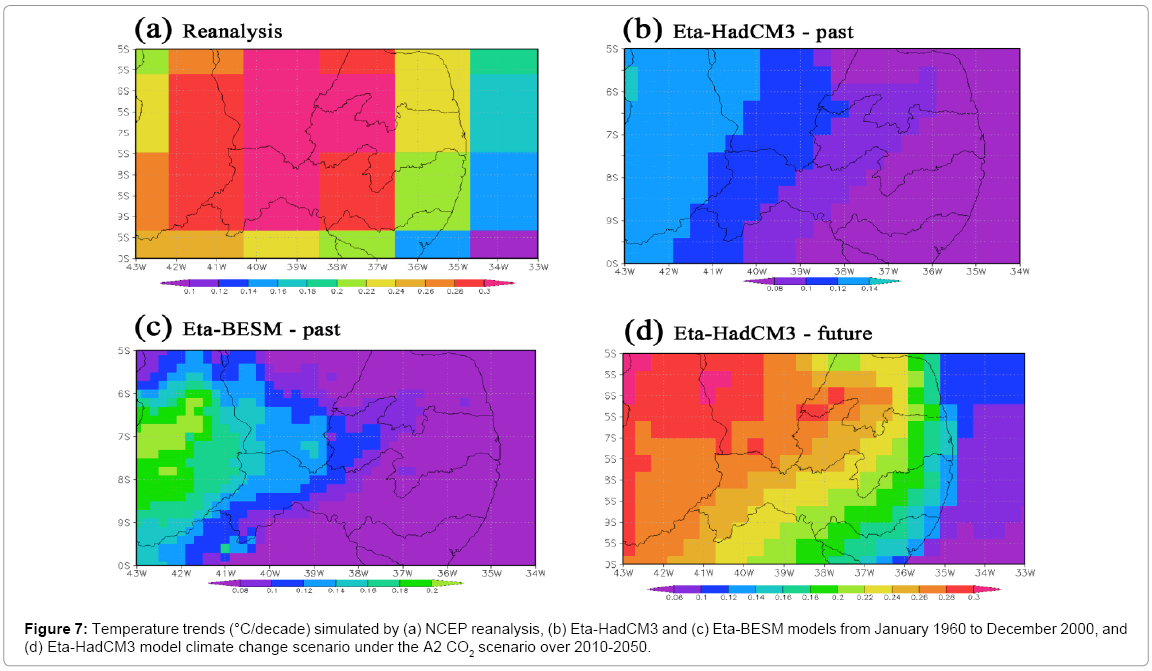
Figure 7: Temperature trends (°C/decade) simulated by (a) NCEP reanalysis, (b) Eta-HadCM3 and (c) Eta-BESM models from January 1960 to December 2000, and (d) Eta-HadCM3 model climate change scenario under the A2 CO2 scenario over 2010-2050.
The differences in the air temperature obtained from the numerical simulations of the regional model for the present and future (Figure 7) are partly due to changes in the fields of lateral forcing from the global model and atmospheric CO2 concentrations of the regional model. There was no change in the vegetation cover for the two climate experiments for the present and future. Thus, it is possible to infer that such differential rates of warming are due to increased atmospheric CO2 concentrations used in both the global and regional models. The results of the trend analysis of the surface temperatures for the reanalysis and simulations with the Eta model considered the average values in the area of 3°S-13°S, 43°W-38°W. Such analyses resulted in a surface temperature trend of 0.207°C/decade for the reanalysis data. The present temperature trend for the Eta simulation is 0.082°C/ decade, which corresponds to approximately 40% of the variation in the temperatures derived from the reanalysis for the same period. The Eta simulation for the future climate (2010-2050) shows a positive trend of 0.196°C/decade. As for the temperature scenarios for 2010- 2050, the model shows a similar pattern to the simulations of the past (1960-2000) but with twice the magnitude. For example, the future scenario for the western side of the state (Figure 7) produces a value of 0.11°C/decade and a future warming of 0.26°C/decade. The trend analysis of the surface air temperature obtained with the Eta-BESM model for 1960-2000 (Figure 7c) shows a positive trend of 0.12°C/ decade in Sertão and 0.06°C/decade over the rest of Pernambuco. These trend values were the result of the model integration with the fixed atmospheric CO2 concentration of 374 ppm, representing the current climate conditions and unchanged vegetation coverage. However, the outputs of the global coupled model BESM revealed air temperature trends of approximately 0.064°C/decade for Sertão (Figure 7c). Note that the air temperature of both Eta-BESM and Eta-HadCM3 for the present climate is a consequence of model drift because neither GHG concentrations nor vegetation coverage change during the current climate simulations. A further result is the contrasting warming trends of the maximum temperature over Fernando de Noronha and the Cape Verde Islands. The former depicts the lowest temperature trend of all stations utilized in this study, while the latter presents a very sharp maximum temperature increase, minimum temperature decrease, and rainfall decrease. These findings clearly show severe aridification that is comparable to that observed over the interior of the semiarid Nordeste station of Araripina (Figure 8).
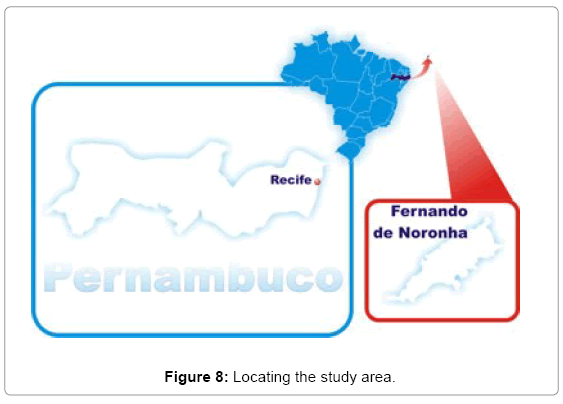
Figure 8: Locating the study area.
Conclusions
The results of the simulations with the regional model (Eta Model) proved to be underestimated in relation to the trend analysis of the temperature and precipitation historical observations series.
The importance with this research was to understand the local effects of the regional climate change. Pernambuco is considered "hotspot" in relation to climate change mainly by its vulnerability to drought and rainfall extreme events. Also research results point out to an intensification of the trends of global climate change revealing the effects of global warming on the location where public policies are implemented to adapt to climate change.
Acknowledgements
The authors acknowledge Dr. André Lyra and Mr. Adriano Santos for their assistance with the Eta model implementation at LAMEPE and Mr. Manoel Baptista Jr. from the coupled ocean-atmosphere modeling group at CPTEC/INPE for his contribution to the data processing. This study was partially funded by MCTI/FINEP grant no. 01.08.0633.00 and the CNPq Grants: Project PIRATA 558142/2009-5 and Project IBAS 490237/2011-8. The authors also acknowledge the support of Rede CLIMA, Fundação de Amparo a Ciência e Tecnologia de Pernambuco (FACEPE), and Instituto Agronômico de Pernambuco (IPA).
1Station data provided by: Laboratório de Meteorologia de Pernambuco (LAMEPE), Instituto Nacional de Meteorologia (INMET), Departamento de Controle Aéreo da Aeronáutica of Fernando de Noronha (DESTAE), and Instituto Nacional de Meteorologia e Geofísica of Cape Verde (INMG).
References
- IPCC (2007) Contribution of Working Group I to the fourth assessment report of the Intergovernmental Panel on Climate Change.
- IPCC (2013) Summary for policymakers. In: Climate change 2013: the physical science basis. Contribution of Working Group I to the Fifth Assessment Report of the Intergovernmental Panel on Climate Change Stocker, TFD Qin, GKPlattner, M Tignor, SK Allen, J Boschung, A Nauels, Y Xia, V Bex and PM Midgley, eds. Cambridge University Press, Cambridge, United Kingdom and New York, NY, USA.
- Assad ED, Pinto HS, Zullo Jr J, Ãvila AMH de (2004) Impacto das Mudanças Climáticas no Zoneamento Agroclimático do Café no Brasil. Pesquisa Agropecuária Brasileira. BrasÃlia 39: 11.
- Assad ED, Pinto HS (2008) Aquecimento global e a nova geografia da produção agrÃcola no Brasil. Embrapa-Cepagri, São Paulo.
- Oyama MD, Nobre CA (2003) A new climate-vegetation equilibrium state for tropical South America. Geophys Res Lett 30: 2199-2203.
- Marengo JA, Ambrizi T, Rocha RP, Alves LM, Cuadra SV, et al. (2010) Future change of climate in South America in the late twenty-?rst century: intercomparison of scenarios from three regional climate models. Climate Dynamics 35: 1089-1113.
- Nobre CA, Assad ED (2005) Aquecimento global e o Impacto na Amazônia e na Agricultura Brasileira INPE eprint: DisponÃvel em.
- Nobre CA, Oyama MD, Oliveira GS, Marengo JA, Salati E (2004) Impacts of climate change scenarios for 2091–2100 on the biomes of South America. Paper Presented at First CLIVAR International Conference, Clim Variation.
- Marengo JA, Chou SC, Kay G, Alves LM, Pesquero JF (2011) Development of regional future climate change scenarios in South America using the Eta CPTEC/HadCM3 climate change projections: climatology and regional analyses for the Amazon, São Francisco and the Parana River basins. Clim Dyn 38: 1829-1848.
- Marengo JA (2009) Vulnerabilidade, Impactos e adaptação as mudança de clima no semiárido do Brasil. In: Estratégicas P, Centro de Gestão de Estudos Estratégicos-Ministério da Ciência e Tecnologia, guest editors,  149-176.
- Lacerda FF, Silva JHD, Assad ED, Assis JMO, Moura MSB (2010) Extremos e Variabilidade Climática no Nordeste Brasileiro e em Pernambuco. Mudanças Climáticas e Impactos Ambientais. (22ndedn), Recife, pp. 1-23.
- Nobre P (2011) Mudanças Climáticas e desertificação: os desafios para o Estado Brasileiro. In: Desertificação e Mudanças Climáticas no Semiárido Brasileiro. Editores: RCC Lima, AMB Cavalcante e AMP Marin, Instituto Nacional do Semiárido - INSA, pp 25-35.
- Trenberth KE, Jones PD, Ambenje P, Bojariu R, Easterling D,et al. (2007) Observations: surface and atmospheric climate change. Climate change 2007: the physical science basis. Contribution of Working Group I to the fourth assessment report of the Intergovernmental Panel on Climate Change S Solomon et al., eds. Cambridge University Press.
- Kharin VV, Zwiers FW, Zhang X, Hegerl GC (2007) Changes in temperature and precipitation extremes in the IPCC ensemble of global coupled model simulations. J Climate 20: 14191444.
- Lau KM, Wu HT (2007) Detecting trends in tropical rainfall characteristics, 1979-2003. Int J Climatol 27: 979-988.
- Marengo J (2007) O quarto relatório do IPCC (IPCC AR4) e projeções de mudança de clima para o Brasil e América do Sul. Boletim da Sociedade Brasileira de Meteorologia 30: 23-28.
- Solman SA, Nuñez MN, Cabré MF (2008) Regional climate change experiments over southern South America. I: present climate. Clim Dyn 30: 533–552.
- Chou SC, Marengo JA, Lyra A, Sueiro G, Pesquero J, et al. (2011) Downscaling of South America present climate driven by 4-member HadCM3 runs. Clim Dyn 38: 635-653.
- Solman SA, Sanchez E, Samuelsson P (2013) Evaluation of an Ensemble of Regional Climate Model Simulations over South America Driven by the ERA-Interim Reanalysis: Model Performance and Uncertainties. Climate Dynamics, 41: 1139-1157
- Zhang X, Yang F (2004) RClimDex (1.0)—user Manual. Downsview, Ontario: Climate Research Branch Environment Canada.
- Zhang X, Hegerl G, Zwiers FW, Kenyon J (2005) Avoiding inhomogeneity in percentile-based indices of temperature extremes. J Climate 18: 1641-1651.
- Sillmann J, Kharin VV, Zwiers FW, Zhang X, Bronaugh D (2013) Climate extremes indices in the CMIP5 multi-model ensemble. Part 1: Model evaluation in the present climate. J Geophys Res 118: 1716-1733.
- Sillmann J, Kharin VV, Zwiers FW, Zhang X, Bronaugh D (2013) Climate extremes indices in the CMIP5 multi-model ensemble. Part 2: Future projections. J Geophys Res 118: 2473-2493.
- Back ÃJ (2001) Aplicação de análise estatÃstica para identificação de tendências climáticas. Pesquisa Agropecuária Brasileira 365: 717-726.
- Jin X, Chow TWS (2013) Anomaly detection of cooling fan and fault classification of induction motor using Mahalanobis–Taguchi system. Expert Systems with Applications 40: 5787–5795.
- McCabe GJ, Markstrom SL (2007) A monthly water-balance model driven by a graphical user interface. U.S. Geological Survey Publication 3:6.
- Chou SC, Bustamante JF, Gomes JL (2005) Evaluation of eta model seasonal precipitation forecasts over South America. Nonlin Processes Geophys 12: 537-555.
- Nobre P, Leo SPS, Roberto AFA, Marta M, Emanuel G et al. (2013) Climate simulation and change in the Brazilian Climate Model. J Climate 26: 6716-6732.
- Taylor KE, Stouffer RJ, Meehl GA (2009) A summary of the CMIP5 experiment design. In: Technical report. Livermore, CA, USA: Program for Climate Model Diagnosis and Intercomparison. Lawrence Livermore National Laboratory.
Citation: Lacerda FF, Nobre P, Sobral MC, Lopes GMB, Chou SC (2015) Longterm Temperature and Rainfall Trends over Northeast Brazil and Cape Verde. J Earth Sci Clim Change. 6: 296. DOI: 10.4172/2157-7617.1000296
Copyright: © 2015 Lacerda FF, et al. This is an open-access article distributed under the terms of the Creative Commons Attribution License, which permits unrestricted use, distribution, and reproduction in any medium, provided the original author and source are credited.
Select your language of interest to view the total content in your interested language
Share This Article
Recommended Journals
Open Access Journals
Article Tools
Article Usage
- Total views: 17325
- [From(publication date): 10-2015 - Aug 19, 2025]
- Breakdown by view type
- HTML page views: 12490
- PDF downloads: 4835