Mechanical Behavior of Recycled Self-Compacting Concrete Reinforced with Polypropylene Fibres
Received: 14-Jun-2017 / Accepted Date: 25-Jun-2017 / Published Date: 31-Jul-2017 DOI: 10.4172/2168-9717.1000207
Abstract
This paper intends to study the possibility of producing fiber recycled self-compacting concrete (FRSCC) using demolitions concrete as a coarse aggregate. Polypropylene fibers (P.P.F) were used in recycled self-compacting concrete (RSCC) with different percentages of coarse recycled concrete aggregate. Nine concrete mixtures were set up to accomplish the objective proposed at this paper. Polypropylene fibers fraction changed from 0% to 0.15% by the volume of concrete and the ratio replacement of recycled coarse aggregate with natural aggregate was 25%, 50%, 75%, and 100%. The fresh properties of (FRSCC) and (RSCC) were assessed utilizing V-funnel, L-box and slump flow tests. Flexural strength, compression strength, and tensile strength tests were performed with a specific end goal to examine mechanical properties. The results indicate that the optimum volume fraction of polypropylene fibers was (0.1%) for the mixes contained recycled coarse aggregate (75%), for optimum content of (P.P.F), the compression strength, flexural strength, and splitting tensile strength; improved by (34%), (14%), and (8.1%), respectively with consideration to control mix. Also the flexural strength and the tensile strength for the mixes were improved with increasing the fibers ratio compared with control mix
Keywords: Self-compacting concrete; Polypropylene fibers; Recycled concrete aggregate; Mechanical properties
77474Introduction
Self-compacting recycled aggregates concrete with fibers (FRSCC) are a good known as an invention in concrete technology, has many advantages over conventional concrete, it is flow under its own weight without compaction effort, segregation resistance [1], and minimized the construction cost by using recycled aggregates (RA), also reduced the plastic and drying shrinkage cracking and preserve concrete durability, with used polypropylene fibers in concrete. Moreover, the use of fibers helps in reducing the permeability of concrete and its tendency to bleed [2]. Recycled aggregates are produced from demolition waste materials, with the largest source being the construction. Properties of the recycled aggregates concrete depend on the quality of the waste material, and also the coarse recycled aggregate comprises of two phases: namely the original virgin aggregate and the adhered mortar, the quantity of adhered mortar influences to a large extent the engineering mechanical and durability properties of the aggregate[3]. Polypropylene fibers (P.P.F.) are one of the most successful commodity fibers reaching a world production capacity of four million tons a year because of its depressed density, high stiffness and excellent chemical/ bacterial resistance [4].
Literature Review
Many studies have dealt with improved Self-compacting concrete (SCC) with recycled aggregates and polypropylene fibers characteristics:
Grdic et al. [5], studied on the potential usage of (RA) obtained from crushed concrete for making of SCC, and additionally emphasizing its ecological value. In their experiment, many kinds of concrete mixes were made, where the percentage of substitution of natural coarse aggregate with recycled aggregate was (0%, 50% and 100%). In the process of mixing, equal consistence of every solid blend was accomplished.
Zhao et al. [6] studied on the effect of coarse aggregate gradation on the properties of SCC. Four SCC mixtures with A/B (size 5-10 mm coarse aggregate weight/size 10-20 mm coarse aggregate weight) ratio 4/6, 5/5, 6/4 and 7/3 were prepared; the bulk density of aggregates with various A/B ratios was investigated. The effectiveness of various types of coarse aggregates on fresh and hardened properties of SCC was investigated.
Pandaa et al. [7] studied the effect of partially replaced of 10%, 20%, 30% and 40% of recycled coarse aggregate (RA) obtained at a demolished Town Club compared the results with normal vibrated concrete. The resultants shown that the flexural and compression and split tensile strengths of (SCC) with 100% natural aggregate is less than the normal vibrated concrete (NVC) with 100% natural aggregate and the strength of SCC decreases with an increase in recycled aggregate (RA) replacement ratios.
Abukhashaba et al. [8] investigated the (SCC) with Polypropylene fiber, (PPF) and containing Cement-Kiln-Dust (CKD) on its stress strain characteristics. Six mixtures with water–binder ratio (w/b) of 0.45 were conducted. The variables were fiber content (0.005, 0.010, and 0.015), and fiber length (20, 40 and 60 mm). It was found that SCC-shrink-age was reduced using (PPF). (PPF) and (CKD) could be successfully used in (SCC) production in spite of its slightly negative effect on workability and a higher dosage of superplasticizer is required to achieve similar flow properties.
Materials
Cement
The cement used for the present work is ordinary Portland cement, from Al-Douh refectory. Test results shown the cement identified with Iraqi specifications ASTM Specf.C150-02a/2002 [9]. The chemical and physical properties of cement shown in the Tables 1 and 2.
| Oxides | percentage | Limit of ASTM Specf.C150-02a/2002 |
|---|---|---|
| CaO | 63.2 | - |
| SiO2 | 18.9 | - |
| Al2O3 | 3.8 | - |
| Fe2O3 | 4.6 | - |
| SO3 | 1.5 | ≤2.3 |
| MgO | 1.7 | ≤6.0 |
| L.O.I | 1.9 | ≤3.0 |
| L.S.F | 0.9 | - |
| I.R. | 0.4 | ≤0.75 |
| C3A | 2.32 | ≤5.0 |
Table 1: Chemical analysis of cement.
| Physical properties | Test results | Limit of ASTM Specf.C150-02a/2002 |
|---|---|---|
| Initial setting time (vicat) | 65 min | 45min (Min) |
| Final setting time (vicat) | 170 min | 375 min (Max) |
| Compressive strength of mortar (MPa) 3-days | 19.0 | 15 (Min) |
| Compressive strength of mortar (MPa) 7-days | 30.5 | 21 (Min) |
Table 2: Physical properties of cement.
Aggregate
Fine aggregate: Sand is used as fine aggregate which is passing through 4.75 mm sieve aggregate and listed in Table 3 and compatible to the requirement specifications of ASTM C33-01 [10]. The physical properties were shown in Table 4.
| Sieve size | Passing ratio (%) | Limit of ASTMC33-01 |
|---|---|---|
| 9.5mm | 100.00 | 100 |
| 4.75mm | 94.56 | 95-100 |
| 2.36mm | 72.45 | 80-100 |
| 1.18mm | 68.40 | 50-85 |
| 600µm | 53.32 | 25-60 |
| 300µm | 16.60 | 5-30 |
| 150µm | 2.12 | 0-10 |
Table 3: Sieve analysis of fine aggregate.
| Tests ASTM C 127 | Natural Coarse Agg | Recycled Coarse Agg | Fine Agg |
|---|---|---|---|
| Specific Gravity | 2.65 | 2.19 | 2.6 |
| Bulk Density, kg/m3 | 1614 | 1356 | 1690 |
| Water Absorption,% | 1.31 | 5.64 | 0.84 |
| Fineness Modulus ASTM C 33 | 6.2 | 5.96 | 2.36 |
Table 4: Physical properties of aggregates.
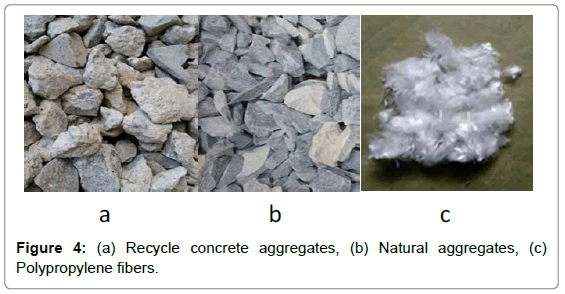
Natural and recycles coarse aggregate: Natural and recycled aggregates were used to prepare the (SCC) mixtures. The natural aggregate (NA) used was crushed stone of maximum size 12.5 mm, also recycles coarse aggregate (RA) of 12.5 mm max. size utilized as a part of the examination was gotten from the demolished cubes tested in concrete technology laboratory of civil engineering department of which were used for casting. The aggregates were separated by crushing the demolished lumps manually and were then cleaned, the properties of aggregates obtained experimentally ASTMC 127 [11] is presented in Table 4 to reduce the amount of adhered mortar, the aggregates were put through a 300 rev abrasion process using a Los Angeles machine (Table 5).
| Sieve size (mm) | Percent Passing | Limit required by ASTMStandardC33-03 |
|---|---|---|
| 19 | 100 | 100 |
| 12.5 | 97 | 90-100 |
| 9.5 | 39 | 40-70 |
| 4.75 | 9 | 0-15 |
| 2.36 | 1 | 0-5 |
Table 5: Grading of natural and recycled coarse aggregates.
Superplasticizer
Superplasticizer (SP) is a chemical compound used to increase the workability without adding more water Superplasticizer is essential for the creation of (SCC). The job of (SP) is to impart a high degree of flow ability and deformability, however the high dosages generally associate with (SCC) can lead to a high degree of segregation. The requirements are of superplasticizer according to ASTM-C494 Type B, D and G [13]. Table 6 shows the typical properties of superplasticizer.
| Properties | Specifications |
|---|---|
| Specific gravity | 1.2 |
| Form | Liquid |
| pH | 7-9 |
Table 6: Typical properties of super plasticizer.
Polypropylene fibers
Table 7 shows the properties of steel fibers used in this work. High execution short (10 mm) polypropylene fiber was used in this investigation. Polypropylene fiber complied with requirements of ASTM C1116-02 [12]. Table 7 shows the physical and technical properties of polypropylene fiber.
| Property | Specification |
|---|---|
| Density | 7900 Kg / m3 |
| Tensile strength | 2850 MPa |
| Diameter | 0.15 mm |
| Length | 12 mm |
| Aspect ratio | 76 |
Table 7: Shown the polypropylene fibers.
Mix Proportions.
Due to the difficulty in determining the real water/cement (W/C) ratio because of the high variation of absorption in the RCA, it was decided to use basic ACI 211.1 [14].
The instruction of ACI 237R-07 [1] was used for mix design to realize self-consolidating concrete. The high absorption of recycled aggregates directly effects on the quality of the SCC concrete in order to control the high absorption of recycled aggregates, and is often uneven, pre-soaking method used for recycled aggregates for a fixed time, generally the time needed to achieve the 80% of the water absorption at 24 h. [15]. The amount of water added depends on the initial water content and effective absorption of (RA) during the mixing period. The (RA) utilized have a lower density and a higher water retention proportion (equivalent to around 6%) than the common coarse totals. except for little varieties in the amount of superplasticizer with the end goal of accomplishing parallel consistency for all the blends and because of marginally higher water absorption by the recycled aggregate. The water/cement ratios were set at 0.5 (Table 8).
| Test No. | Method | Unit | Typical range of values | |
|---|---|---|---|---|
| Min | Max | |||
| 1 | Slump Flow | mm | 650 | 800 |
| 2 | T500Slump Flow | Sec. | 2 | 5 |
| 3 | L-box | (h2/h1) | 0.8 | 1.0 |
| 4 | V-Funnel | Sec | 6 | 12 |
Table 8: Typical ranges of values for different testes for fresh SCC, conformance with FNARC [16].
For the purpose of the experiment, two groups of concrete were made: control concrete – made only with the natural aggregate, the first group of (RSCC) mixes were substituted the natural coarse aggregate by recycled coarse aggregate in the ratio of 25%, 50%, 75%, and 100% by weight, in the second group of (RSCC) the same replacement of (RA) with Polypropylene fibers adding at the percentage of 0.025%, 0.5%, 0.1%, and 0.15% by the volume of SCC to study the combined effect of (RA) and (P.P.F). The quantity of components required for making of (1) m3 of concrete was settled except for little varieties in the amount of water with the end goal of accomplishing the equivalent consistency and because of the somewhat higher water assimilation by the reused total. Structure of composed blends has been appeared in Table 9.
| Mix Design | Cement Content Kg/m3 | Water / Cement Ratio | Fine Aggregates Kg/m3 | Coarse Aggregates Kg/m3 |
S.P.% of Cement | P.P.F% by Vol. | |
|---|---|---|---|---|---|---|---|
| Normal Aggregate | Recycle Aggregates | ||||||
| NC- RC0%-PPF0% | 400 | 0.5 | 860 | 960 | 0.00 | 1.16 | 0.00 |
| RC25%-PPF0.00% | 400 | 0.5 | 860 | 720 | 240 | 1.18 | 0.00 |
| RC50%-PPF0.00% | 400 | 0.5 | 860 | 480 | 480 | 1.9 | 0.00 |
| RC75%-PPF0.00% | 400 | 0.5 | 860 | 240 | 720 | 2.05 | 0.00 |
| RC100%-PPF0.00% | 400 | 0.5 | 860 | 240 | 720 | 2.15 | 0.00 |
| RC25%-PPF0.025% | 400 | 0.5 | 860 | 720 | 240 | 2.23 | 0.025 |
| RC50%-PPF0.050% | 400 | 0.5 | 860 | 480 | 480 | 2.38 | 0.05 |
| RC75%-PPF0.10% | 400 | 0.5 | 860 | 240 | 720 | 2.45 | 0.10 |
| RC100%-PPF0.15% | 400 | 0.5 | 860 | 0.00 | 960 | 2.50 | 0.15 |
Table 9: Mix proportions for (RSCC) and (FRSCC) mixes.
Rheological characteristics of fresh (SCC): Self-compacting concrete is portrayed by its streaming capacity, passing capacity, filling capacity and isolation resistance. For any solid to be portrayed as selfcompacting it ought to have the previously mentioned attributes. In this trial the accompanying test techniques as proposed by EFNARC [16] were utilized. Slump-flow test for flowability, V-funnel and T500 for viscosity and L-box test for testing passing capacity. The segregation resistance was watched outwardly amid droop stream test. Table 3 gives the prescribed esteems by EFNARC [16].
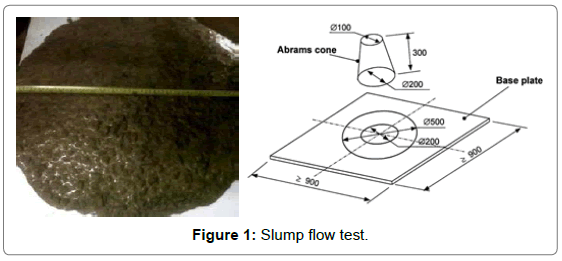
Slump flow test is a measure of mixture filling ability of SCC and provides a procedure to determine the slump flow of self-consolidating concrete in the laboratory or the field, the average diameter of the concrete circle is a measure for the filling ability of the concrete. The time required for the concrete to spread over the 500 mm diameter of circle is measured (that is T500 time), this parameter means that the thickness of concrete and demonstrates how stable the solid Shorter time of T500 indicates the better flow capacity. A lower time points to a greater lowability (Figure 1).
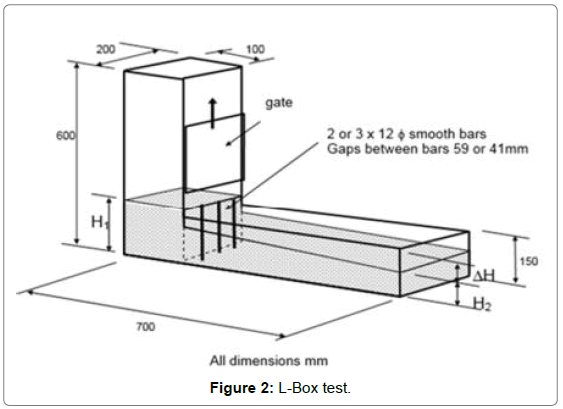
The L-box test is utilized to assess the passing capacity of (SCC) to flow through tight openings including spaces between strengthening bars and other an obstructions without isolation or blocking. There are two varieties of the test, to be specific the two-bar test and the threebar test. The three-bar test, which was additionally utilized with the end goal of the present examination, mimics more congested support. Subsequently, the solid is emptied from the compartment into the filling container of the L-box. At that point the entryway is raised so that the solid flows into the even area of the crate. At the point when the development is stopped, the vertical separations are measured, toward the finish of the flat area of the L-box, between the top layer of the solid and the highest point of the level segment of the case, and at three positions similarly divided over the width of the crate. Varying from the stature of the even segment of the crate, these three estimations are utilized to ascertain the mean profundity of concrete as H2. A similar methodology is taken after to ascertain the profundity of cement quickly behind the door as H1. The estimation of H2/H1 as blocking proportion is then detailed (Figure 2).
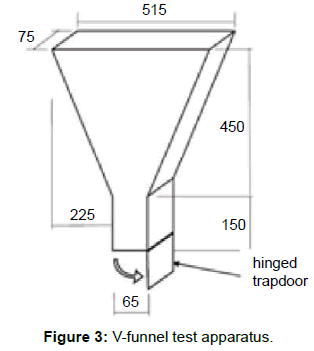
V-funnel test is to determine the viscosity, filling-ability and segregation resistance of fresh concrete. Design of the shape of V-funnel is tend to indicate any blocks on fresh concrete. If composition of concrete consists a lot of coarse aggregate, fresh concrete need longer duration to flow. Sketch of V-funnel tool and test are shown on Figure 3. The funnel is loaded with around 12 liters of cement and the time taken for it to course through the contraption is measured. Further, T 5 min is likewise measured with V-funnel, which shows the inclination for isolation, wherein the funnel can be refilled with concrete and left for 5 minutes to settle. If the concrete shows segregation, the stream time will increment essentially (Figures 3, 4 and Table 8).
Concrete testing: The compression resistance of concrete samples tested for 7 and 28 days of curing period Self-compacting concrete specimens prepared at general according to ASTM C192-88 [17]. For each mix, six (150 mm) standard cubic steel molds used for casting specimens and for Compression strength in (7) and (28) days in agreement with ASTM C39-98 [18], the splitting tensile strength used two molds of 100 × 200 mm cylindrical concrete samples measured conformity to the ASTM C 496-86 [19], two (100 × 100 × 400 mm) prisms for flexural strength at (28) day, correspond with ASTM(C78–02) [20].
Casting and curing of SCC concrete: Coarse aggregate, fine aggregate, and the cement were blended for no less than 1 min in the dry state before the water, and admixtures have been included. The blending time after slurry (water, and SP) was included for (3-4) minutes to guarantee full blending of the (SCC), when a blend wound up plainly flowable, the fibres were physically included (scattered by hand) into the blend to accomplish a uniform dissemination and to stay away from the arrangement of fibres balls. what's more, the concrete throwing in the moldings, after 24 h., the specimens disposed of the molds and maintained in the water until they will arrive the test age of 7 and 28 days when they are ready to do the experimental tests (Table 9).
Resultant and Discussion
Workability
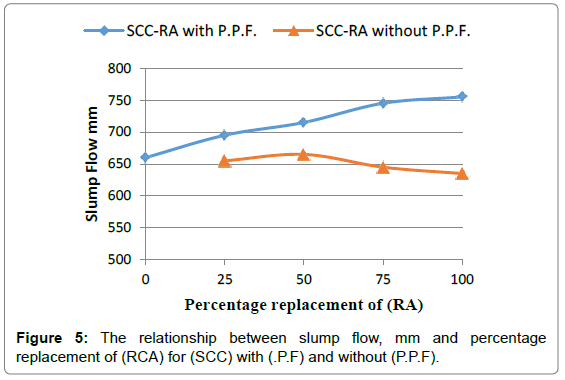
The results of the fresh (RSCC) mixtures with and without (P.P.F.) at group I and II is shown in Tables 5 and Figures 5-7. Generally, the rheological characteristics of fresh SCC reduced with increased the (P.P.F) amount. It can be seen that slump flow value of control concrete mixture with natural aggregate was lower than that for recycled coarse aggregate self-compacted concrete mixtures in group I without (P.P.F.) as shown in Figure 3, this is because of the more water absorption of the (RA) compared to natural aggregates which were utilized at the air dried condition [7]. Also at the group II with P.P.F. the slump flow diameter reduced due to addition of Polypropylene fibers caused a partially blocking effect [21].
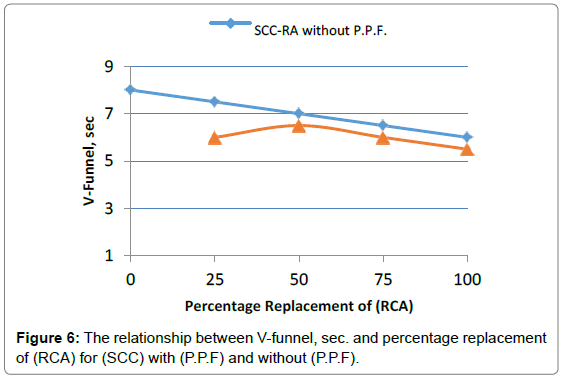
Table 10 represented the viscosity of mixture by T500 slump flow results, all the mixtures recorded the T500 time between 1.82 to 2.18 seconds. According to EFNARC [16] detail V-channel time extending from 6 to 12 seconds is viewed as sufficient. The test aftereffects of V-funnel test for all mixtures at Figure 4 meet the prerequisite of stream time which means that great filling capacity even with congested reinforcement.
| Mix Design | Slump Flow, | T500 slump Flow | V-Funnel | L-Box H2/H1 |
|---|---|---|---|---|
| mm | sec | sec | mm | |
| NC- RC0%-PPF0% | 680 | 2.18 | 6.08 | 0.85 |
| RC25%-PPF0.00% | 695 | 2.01 | 6.18 | 0.88 |
| RC50%-PPF0.00% | 715 | 1.95 | 6.28 | 0.9 |
| RC75%-PPF0.00% | 745 | 1.84 | 6.23 | 0.91 |
| RC100%-PPF0.00% | 755 | 1.82 | 6.01 | 0.93 |
| RC25%-PPF0.025% | 685 | 2.1 | 6.14 | 0.85 |
| RC50%-PPF0.050% | 675 | 2.15 | 6.42 | 0.87 |
| RC75%-PPF0.10% | 670 | 2.02 | 6.22 | 0.88 |
| RC100%-PPF0.15% | 655 | 1.95 | 6.24 | 0.86 |
Table 10: Tests results of fresh (SCC).
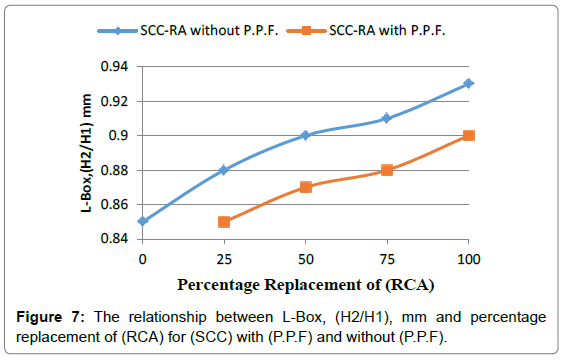
All the blends meet the measure that the apportion of statures of concrete at the finishes of L-box is no under 0.80 as appeared in the Figure 5. L-box proportions for all blends were recorded over 0.87. All the blends demonstrated flat droop stream with no seeping at the fringe which shows great deformability and segregation resistance. At the group II the slump flow diameter reduced due to addition of Polypropylene fibers was registered about 15% due to adding 0.75% (P.P.F.) compared with mixture without (P.P.F.) (Figures 5-7).
Compressive strength
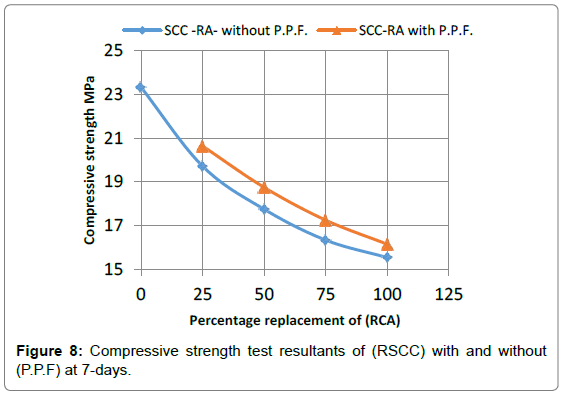
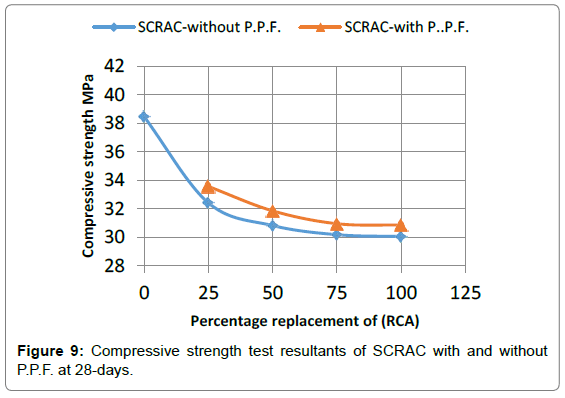
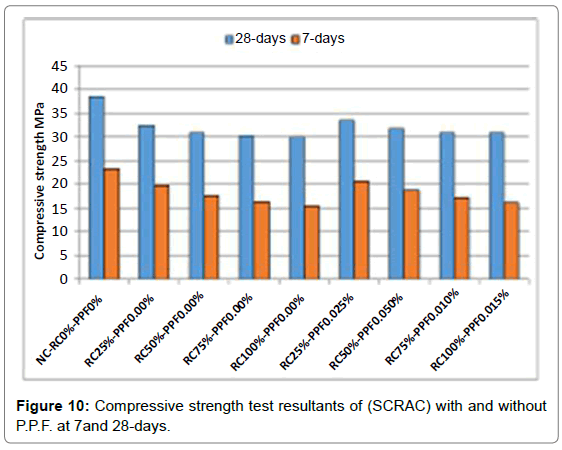
Table 11, Figures 8 and 9 shown that the compressive strength of (RSCC) mixtures decreased with increasing in (RA) replacement ratio in 7 days, and 28 days tests. The compressive strength increases with increase in curing time due to the hydration products [22]. Figure 8 records the compressive resistance acquired from concrete samples at 7 days, compression resistance was appeared to decay with growing in substitution proportion of (RA), this finding is in concurrence with those gotten in past investigations [23-25]. It can be seen that the max. Rate loss of compression resistance was 50.1% with 100% replacement of (RA). The compressive strength increases for all percentages of fibers than (RSCC) without (P.P.F) as shown in Figure 10, the reason is that because of repression given by fiber, holding qualities of concrete increments and henceforth compressive resistance increments with the increments in the fiber content [26]. The optimum addition of polypropylene fibers to the mix at 0.1% with 75% of (RA) raised the (7) day’s compression resistance of the mix by 24%.
| Mix Design | Compression strength MPa 7-days | Compressive strength, MPa 28-days |
|---|---|---|
| NC- RC0%-PPF0% | 23.33 | 38.45 |
| RC25%-PPF0.00% | 19.72 | 32.41 |
| RC50%-PPF0.00% | 17.75 | 30.82 |
| RC75%-PPF0.00% | 16.34 | 30.18 |
| RC100%-PPF0.00% | 15.54 | 30.05 |
| RC25%-PPF0.025% | 19.64 | 31.56 |
| RC50%-PPF0.050% | 18.75 | 31.85 |
| RC75%-PPF0.100% | 20.25 | 34.00 |
| RC100%-PPF0.15% | 16.15 | 30.85 |
Table 11: Average test of compression resistance results of (SCC) samples.
The strength decreasing caused with (RA) was more obvious at 28 days in Figure 9. The use of 25%, 50%, 75% and 100% recycled aggregates caused approximately 18.6%, 24.7%, 27.4% and 28.2% respectively reduction in compressive strength compared to the sample with normal aggregates mixture, adding the (P.P.F) raises the on compressive resistance because of split capturing limit of crossing over fibers, so that adding 0.1% (P.P.F) to the plain self-compacting mixes with nearness of 75% of (RA) expanded surprisingly the compression resistance (about12.7%), contrasted and the (RC75%-PPF0.00%) mix (Figures 8-10).
Splitting tensile strength
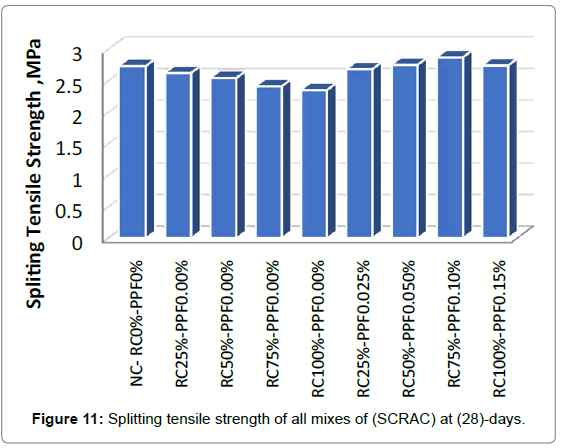
From the test results at Table 12 and Figure 11, it can be concluded that adding (P.P.F) can increase the splitting strength of concrete to different degrees, due to the ability to delay the fine-crack formation and fixing their propagation [27], the splitting strength of (RC25%- PPF0.025%), (RC50%-PPF0.050%), and (RC100%-PPF0.15%) increased 4.3%, 8.4%, 14% and 3.3% respectively, in splitting tensile strength compared with control concrete. Moreover, the optimum increasing in the tensile strength found in the mixture of 0.1% (P.P.F) by volume and 75% of (RAC) was about (5.1%). Thus, mixing fiber can effectively improve the splitting strength of concrete. Figure 11 presented that the tensile strength of concrete large diminished when the proportion of recycled aggregates become greater, as seen in the compression strength, be that as it may, the level of diminishment in the splitting tensile strength was more prominent than in the compressive resistance [15]. For example,, the use of 25%, 50%, 75% and 100% recycled concrete aggregates caused approximately 4.1%, 7.4%, 13.3% and 16.1% a decreases in the tensile strength severally, paralleled to the case with natural aggregates only (NC-RC0%-PPF0%) at 28 days of curing.
| Mix Design | Splitting tensile resistance, MPa 28-days |
Percentage of increase% |
|---|---|---|
| NC- RC0%-PPF0% | 2.73 | ------ |
| RC25%-PPF0.00% | 2.62 | Dec.4.1% |
| RC50%-PPF0.00% | 2.54 | Dec.7.4% |
| RC75%-PPF0.00% | 2.41 | Dec.13.3% |
| RC100%-PPF0.00% | 2.35 | Dec.16.1% |
| RC25%-PPF0.025% | 2.85 | Incre.4.3% |
| RC50%-PPF0.050% | 2.96 | Incre.8.4% |
| RC75%-PPF0.10% | 3.11 | Incre.14% |
| RC100%-PPF0.15% | 2.82 | Incre.3.3% |
Table 12: Average test of splitting tensile resistance resultants of (SRCC) samples.
Resultant of flexural strength
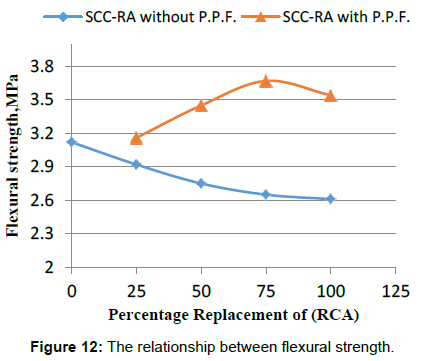
The consequences of flexural resistance tests are exhibited in Table 13 and Figure 12, the flexural resistance of (RSCC) mixtures are reduced with increased with replacement ratio of (RA). For example, the flexural strength with 25%, 50%, 75% and 100% recycled aggregates had 6.8%, 13.5%, 17.7% and 44.4% lower tensile strengths respectively, when compared with control concrete (NC-RC0%-PPF0%) at 28 days of curing.
| Mix Design | Flexural strength,MPa 28-days | Percentage of increase or decrease% |
|---|---|---|
| NC- RC0%-PPF0% | 3.12 | ------ |
| RC25%-PPF0.00% | 2.92 | Dec.6.8% |
| RC50%-PPF0.00% | 2.75 | Dec.13.5% |
| RC75%-PPF0.00% | 2.65 | Dec.17.7% |
| RC100%-PPF0.00% | 2.61 | Dec.44.4% |
| RC25%-PPF0.025% | 3.16 | Incre.1.8% |
| RC50%-PPF0.050% | 3.25 | Incre.4.2% |
| RC75%-PPF0.10% | 3.38 | Incre.8.1% |
| RC100%-PPF0.15% | 3.30 | Incre.5.7% |
Table 13: Average test of Flexural strength results of all specimens.
Figure 12 also shows that the addition of (P.P.F) volume fractions from 0.025% to 0.15% causes the increasing at the flexural strength of (RSCC) with 4.1%, 10.6%, 13.4%, and 46%, successively, with regard to the normal (SCC) specimens (NC-RC0%-PPF0%). Moreover, the highest value of flexural strength can see in the mix of 0.1% of P.P.F and 75% replacement of (RCA) was 3.38 MPa and percentage replacement of (RCA) for (SCC) with (P.P.F) and without (P.P.F).
Conclusion
Pursuant to results of self-compact Concrete with (RA) and (P.P.F), we considered that:
1. The results of the present investigation show that both (RA) and (P.P.F) can be used for (SCC) production.
2. The slump flow and L-Box ratio of the (SRACC) mixtures increased with increasing coarse recycled aggregate content. The slump flows of all the (RSCC) mixtures were from 680 mm to755 mm mixture and the L-Box ratios varied from 0.85 to 0.93.
3. Using (P.P.F) has negative effect in rheology properties of fresh (RSCC) and it reduce workability and increase both consistency and viscosity, the slump flow declined to 655 mm.
4. The compressive strength of (RSCC) mixtures decreases with increase in the amount of (RA), and less than the natural concrete (NC), the compressive strength for the (NC) mix was (38.45) MPa at 28 days, the use of 25%, 50%, 75% and 100% of (RA) as coarse aggregate replacement decreased the compressive strength by 19.4%, 37.5%, 33.33% and 45%, and increased with adding (P.P.F)
5. The flexural strength and split tensile strength of (RSCC) mixtures increased with increases the (P.P.F) ratio compared with NC mixture, the addition (P.P.F) at 0.025%-0.15% was increased the flexural strength 1.8%-5.7% respectively, and become less than the NC with increased in the amount of (RA), for the NC mix the flexural strength and split tensile strength were 3.12, and 2.73 MPa at 28 days, and declining from 6.8% to 44.4% at flexural strength and 4.1%-16.1% for split tensile strength.
6. The results show that, the optimum added proportion of (RA) was (75%) with (0.1%) of (P.P.F.) this proportion increased the compressive strength flexural strength and split tensile strength about (34%), (14%), and (8.1%) respectively, comparison with control mixture.
References
- ACI Committee 237 Self-consolidating oncrete (2007) ACI 237R-07 Farmington Hills American concrete Institute.
- Gencel O, Ozel C, Brostow W, Martinez BG (2011) Mechanical properties of self-compacting concrete reinforced with polypropylene fibres. Materials Research Innovations 15: 3.
- Kou SC, Poon CS (2009) Properties of self-compacting concrete prepared with coarse and fine recycled concrete aggregates. Cement and Concrete Composites 31: 622-627.
- Burkinshawa SM, Froehling PE, Mignanelli M (2002) The effect of hyperbranched polymers on the dyeing of polypropylene fibres. Dyes and Pigments 53: 229-235.
- Grdic ZJ, Troplicic GA, Despotovic IM, Ristic NS (2010) Propertis of self-ompacting concrete prepared with coarse recycled concrete aggregate. Construction and Building Materials 24: 1129-1133.
- Zhao H, Sun W, Wu X, Gao B (2012) The effect of coarse aggregate gradation on the roperties of self-compacting concrete. Materials and Design 40: 109-116.
- Panda KC, Bal PK (2013) Properties of self-compacting concrete using recycled coarse aggregate. Procedia Engineering 51: 159-164.
- Mohamed I, Abukhashaba A, Ostafa MA, Adam IA (2014) Behavior of self-compacting ï¬ber reinforced concrete containing cement kiln dust. Alexandria Engineering Journal 53: 341-354.
- ASTM Specf (2002) C150-02a Standard specification for Portland Cement. Annual Book of ASTM Standards 4: 2.
- ASTM Specf (2001) C33-01 Standard Specification for Aggregates. Annual Book of ASTM Standards pp: 1-8.
- ASTM C127-12 (2012) Standard Test Method for Density, Relative Density (Speciï¬c Gravity), and Absorption of Fine Aggregate, ASTM, West Conshohocken, PA, USA.
- ASTM C1116-02 (2002 Standard Specification for Fiber-Reinforced Concrete and Shotcrete Annual Book of ASTM Standards.
- ASTM-C494 -02 (2002) Standard Specification for Chemical Admixtures for Concrete Annual Book of ASTM Standards.
- ACI 211.1 (1991) Recommended practice for selecting proportions for normal and heavy weight concrete. USA.
- Iris GT, Belén GF, Jua POL, Javier EL (2017) Prediction of self-compacting recycled concrete mechanical properties using vibrated recycled concrete experience. Construction and Building Materials 131 641–654.
- EFNARC (2005) European Federation of national trade associations representing producers and applicators of specialist building products. Specification and Guidelines for self-compacting concrete, Hampshire, UK pp: 1-63.
- ASTM C192-88 (1989) Standard Practice for Making and Curing Concrete Test Specimens in the Laboratory. Annual Book of ASTM Standards 4: 112-118.
- ASTM C 39 (1989) Standard test method for compressive strength of cylindricalconcrete specimens. American Standards for Testing and Materials X
- ASTM C 496 (2011) BStandard test method for splitting tensile strength of cylindrical concrete specimens. American Standards for Testing and Materials.
- ASTM C 78 (2010) Standard test method for flexural strength of concrete (using simple beam with third-point loading). American Standards for Testing and Materials.
- Taheri ARF (2016) Combined Effect of glass fiber and polypropylene fiber on mechanical property of self-compacting concrete. Global Advanced Research Journal of Engineering, Technology and Innovation 5: 57-68.
- Prashant OM, Mohitkar VM (2015) Recycled Aggregate Self Compacting Concrete. International Journal of Modern Trends in Engineering and Research (IJMTER).
- Sami WT, Akmal SA (2009) Influence of recycled concrete aggregates on strength properties of concrete. Construction and Building Materials 23: 1163-1167.
- Kou SC, Poon CS (2009) Properties of self-compacting concrete prepared with coarse and ï¬ne recycled concrete aggregates. Cement & Concrete Composites 31: 622–627.
- Fathi H, Lameie L, Maleki M, Yazdani R (2017) Simultaneous effects of ï¬ber and glass on the mechanical properties of self-compacting concrete. Construction and Building Materials 133: 443-449.
- Gencel OC, Ozel W, Brostow GMB (2011) Mechanical properties of self-compacting concrete reinforced with polypropylene fibers. Materials Research Innovations 15: 217.
Citation: Ibrahm HA (2017) Mechanical Behavior of Recycled Self-Compacting Concrete Reinforced with Polypropylene Fibres. J Archit Eng Tech 6: 207. DOI: 10.4172/2168-9717.1000207
Copyright: © 2017 Ibrahm HA. This is an open-access article distributed under the terms of the Creative Commons Attribution License, which permits unrestricted use, distribution, and reproduction in any medium, provided the original author and source are credited.
Select your language of interest to view the total content in your interested language
Share This Article
Recommended Journals
Open Access Journals
Article Tools
Article Usage
- Total views: 7988
- [From(publication date): 0-2017 - Aug 25, 2025]
- Breakdown by view type
- HTML page views: 6816
- PDF downloads: 1172

