Micro-MRI-based Detection of Tissue Damage in the Liver, Pancreas, and Kidney during the Early Phases of an LPS and D-Galactosamine-Induced Hepatic Injury Model in Mice
Received: 21-Jan-2020 / Accepted Date: 05-Feb-2020 / Published Date: 12-Feb-2020 DOI: 10.4172/2476-2024.1000161
Abstract
How tissue injuries progress among organs during LPS-induced fulminant hepatic failure remains to be elucidated, especially during the very acute phase of small animal models. We have addressed this problem in LPS/D-galactosamine-induced fulminant hepatitis by using sequential micro-MRI scanning. Analysis of T2-weighted MRI signal intensities detected tissue injury in the liver during the early phase (as early as the 3 h timepoint), at which point histological examination revealed only minor morphological changes in hepatic tissues. In the pancreas, increases in the T2-weighted signals were made readily apparent by the pancreatic edema formation that was determined by histological examination. Only minimal pathologies were observed in the renal cortex based on micro-MRI and histological examination. The results of this study have demonstrated the distinct temporal changes that occur in the liver and injured pancreatic acinar cells during the very acute phase of LPS-induced hepatitis.
Keywords: LPS-hepatitis; Pancreatic injury; MRI
Introduction
Micro-magnetic resonance imaging (micro-MRI) represents a noninvasive preclinical imaging technique for the research of small animals. T2-weighted MRI signal intensities measured by micro-MRI, which are sensitive to an increase in the tissue water content associated with inflammation, have been used for studying murine inflammationrelated pathologies and tissue edema formation in the gut [1,2], muscle [3], lung [4], brain [4], liver [5,6], and kidney [7]. A major strength of micro-MRI lies in its capability to study tissue injuries such as edema and congestion in small animals longitudinally. Taking advantages of this strength, here we aim to investigate the acute phase of fulminant hepatitis in mice by micro-MRI.
Fulminant hepatitis is a life-threatening liver failure syndrome characterized by rapidly progressing hepatic inflammation and cellular damage, which is caused by hepatitis viruses as well as toxic chemicals and some prescription drugs [8]. It can also result from sepsis [8]. Fulminant hepatitis is often associated with multiorgan failure (MOF), resulting in severe dysfunctions affecting several organs that can prove lethal [9]. A mouse model of fulminant hepatitis has been developed based on the co-administration of LPS and D-galactosamine (DGalN), which induces an acute liver injury accompanied by MOF [10,11]. While the underlying pathogenic mechanisms that cause LPSand D-GalN-induced liver injury have been extensively studied [12,13], exactly how tissue damage spreads across vital organs during the acute phase remains less well characterized. Investigation of the temporal changes that occur throughout the body is of great importance to understanding the pathogenesis underlying the multiorgan failure caused by fulminant hepatitis. To study the dynamic temporal changes of tissue injury, we have performed sequential MRI scanning of T2-weighted images in order to readily detect any increase in tissue water content, which is associated with the early phases of the disease [14,15]. Simultaneously, we have performed a series of pathohistological analyses during the course of the disease's progression, thereby gaining a better understanding and interpretation of the MRI findings.
In this study, while sequential MRI scanning allowed us to understand the time course of liver injury during the very early phase of LPS- and D-GalN-induced hepatitis, we also investigated concomitant acute pathologic changes in the pancreas and kidney. Here, we have shown the distinct patterns underlying the dynamic temporal changes of MRI T2 signal intensities in the liver, pancreas, and kidney in an LPS- and D-GalN-induced hepatitis mouse model. These results have provided deeper insights into how fulminant hepatitis-induced organ damage can progress in the visceral organs during the very acute phase.
Materials and Methods
Animal model
The protocol for this study was reviewed and approved by the Institutional Animal Care & Use Committee (IACUC) at the Mie University Graduate School of Medicine (28-3-rev1). All animal experiments in this study were carried out in accordance with the Helsinki Convention and in compliance with both the Mie University Animal Experimental Guidelines and the Faculty of Medicine Animal Experimental Guidelines.
Sixteen-week-old male Balb/c mice were purchased from Japan SLC, Inc. (Hamamatsu, Japan) and were used for all experiments. Mice were housed for 6 days under a 12 h light/dark cycle under specific pathogen-free conditions at the Central Animal Facility of Mie University Life Science Research Center. On the day before MRI imaging, mice were transferred and maintained for 1 day under a 12- hour light/dark cycle at the satellite animal facility in the MRI facility building next to the Central Animal Facility for adaptation. During feeding, food and drinking water were freely provided.
Mice were administered with 50 μg of LPS (Sigma, Cat# L 3880) and 20 mg of D-GalN (Sigma Cat # G 0500) via tail vain injection. As a control, a vehicle (i.e., 50 ul saline) was similarly administered.
Micro-magnetic resonance imaging (MRI) measurements
MRI scans were performed with 3 T Preclinical Imaging System™ equipment (MR Solutions Ltd, UK) located at Mie University (Tsu, Japan) using a Fast Spin Echo (FSE) method. The equipment was tuned via calibration of the central frequency, 90 degrees pulse, auto shim, and positioning (scout: slice thickness 1.0 mm, FOV 40 × 40 mm, two averages). The imaging protocol used in this study included a T1- weighted FSE sequence; T2-weighted FSE sequences were used to generate axial (transverse) images. In the T1-weighted protocol, 36 slices with a thickness of 1.2 mm were acquired using a repetition time (TR) of 720 ms, an effective echo time (TE) of 11 ms, and four averages. In the T2-weighted protocol, 36 slices with a thickness of 1.2 mm were acquired using a repetition time (TR) of 5400 ms, an effective echo time (TE) of 68 ms, and three averages. A field of view of 40 × 40 mm was chosen and sampled into a matrix sized to 256 × 256, resulting in a spatial resolution 0.156 mm.
Mice were anaesthetized with 3% isoflurane in an anesthesia induction box, and then laced in an animal bed in a prone position. During imaging, anesthetized mice were monitored for their respiration rate. An isoflurane level of 0.5 to 1.5% was used to maintain the respiration rate at approximately 80 to 100 cycles/min. The imaging schedule was scanned in order of T1-weighted images and then T2-weighted images, and each image set was then acquired. A glass tube (OD, 6 mm; ID, 5 mm; length 100 mm) filled with water was placed beside each mouse and was used as a reference to normalize MR signals.
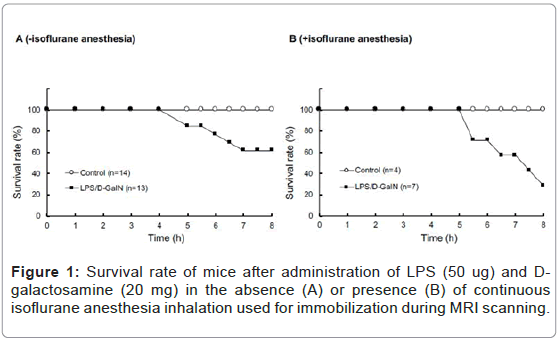
We acquired a series of 10 MRI scans every 30 to 60 min after administering LPS and D-GalN. In order to maintain, as much as possible, the same scanning positions, mice were kept anesthetized via isoflurane inhalation and immobilized throughout the MRI scanning procedures. Consistent with previous reports [10,11], LPS (50 μg) and D-GalN (20 mg) treatment of awake mice resulted in severe hepatic damage and abdominal inflammation, resulting in a ~ 60% survival at 8 h (Figure 1A). By contrast, mice similarly treated with LPS/D-GalN under constant anesthesia with 0.5 to 1.0% isoflurane inhalation showed severe hepatic damage and abdominal inflammation. Thus, their 8 h survival rate measured ~ 30% (Figure 1B). All mice given the same 8 h anesthesia treatment without LPS/D-GalN were still living. Thus, although continuous isoflurane anesthesia was obligatory for immobilization and stabilization during sequential MRI scanning in this study, it hastened mortality. This was possibly due to the general effects of anesthesia, which can cause vasodilatation and hypotension, as discussed in greater detail in the Discussion section. Considering that the survival rate of LPS/D-GalN-mice at 480 min was ~ 30%, we focused our MRI analysis only on the 300-min period after the injection of LPS/D-GalN, up to which time point all mice were still living. This experimental setting allowed us to investigate the very acute phase of LPS/D-GalN-induced fulminant hepatic injury, as well as any concomitant pathologies present in the pancreas and the kidney.
The acquired image data were exported to DICOM format and analyzed using Osirix software (Osirix Imaging software, Pixmeo, Geneva, Switzerland) as previously described [16]. The T1- and T2- weighted images were used as a guide for each other in order not only to clearly observe the anatomical structures, but also to determine the region of interest (ROI) for the parenchyma part, as previously described by Miquel et al. [16]. ROI analysis was performed using circular ROIs (area 3.0 or 1.0 mm2 for the liver; 1.0 or 0.46 mm2 for the renal cortex; 0.32 or 0.14 mm2 for the pancreas). Six ROIs per slice were placed in both the liver and pancreas. Four and two slices were used for analyzing MRI signal intensities in the liver and pancreas, respectively. The signal intensities of mouse organs were normalized with those of the water-containing glass tubes.
Histopathological analysis
To conduct histopathological analysis, 4 additional cohorts of mice were prepared, each containing 3 mice treated with LPS/D-GalN and 3 mice treated with vehicle; all were subjected to MRI scanning under isoflurane anesthesia. The cohorts were sacrificed at 3, 4, 5, or 8 hours after administration of LPS/D-GalN or vehicle. Then, the liver, pancreas and kidney were harvested and fixed with 10% neutral buffered formalin for 24 hours, and embedded in paraffin. Using a microtome, a series of 2-μm thick sections was made from the paraffinembedded tissue blocks. The sections were placed on poly-L-lysinecoated glass slides, and stained with hematoxylin eosin (HE). Histopathological evaluation of the HE-stained tissue sections was performed by an independent pathologist (MY). Histological changes in liver inflammation and congestion were graded on a 5-degree severity scale based on the current literature [17]. Results for kidney and pancreatic samples were semi-quantitatively graded as previously described [18,19].
Measurements of plasma levels of liver transaminase, amylase, and TNF
Plasma levels of AST and ALT were measured with a commercial kit Transaminase CII Test ™ (Wako, Osaka, Japan). Plasma levels of amylases were measured with a commercial Amylase Activity Assay Kit™ (Sigma-Aldrich, St. Louis. MO). Plasma levels of TNF-α were measured with a commercial mouse TNF-alpha Quantikine ELISA Kit ™ (R&D Systems, Minneapolis, MN).
Statistical analysis
SPSS statistics software (IBM) was used to perform statistical analysis. Signal intensity values were expressed as means ± S.E.M. Friedman test and Mann-Whitney U test were also used. A p value less than 0.05 was considered statistically significant.
Results
Dynamic temporal changes in MRI T2-weighted signal intensity
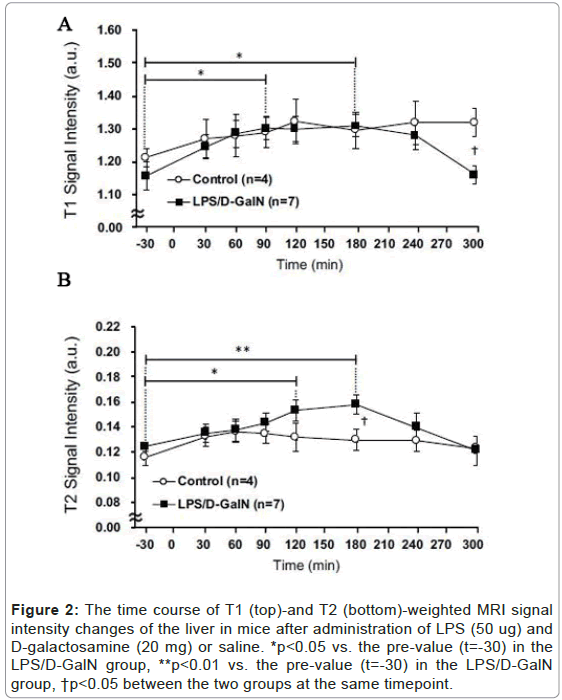
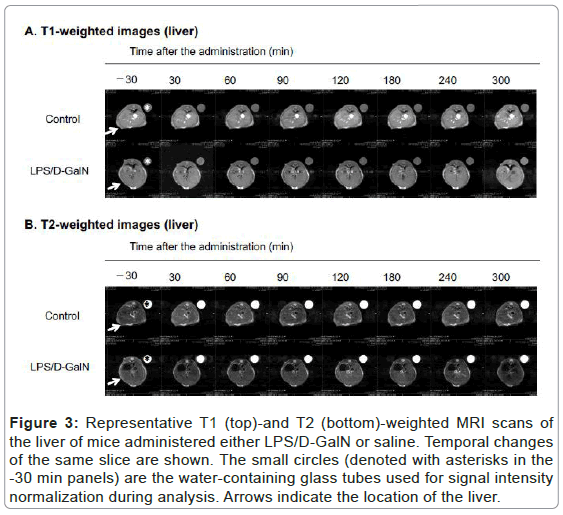
Using sequential MRI scanning, we investigated how a fulminant liver injury progressed and spread to the pancreas and kidney during the very early phase of LPS/D-GalN-induced hepatitis. We examined T2-weighted signal intensities reflecting the presence of tissue injury that resulted in cellular edema formation and organ congestion. By this means we discovered that compared with saline-treated control mice, LPS/D-GalN-treated mice showed a significant increase in signal intensities in the liver (Figures 2A and 3A). This increase began to rise at 120 min, continued to increase, and peaked at 180 min following injection of LPS/D-GalN. The signal subsequently decreased to baseline at 300 min, at which time the signal intensities in both control and LPS/D-GalN-treated mice proved similar. By contrast, although T1-weighted signal intensities also gradually increased in the LPS/D-GalN-treated mice, the T1 signal showed no peak corresponding to the T2 peak. No significant differences in T1 signal intensities were observed between the LPS/D-GalN-treated and control mice (Figures 2B and 3B).
Figure 2: The time course of T1 (top)-and T2 (bottom)-weighted MRI signal intensity changes of the liver in mice after administration of LPS (50 ug) and D-galactosamine (20 mg) or saline. *p<0.05 vs. the pre-value (t=-30) in the LPS/D-GalN group, **p<0.01 vs. the pre-value (t=-30) in the LPS/D-GalN group, †p<0.05 between the two groups at the same timepoint.
Figure 3: Representative T1 (top)-and T2 (bottom)-weighted MRI scans of the liver of mice administered either LPS/D-GalN or saline. Temporal changes of the same slice are shown. The small circles (denoted with asterisks in the -30 min panels) are the water-containing glass tubes used for signal intensity normalization during analysis. Arrows indicate the location of the liver.
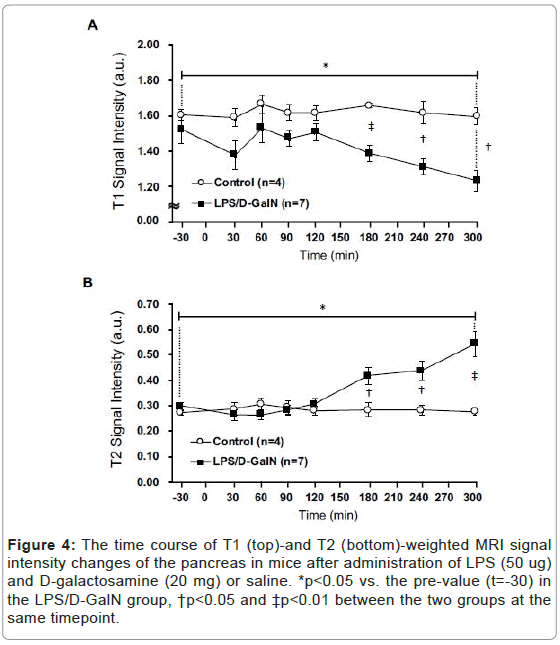
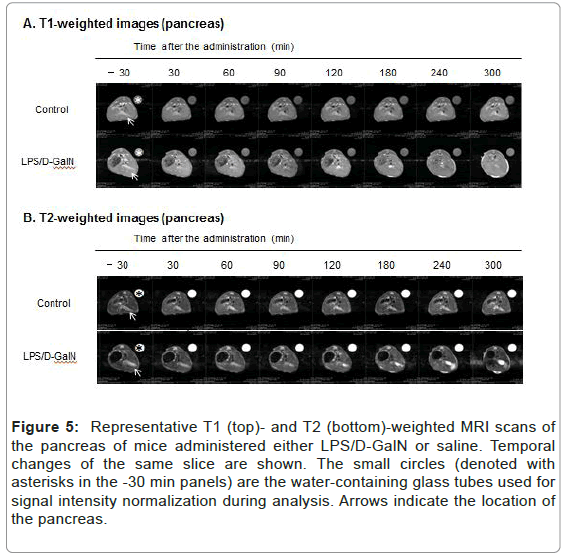
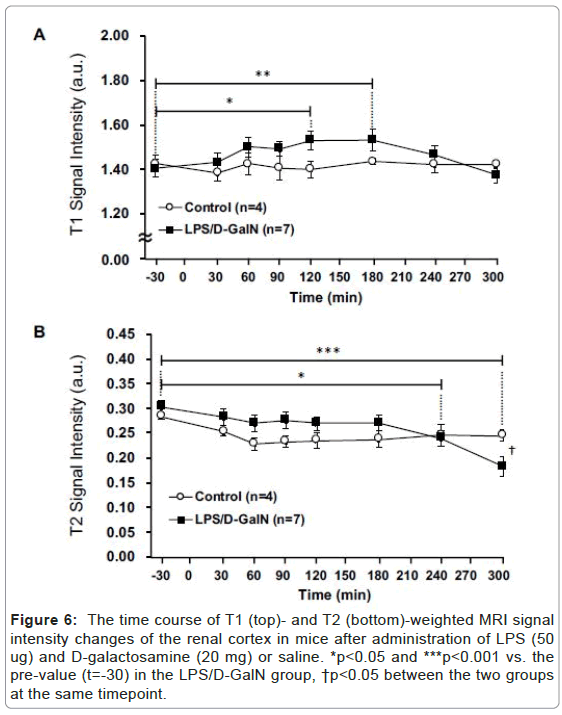
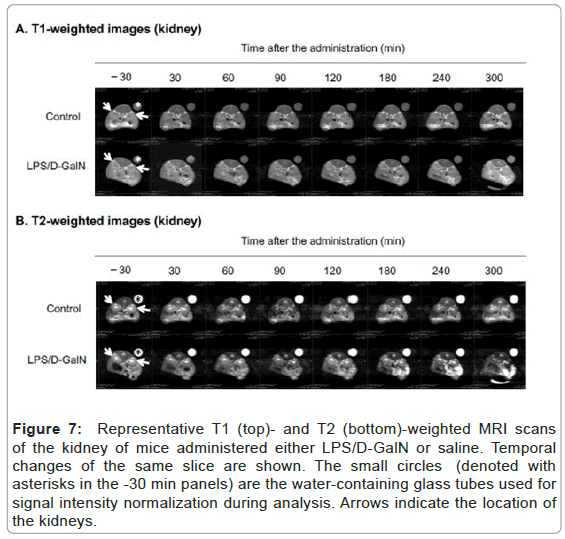
Fulminant hepatitis is often associated with multiorgan failure (MOF) leading to lethality [9], thereby potentially implicating visceral organs such as the pancreas and kidneys. However, very acute phases of potential tissue damage in the pancreas and kidney following fulminant hepatitis in an animal model remain to be elucidated. Therefore, we have examined how the T2-weighted signal intensities of the pancreas and the kidney might change, and observed a distinct pattern of MRI signal changes in the both compared to that of the liver. The T2 signal intensities of the pancreas in LPS/D-GalN-treated mice tended to rise at 180 min and progressively increased to a time point of 300 min, while that of control mice remained unchanged. By contrast, the T1-weighted signal intensities of the pancreas tended to fall at 180 min and gradually decreased at 300 min. The T1-weighted signal intensities of the pancreas of control mice remained unchanged (Figures 4 and 5). The T2 signal intensities of the renal cortex started to gradually decrease at 240 min, while those of the control mice remained unchanged (Figures 6 and 7).
Figure 4:The time course of T1 (top)-and T2 (bottom)-weighted MRI signal intensity changes of the pancreas in mice after administration of LPS (50 ug) and D-galactosamine (20 mg) or saline. *p<0.05 vs. the pre-value (t=-30) in the LPS/D-GalN group, †p<0.05 and ‡p<0.01 between the two groups at the same timepoint.
Figure 5: Representative T1 (top)- and T2 (bottom)-weighted MRI scans of the pancreas of mice administered either LPS/D-GalN or saline. Temporal changes of the same slice are shown. The small circles (denoted with asterisks in the -30 min panels) are the water-containing glass tubes used for signal intensity normalization during analysis. Arrows indicate the location of the pancreas.
Figure 6: The time course of T1 (top)- and T2 (bottom)-weighted MRI signal intensity changes of the renal cortex in mice after administration of LPS (50 ug) and D-galactosamine (20 mg) or saline. *p<0.05 and ***p<0.001 vs. the pre-value (t=-30) in the LPS/D-GalN group, †p<0.05 between the two groups at the same timepoint.
Figure 7: Representative T1 (top)- and T2 (bottom)-weighted MRI scans of the kidney of mice administered either LPS/D-GalN or saline. Temporal changes of the same slice are sho wn. The small circles (denoted with asterisks in the -30 min panels) are the water-containing glass tubes used for signal intensity normalization during analysis. Arrows indicate the location of the kidneys.
Histopathology
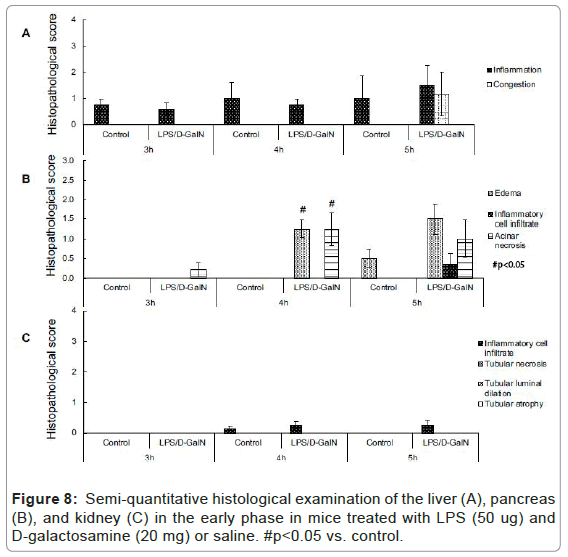
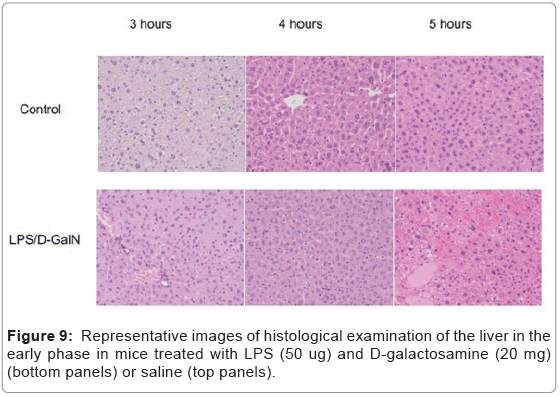
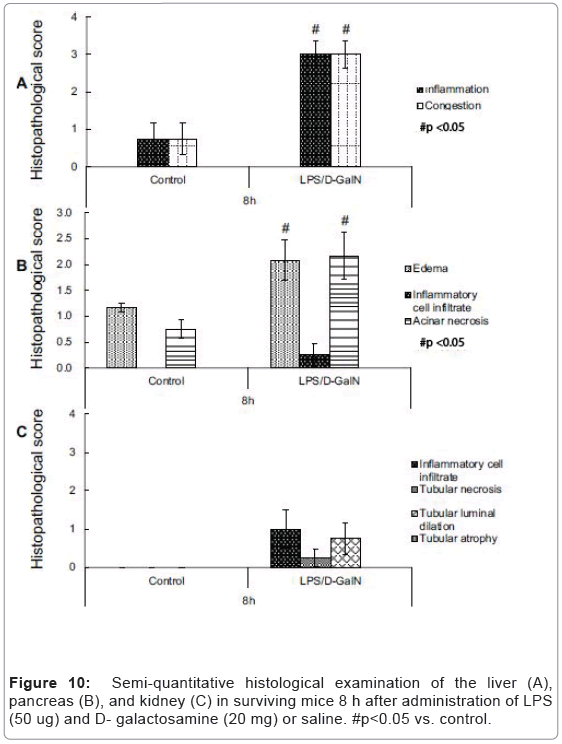
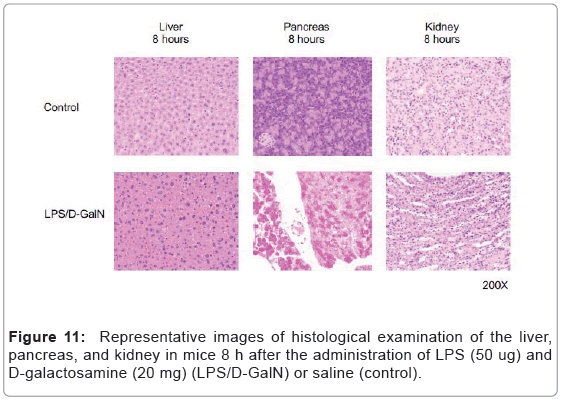
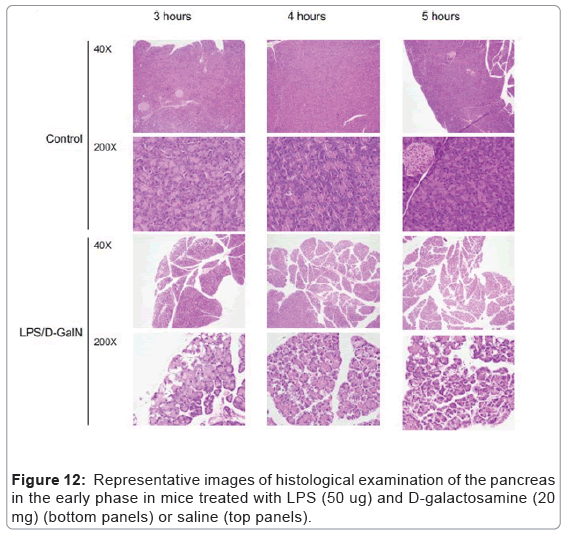
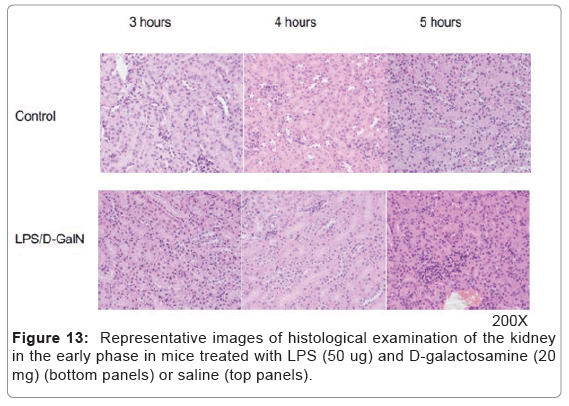
As mentioned above, MRI analysis enabled us to characterize the dynamic temporal changes in inflammation observed in the liver and pancreas. To complement the data obtained from our MRI analysis, we undertook a histopathological analysis of the liver, pancreas, and kidney at the 180, 240, and 300-min time points. Unexpectedly liver histologies of LPS/D-GalN-treated and control mice during this time frame were not significantly different. Both showed low levels of infiltration of mononuclear cells, while manifesting little congestion (Figures 8A and 9). Nonetheless, we found in the histology results examined at hour 8 that inflammation and congestion in the surviving LPS/D-GalN-treated mice were significantly higher than in control mice (Figures 10A and 11). In contrast to the liver histology, the pancreas of LPS/D-GalN-treated mice exhibited higher levels of edema formation, as well as greater pancreatic cellular damage and acinar cell necrosis than did control mice (Figures 8B and 12). In the renal cortex histology, LPS/D-GalN-treated mice showed more inflammatory cell infiltrates than control mice at the 240 and 300 min timepoints (Figures 8C and 13).
Plasma transaminase activities and TNF levels
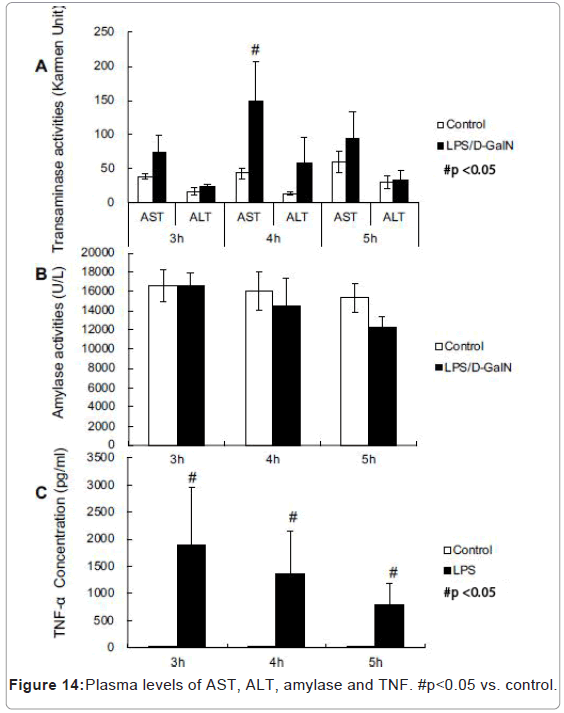
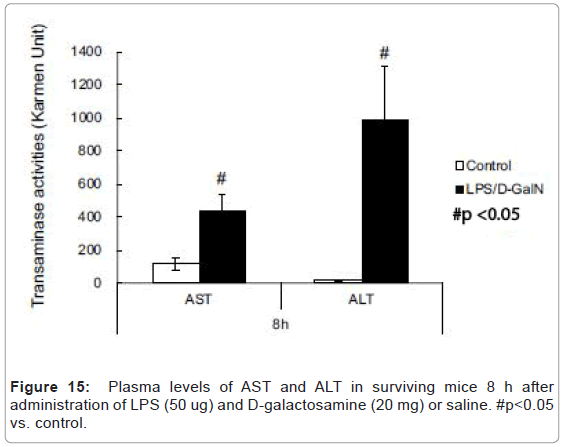
LPS/D-GalN-treated mice exhibited increased levels of AST at 240 min and much higher levels of plasma TNF-α concentration compared with control mice (Figures 14A-14C). However, no significant differences were observed in the plasma amylase concentrations (Figure 14B). At the 8 h timepoint, serum samples collected from surviving mice showed that AST and ALT were significantly higher in the LPS/D-GalN group (Figure 15).
Discussion
T2-weighted MRI signal intensities have been used to detect the presence of increased cellular water content that results in edema formation [14,15]. T2-weighted MRI signal-based detection has been utilized in LPS-induced mouse models of systemic inflammation for end-point evaluations of the pathologies. These techniques have enabled the detection of inflammation-related pathologies in subcutaneous regions, intestinal cavity and peri-renal regions [14]. In the present study, we have investigated the early phase of LPS/D-GalNtreated fulminant hepatitis. Although the lethality at 8 h after LPS/DGalN administration was high, during the early phase (i.e., 3 to 5 h), histological analysis revealed that liver damage was minimal. Consistent with these findings, only low-level leakages of AST and ALT into the plasma were observed during the early phase of experimental hepatitis. However, it is remarkable that T2-weighted MRI scans were able to detect the liver pathologies so sensitively, as early as the 3 h timepoint, at which time plasma TNF greatly increased. Previous studies examining liver histology in LPS/D-GalN mice confirmed the occurrence of liver damage as early as 5 to 6 hours following LPS/DGalN administration [12,20]. In the present study, LPS/D-GalNinduced liver pathologies in the early phase primarily exhibited edema formation and congestion, while showing only a low-grade infiltration of inflammatory cells. The histological findings in the present study are consistent with previous investigations showing that TNF-α-induced direct hepatocyte damage and cell death play central roles in the pathogenesis of LPS/D-GalN-induced liver injury [21].
Although certain technical differences in experimental protocols need to be carefully considered-e.g., the use of isoflurane anesthesia to immobilize mice and the doses of LPS/D-GalN used-the present results support the ability of micro-MRI to sensitively detect edemarelated pathologies in small animal imaging. The T2-weighted signal intensities of the liver peaked at the 180-min time point, decreasing thereafter. We could not explain with certainty the biphasic changes observed here. It might be due to the rapid formation of cellular swelling that resulted from the increased T2-weighted MRI signal intensities, followed by the pre-necrotic cellular changes, which might have led to the decreased signal intensities we recorded.
The present study has shown an increase in the T2-weighted signal intensities of the pancreas during the course of the fulminant hepatitis induced by LPS/D-GalN administration. Histological examination of the pancreas revealed edema formation along with pancreatic cellular damage and acinar cell necrosis. However, no significant increase in plasma amylase was observed during the early phase of LPS/D-GalN treatment. The pathological changes noted in the pancreas could be explained by several distinct possibilities. First, as acute pancreatic injury has been shown to occur with LPS treatment [22,23], pancreatic cellular injury is most likely induced as a result of systemic hypercytokinemia. LPS/D-GalN-induced fulminant hepatitis elicits the systemic release of pro-inflammatory cytokines, such as TNF-α, as shown in this study, which might affect pancreatic cellular integrity. This would thereby lead to capillary hyper-permeability, causing edema formation, cellular damage, and acinar cell necrosis. Second, LPS might directly act on pancreatic parenchymal cells to elicit an inflammatory cellular signaling cascade [24], thereby resulting in edema formation, cellular damage and acinar cell necrosis. Finally, portal vein hypertension caused by hepatic congestion could induce an increase in the hydraulic pressure in pancreatic parenchymal tissue, thereby causing pancreatic congestion and edema formation, as previously shown in dogs [25]. Given the acute onset of the pancreatic MRI intensity increase, portal vein hypertension and hydraulic edema formation might be important factors in pancreatic edema formation. Indeed, the latter could be compounded by the simultaneous presence of local and systemic inflammatory mediators. We confirmed the presence of liver congestion as early as 5 h by histological examination, suggesting that functional portal vein hypertension during the early phase likely occurred as early as the 3 h mark.
Based on histological examination, we observed only minor changes in the renal cortex during the early phase LPS/D-GaIN treatment. Nor did we note any increase in the T2-weighted signal intensities in the renal cortex.
Our experimental setting required continuous isoflurane anesthesia for constant immobilization of mice for sequential MRI scanning. Although isoflurane anesthesia did not increase the mortality rate in control mice, it did worsen the mortality of LPS/D-GalN-treated mice. In fact, it reached ~ 70%, possibly due to isoflurane-mediated vasodilation and hypotension, which further deteriorated the health of the acute hepatitis mice. We acknowledge the possibility that isoflurane-induced hypotension could contribute to the hypoperfusion of organs. However, the goal of this study was to analyze a detailed time course of the acute phases of edema and congestionrelated pathologies. For this reason, both diseased and control groups were similarly treated with isoflurane, which justified the chosen experimental settings. Another potential limitation is that we used only male mice, as their larger body size, compared with females, promotes better spatial image resolution. However, we are aware of the possibility that the sex of the mice might affect their immune responses to LPS.
Micro-MRI allowed us to successfully illustrate hourly changes of the signals in both the liver and pancreas. However, we acknowledge that the spatial resolution of T2-wighted MRI measurements in mice is so limited that any assessment of detailed structural changes within the organs, as well as their attendant functions, were difficult to achieve in the present study. An earlier study that utilized a dynamic contrastenhanced MRI with Gd-EOB-EDTA was better able to assess liver functions in Con A-induced liver injury at a single time-point (at 24 h) following disease onset [6]. Thus, the trade-off between spatio- vs. temporal-resolution needs to be carefully considered when performing preclinical small animal imaging. Although micro-computed tomography (micro-CT) offers a potential alternative to micro-MRI for some aspects of preclinical small animal imaging, micro-MRI is more sensitive in detecting water signals, and thus provides a better method for studying the early phase of edema-related pathologies, which might represent an important precursory phenomenon for severe damage and cell death [26].
Conclusion
We have studied the very acute phase of LPS/D-galactosamineinduced fulminant hepatitis by using sequential micro-MRI scanning. Analysis of T2-weighted MRI signal intensities detected the signal changes in the liver and the pancreas during the early phase. The results suggets the distinct temporal changes that occur in the liver and injured pancreatic acinar cells during the very acute phase of LPSinduced hepatitis.
Acknowledgements
This work was supported by JSPS Grants-in-Aid for Scientific Research grants (NN;19K20164, EK; 18K08917, 19KK0224, EJP; 19K09392, MS; 19KK0196, 18H02622) and a research grant from Asahi Kasei Pharma (EK, MS). The authors would like to thank Dr. Satoshi Nakanishi (Department of Radiological Technology, Suzuka University of Medical Science) for lending his expertise on the MRI and providing technical advice, Dr. Masaki Ishida (Department of Radiology, Mie University Hospital) and Dr. Shinichi Takase (Department of Radiology, Mie University Hospital) for providing advice on image analysis, Dr. Toru Ogura (Clinical Research Support Center, Mie University Hospital) for giving guidance on statistical analysis, and Dr. Nobuyuki Tanahashi (Department of Clinical Nutrition, Suzuka University of Medical Science) for his generous support.
References
- Biton IE, Stettner N, Brener O, Erez A, Harmelin A, et al. (2018) Assessing mucosal inflammation in a dss-induced colitis mouse model by mr colonography. Tomography 4: 4-13.
- Michael S, Keubler LM, Smoczek A, Meier M, Gunzer F, et al. (2013) Quantitative phenotyping of inflammatory bowel disease in the IL-10-deficient mouse by use of noninvasive magnetic resonance imaging. Inflamm Bowel Dis 19: 185-193.
- Bryant ND, Li K, Does MD, Barnes S, Gochberg DF, et al. (2014) Multi-parametric MRI characterization of inflammation in murine skeletal muscle. NMR Biomed 27: 716-725.
- Rusu M, Golden T, Wang H, Gow A, Madabhushi A (2015) Framework for 3D histologic reconstruction and fusion with in vivo MRI: Preliminary results of characterizing pulmonary inflammation in a mouse model. Med Phys 42: 4822-4832.
- Müller A, Hochrath K, Stroeder J, Hittatiya K, Schneider G, et al. (2017) Effects of liver fibrosis progression on tissue relaxation times in different mouse models assessed by ultrahigh field magnetic resonance imaging. Biomed Res Int 2017: 8720367.
- Byk K, Jasinski K, Bartel Z, Jasztal A, Sitek B, et al. (2016) MRI-based assessment of liver perfusion and hepatocyte injury in the murine model of acute hepatitis. MAGMA 29: 789-798.
- Hueper K, Gutberlet M, Bräsen JH, Jang MS, Thorenz A, et al. (2016) Multiparametric functional mri: non-invasive imaging of inflammation and edema formation after kidney transplantation in mice. PLoS One 11: e0162705.
- Goldberg E, Chopra S, Kristen SB (2018) Acute liver failure in adults: Etiology, clinical manifestations, and diagnosis. Uptodate.
- Panackel C, Thomas R, Sebastian B, Mathai SK (2015) Recent advances in management of acute liver failure. Indian J Crit Care Med 19: 27-33.
- Galanos C, Freudenberg MA, Reutter W (1979) Galactosamine-induced sensitization to the lethal effects of endotoxin. Proc Natl Acad Sci USA 76: 5939-5943.
- Eipel C, Kidess E, Abshagen K, Leminh K, Menger MD, et al. (2007) Antileukoproteinase protects against hepatic inflammation, but not apoptosis in the response of D-galactosamine-sensitized mice to lipopolysaccharide. Br J Pharmacol 151: 406-413.
- Mignon A, Rouquet N, Fabre M, Martin S, Pages JC, et al. (1999) LPS challenge in D-galactosamine-sensitized mice accounts for caspase-dependent fulminant hepatitis, not for septic shock. Am J Respir Crit Care Med 159: 1308-1315.
- Jiang W, Sun R, Wei H, Tian Z (2005) Toll-like receptor 3 ligand attenuates LPS-induced liver injury by down-regulation of toll-like receptor 4 expression on macrophages. Proc Natl Acad Sci USA 102: 17077-17082.
- Veres B, Gallyas Jr F, Varbiro G, Berente Z, Osz E, et al. (2003) Decrease of the inflammatory response and induction of the Akt/protein kinase B pathway by poly-(ADP-ribose) polymerase 1 inhibitor in endotoxin-induced septic shock. Biochem Pharmacol 65: 1373-1382.
- Maccioni F, Staltari I, Pino AR, Tiberti A (2012) Value of T2-weighted magnetic resonance imaging in the assessment of wall inflammation and fibrosis in Crohn's disease. Abdom Imaging 37: 944-957.
- Miquel ME, Scott AD, Macdougall ND, Boubertakh R, Bharwani N, et al. (2012) In vitro and in vivo repeatability of abdominal diffusion-weighted MRI. Br J Radiol 85: 1507-1512.
- Fukuda T, Mogami A, Tanaka H, Yoshikawa T, Hisadome M, et al. (2006) Y-40138, a multiple cytokine production modulator, protects against D-galactosamine and lipopolysaccharide-induced hepatitis. Life Sci 79: 822-827.
- Van Laethem JL, Marchant A, Delvaux A, Goldman M, Robberecht P, et al. (1995) Interleukin 10 prevents necrosis in murine experimental acute pancreatitis. Gastroenterology 108: 1917-1922.
- Francescato HD, Almeida LF, Reis NG, Faleiros CM, Papoti M, et al. (2018) Previous exercise effects in cisplatin-induced renal lesions in rats. Kidney Blood Press Res 43: 582-593.
- Osakabe N, Yasuda A, Natsume M, Sanbongi C, Kato Y, et al. (2002) Rosmarinic acid, a major polyphenolic component of Perilla frutescens, reduces lipopolysaccharide (LPS)-induced liver injury in D-galactosamine (D-GalN)-sensitized mice. Free Radic Biol Med 33: 798-806.
- Hu K, Gong X, Ai Q, Lin L, Dai J, et al. (2017) Endogenous AMPK acts as a detrimental factor in fulminant hepatitis via potentiating JNK-dependent hepatocyte apoptosis. Cell Death Dis 8: e2637.
- Deutschman CS, Cereda M, Ochroch EA, Raj NR (2006) Sepsis-induced cholestasis, steatosis, hepatocellular injury, and impaired hepatocellular regeneration are enhanced in interleukin-6 -/- mice. Crit Care Med 34: 2613-2620.
- Tribl B, Sibbald WJ, Vogelsang H, Spitzauer S, Gangl A, et al. (2003) Exocrine pancreatic dysfunction in sepsis. Eur J Clin Invest 33: 239-243.
- Zhang H, Li YY, Wu XZ (2006) Effect of tetrandrine on LPS-induced NF-kappaB activation in isolated pancreatic acinar cells of rat. World J Gastroenterol 12: 4232-4236.
- Lamb CR (1999) Pancreatic edema in dogs with hypoalbuminemia or portal hypertension. J Vet Intern Med 13: 498-500.
- Jones MD, Tran CW, Li G, Maksymowych WP, Zernicke RF, et al. (2010) In vivo microfocal computed tomography and micro-magnetic resonance imaging evaluation of antiresorptive and antiinflammatory drugs as preventive treatments of osteoarthritis in the rat. Arthritis Rheum 62: 2726-2735.
Citation: Nago N, Yoneda M, Darkwah S, Kawamoto E, Park EJ, et al. (2020) Micro-MRI-based Detection of Tissue Damage in the Liver, Pancreas, and Kidney during the Early Phases of an LPS and D-Galactosamine-Induced Hepatic Injury Model in Mice. Diagn Pathol Open 5: 161. DOI: 10.4172/2476-2024.1000161
Copyright: © 2020 Nago N, et al. This is an open-access article distributed under the terms of the Creative Commons Attribution License, which permits unrestricted use, distribution, and reproduction in any medium, provided the original author and source are credited.
Select your language of interest to view the total content in your interested language
Share This Article
Open Access Journals
Article Tools
Article Usage
- Total views: 4126
- [From(publication date): 0-2020 - Dec 19, 2025]
- Breakdown by view type
- HTML page views: 3189
- PDF downloads: 937
