Modeling Spatial and Temporal pCO2 Variability at 49°N/16.5°W and 56.5°N/52.6°W in the North Atlantic Ocean
Received: 22-Oct-2015 / Accepted Date: 13-Jan-2015 / Published Date: 20-Jan-2016 DOI: 10.4172/2157-7617.1000330
Abstract
Numerical models have been employed in understanding and capturing spatiotemporal CO2 trends, inter seasonal to decadal variability, and the characterization of thermal (pCO2-T) and non-thermal (pCO2-nonT) components of surface ocean pCO2 and air-sea CO2 flux variability. We employed the MIT Ocean General Circulation Model and available data from two sub polar North Atlantic observatories at 49°N, 16.5°W and 56.5°N, 52.6°W to capture in situ pCO2 observations and deconvolute bio-physical controlling processes. The model suggests that the pCCO2 cycle is marked by a summertime minimum and wintertime maximum. The physical-chemical and biological response pattern of the model is in good accordance with the observed pCO2, pCO2-T and pCO2-nonT trends. Model outputs suggest that the CO2 cycle is governed by contrasting effects of seasonal cooling and warming on one side and spring and summer net biology activities on the other side. It also predicts year-round under saturation, indicating that the region is a weak to moderate sink for CO2.
Keywords: Ocean modeling; Sea surface temperature; Biogeochemistry; Carbon dioxide; North Atlantic ocean
10805Introduction
Global oceans provide large uptake potential for anthropogenic atmospheric CO2. This is of great importance considering the oceanic stabilization effect on atmospheric CO2. The oceanic uptake of excess of inorganic carbon from the atmosphere has been shown to account for approximately 48% of the total anthropogenic CO2 emissions within the past 200 years [1]. Current estimates of global oceanic CO2 sink as well as spatial variability and trends in pCO2 in the oceans vary significantly [2-7]. Observational studies and models suggest that in some regions of the Atlantic Ocean, there may be a weakening trend of oceanic CO2 sinks in response to either climate change or natural variability [7-11]. However, a switch from natural carbon storehouses to sources is highly unlikely in the foreseeable future.
The North Atlantic is considered to represent the most intense, per unit area, ocean sink for atmospheric CO2 in the Northern Hemisphere on interannual to decadal timescales [12]. On the global scale, the oceans are the Earth’s primary sink that offsets anthropogenic CO2 emissions and the North Atlantic is the primary gate for CO2 entering the global ocean. However, according to the recent IPCC Global Carbon Budget 2013 assessment report, the ocean sink for anthropogenic CO2 is estimated to be approximately equal to land sink fraction [13]. The subpolar North Atlantic is a complex and highly variable oceanic region both in space and time, and has in recent studies been confirmed as a significant sink based on automated surface ocean pCO2 measurements [6,8,14].
Numerical ocean biogeochemical models have been and are employed in understanding and capturing physical-chemical and biological response patterns and driving mechanisms (processes) of the uptake and release of CO2 in several ocean studies, usually in conjunction with in situ pCO2 measurements. These coupled physicalbiogeochemical models are efficient, fast, compact and powerful scientific tools that are employed in understanding the past and present and predicting future cycles and changes in ocean carbonate chemistry system and climate, while being conscious of the ocean and climate system’s response to this forcing [15] have outlined the imperativeness of accurately capturing both the pCO2-T (thermal) and pCO2-nonT (non-thermal) in order to understand the biogeochemical dynamics of the oceanic pCO2 cycle.
Modeling the oceanic response typically involves the interaction between physical (stratification, temperature, salinity, mixing, solar radiation, etc.), chemical (dissolved inorganic carbon (DIC), total alkalinity, particulate inorganic carbon (PIC), pH, oxygen, phosphate, silicate and iron), and biological (zooplankton, phytoplankton and dissolved organic carbon (DOC), dissolved organic matter (DOM) and particulate organic matter (POM) parameters and processes [7,16,17].
The fundamental objective of this study is the characterization and evaluation of the annual/seasonal patterns of pCO2 variability as well as a deconvolution of associated physical and biological forcing’s using MITgcm biogeochemical model and in situ data from two North Atlantic time series sites. While we seek to improve our ability to quantify the North Atlantic sink as well as understand the surface ocean pCO2 variability and governing processes, we took advantage of observed data from the porcupine abyssal plain (PAP) and the K1 central labrador sea (K1 CELAS) observatories, and attempt to investigate how well a physical-biogeochemical-ecosystem model can capture in situ observations of surface ocean pCO2 in the North Atlantic western and eastern oceanographic locations.
Methods and Data
Sources of observed data and deployments
The details of the sampling strategy, analytical methods, data quality control and calibration procedures employed for taking the diverse set of biogeochemical and physical measurements and recovered observed data at the KI CELAS and PAP observatories have been reported by [18,19] and in the Euro SITES data documentation [http://www.eurosites.info/]. The observed data used in this research were obtained during three consecutive mooring deployments in July 2003-March 2005 and September 2004-July 2005 for the northeast PAP (49°N/16.5°W) and northwest K1 CELAS (56.5°N/52.5°W) locations, respectively (Figure 1 and Table 1). The deployments at the Porcupine Abyssal Plain time series site were designated PAP2, PAP3 and PAP4 for observations made during the second, third and fourth deployments respectively.
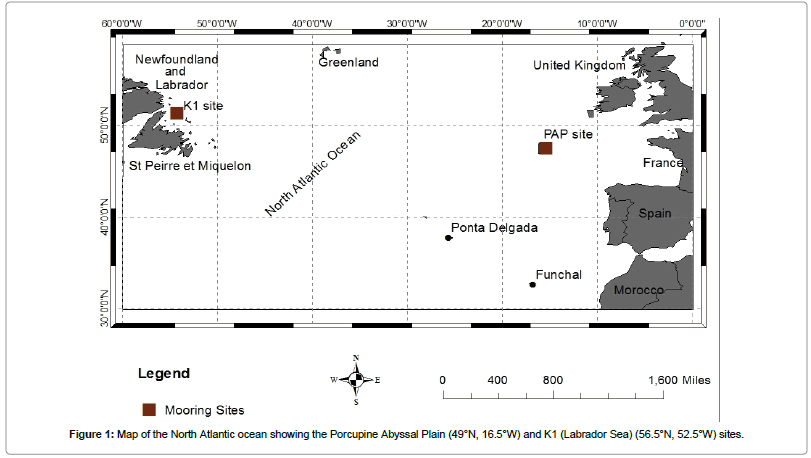
Figure 1: Map of the North Atlantic ocean showing the Porcupine Abyssal Plain (49°N, 16.5°W) and K1 (Labrador Sea) (56.5°N, 52.5°W) sites.
| Mooring Identifier |
Mooring Coordinates | Deployment Cruise/Date | Recovery Cruise/Date | Parameters Measured |
|---|---|---|---|---|
| PAP 2 | 48.9975°N 16.4492 °W | RV Poseidon 300/13-Jul-2003 | RV Poseidon 306/03-Nov-2003 | pCO2, Pressure, Temperature, Conductivity, Salinity, nitrate, chl-a, particle flux |
| PAP 3 | 49.0147°N 16.5267°W | Poseidon 306/18-Nov-003 | RSS Charles Darwin 158/20-Jun-2004 | pCO2, Pressure, Temperature, Conductivity, Salinity, nitrate, chl-a, particle flux |
| PAP 4 | 49.0497°N 16.5169°W | RSS Charles Darwin 158/23-Jun-2004 | RSS Discovery 295/18-March-2005 | pCO2, Pressure, Temperature, Conductivity, Salinity, nitrate, chl-a, particle flux |
| K1 CELAS | 56.5°N, 52.5°W |
15-Sept -2004 | 21-July-2005 | pCO2, Pressure, Temperature, Salinity. |
Table 1: PAP and K1 CELAS observatory mooring deployments and the physico-biogeochemical parameters measured.
The physical-biogeochemical-ecosystem ocean model
Details of the MIT ocean general circulation model (MITgcm) used for the comparison of observational and model data in this study, which is regionally configured for the North Atlantic between 20°S and 81.5°N with a horizontal resolution of 0.5° latitude and 0.5° longitude have been described in previous papers and the model has been applied to the North Atlantic carbon sink by [7,20-22]. However, the distinctive characteristics of the physical part of the biogeochemical model are shown in Table 2, while a schematic presentation of the ecosystem part is illustrated in Figure 2.
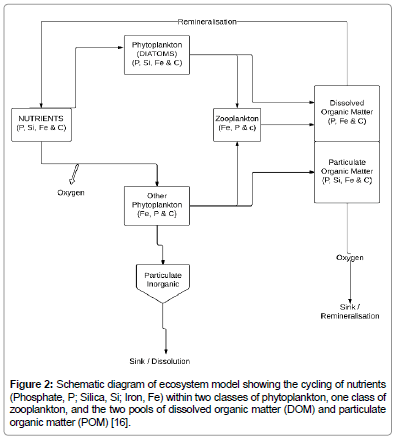
Figure 2: Schematic diagram of ecosystem model showing the cycling of nutrients (Phosphate, P; Silica, Si; Iron, Fe) within two classes of phytoplankton, one class of zooplankton, and the two pools of dissolved organic matter (DOM) and particulate organic matter (POM) [16].
| Physical model | MITgcm | |
|---|---|---|
| Computational domain | 20°S and 81.5°N | |
| Resolution | Longitude | 0.5° |
| Latitude | 0.5° | |
| Vertical | 23 vertical levels with a resolution of 10 m thickness at the surface, increasing to 500 m thickness for depths greater than 2200 m [26,27] | |
| Surface forcing | Daily fields from NCEP/NCAR Reanalysis I for 1992- 2006 [28].Sea surface temperatures (SSTs) are relaxed (two week timescale) to 1992-2006 satellite-based estimates [29] | |
| Parameterization | Gent-McWilliams eddy parameterization [30].Nonlocal K-Profile parameterisation (KPP) boundary layer mixing scheme [31] |
Table 2: Key features of the physical model.
The ecosystem model is moderately complex taking into account the cycling of carbonates and nutrients [16,23]. It also features a pelagic ecosystem with one zooplankton class and two phytoplankton classes (diatoms and small phytoplankton) [7,15]. The atmospheric pCO2 forcing in the model is incorporated from Mauna Loa Observations [24], and takes into account the annual and seasonal pCO2 cycle. The dissolved and particulate carbon pools are resolved, and parameterisation of calcium carbonate cycling is included, while the sea-air exchange of CO2 in the biogeochemical model is parameterized according to [25], with surface ocean pCO2 determined as discussed by [23]. A positive flux is described as a net CO2 exchange from sea to the atmosphere (outgassing) while a negative flux value implies a net CO2 invasion from air to the sea (uptake).
Calculation of pCO2 thermal and non-thermal components
The exchange of CO2 between the atmosphere and ocean surface is primarily controlled by the air-sea difference in partial pressure of CO2 (ΔpCO2), which provides the thermodynamical driving force and is regulated by naturally occurring physical, chemical and biological processes [26-31]. Considering the thermodynamics of the marine CO2 system, the thermal component of surface-water pCO2 variability is comparable in magnitude but opposite in direction to the biological effect [32]. However, it has been demonstrated that that the temperature (thermal) and biological (non-thermal) effects on seasonal pCO2 amplitude can be derived from the total concentration of CO2 effect, and the relative contributive impact of each processes for regulating the seasonal amplitude in pCO2 assessed over the oceans [6]. In this synthesis, this approach was adopted in separating the thermal and non-thermal components of surface ocean pCO2 variability.
In order to remove the temperature effect from the observed pCO2, the observed pCO2 values are normalized to the annual mean temperature of seawater at the observatory, using the equation:
 (1)
(1)
and the effect of temperature changes on pCO2 at a given observed temperature, Tobs is computed using the equation:
 (2)
(2)
where T is the temperature in °C, pCO2 is the partial pressure of carbon dioxide in μatm, and the subscripts “ " and “obs” indicate annual mean and observed values respectively, [6].
Results
Data/model pCO2 comparison at the NE PAP observatory
In this section, the seasonal cycles of pCO2, pCO2-T, and pCO2- nonT from the biogeochemical model and the PAP (PAP2 - PAP4) moored data are presented. For the most part and within specific surface mixed layer, the ocean model appears to be highly consistent and compares favorably with the PAP observed pCO2 data and derived thermal/non-thermal components (Figures 3a-3c). However, the disagreement between the in situ PAP observations and model results at certain mixed layer depth may be partly attributed to the model resolution, and this obviously presents a major limitation of the MITgcm biogeochemical model.
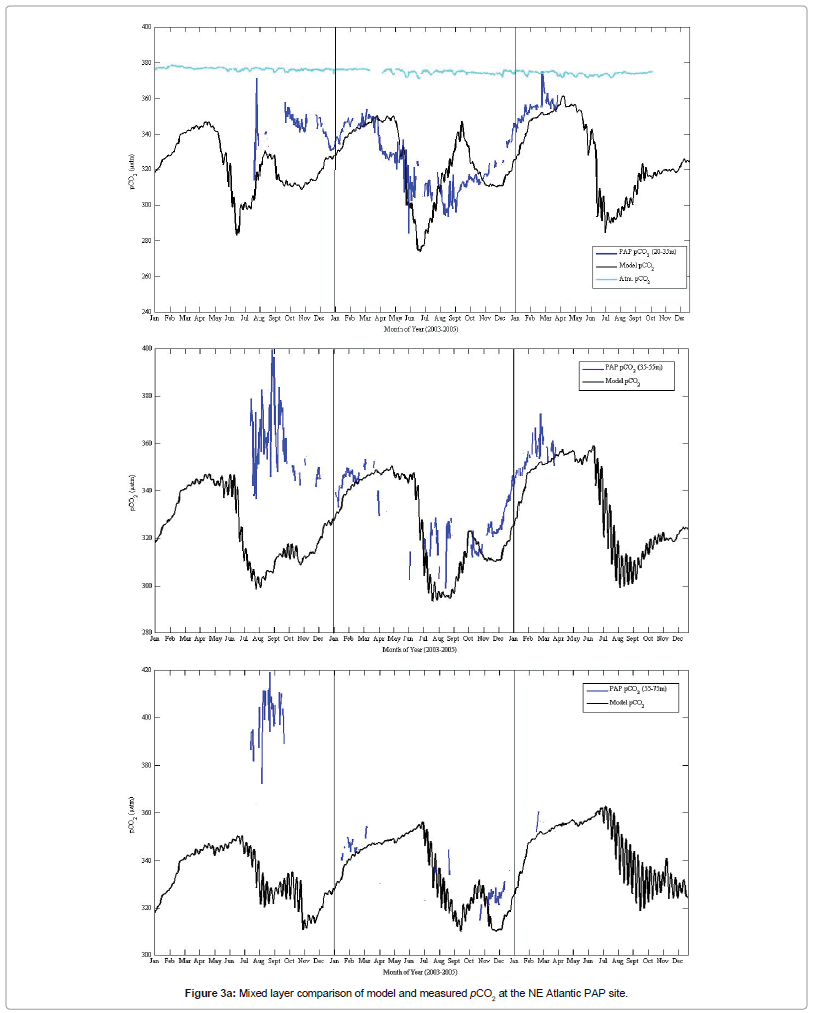
Figure 3a: Mixed layer comparison of model and measured pCO2 at the NE Atlantic PAP site.
Model results for the seasonal pCO2 cycle relative to the observations indicate that the model captures the cycle reasonably well although with significant underestimation of the pCO2 amplitude especially within the 35-75 m depth mixed layer during summer/early wintertime of the 2nd (PAP2) and 3rd (PAP3) deployments. As described below, the model fails to capture the full magnitude of the biological signal (nutrient drawdown) observed at the PAP site. However, the model captured the characteristic subpolar time series observed pCO2 summertime minimum, wintertime maximum.
The model pCO2-T cycle (Figure 3b) has a pattern that clearly captures the cycle shown by the PAP data especially within the 20 - 55m mixed layer, although the peak data pCO2-T amplitudes during late summer of the second deployment (PAP2) were higher than the model pCO2-T cycle. Interestingly, the model pCO2-T cycle at 55-75 m mixed layer depth was obviously inconsistent with the seasonal data pCO2-T pattern. The amplitude of the model pCO2-T (55-75 m) cycle was relatively higher in magnitude than the data pCO2-T at this depth range. In general, the model and data results reveal that the summer months were characteristically warmer with 2004 recording comparatively higher sea surface temperature values. Surface temperature values were however low at the subsurface euphotic depths especially during the winter months.
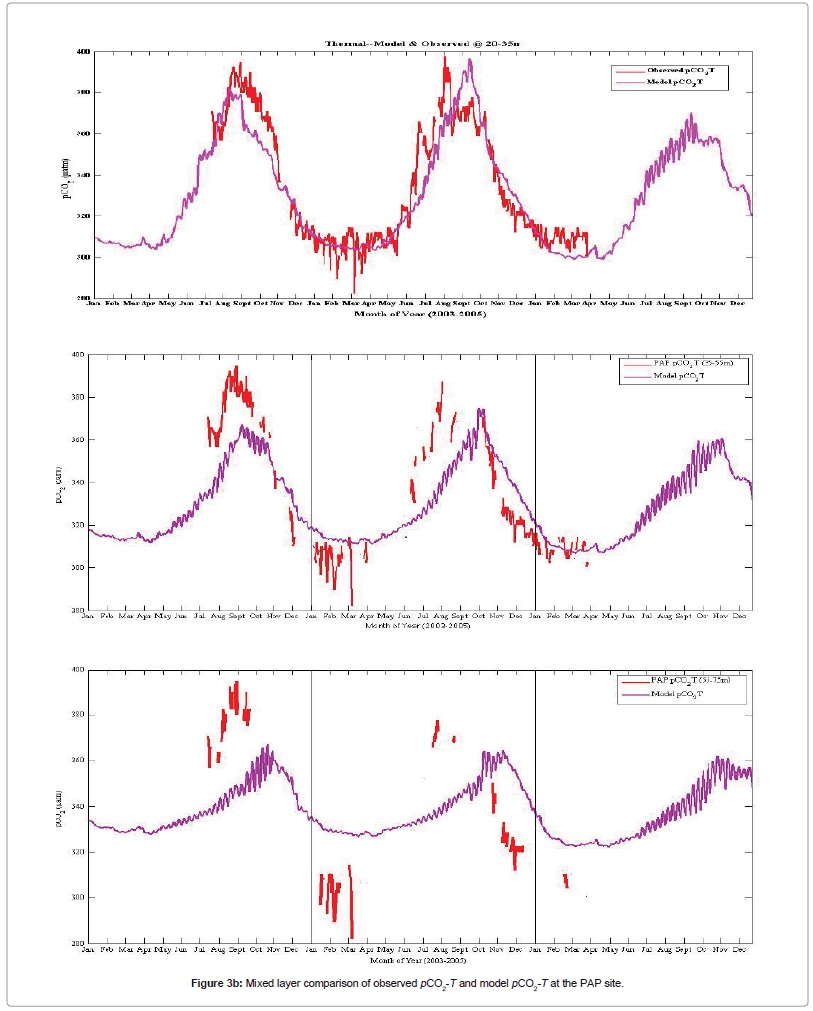
Figure 3b: Mixed layer comparison of observed pCO2-T and model pCO2-T at the PAP site.
Model non-thermal forcing pattern (pCO2-nonT) consistently agree with the data pCO2-nonT cycle at 20-75 m depth mixed layer on a seasonal scale, and the amplitude broadly aligns with or comes within the range of the observed pCO2-nonT. However, the model pCO2-nonT cycle at 55-75 m mixed layer underestimates the biology signal clearly imprinted by the data pCO2-T cycle during the summertime of the 2nd deployment (Figure 3c).
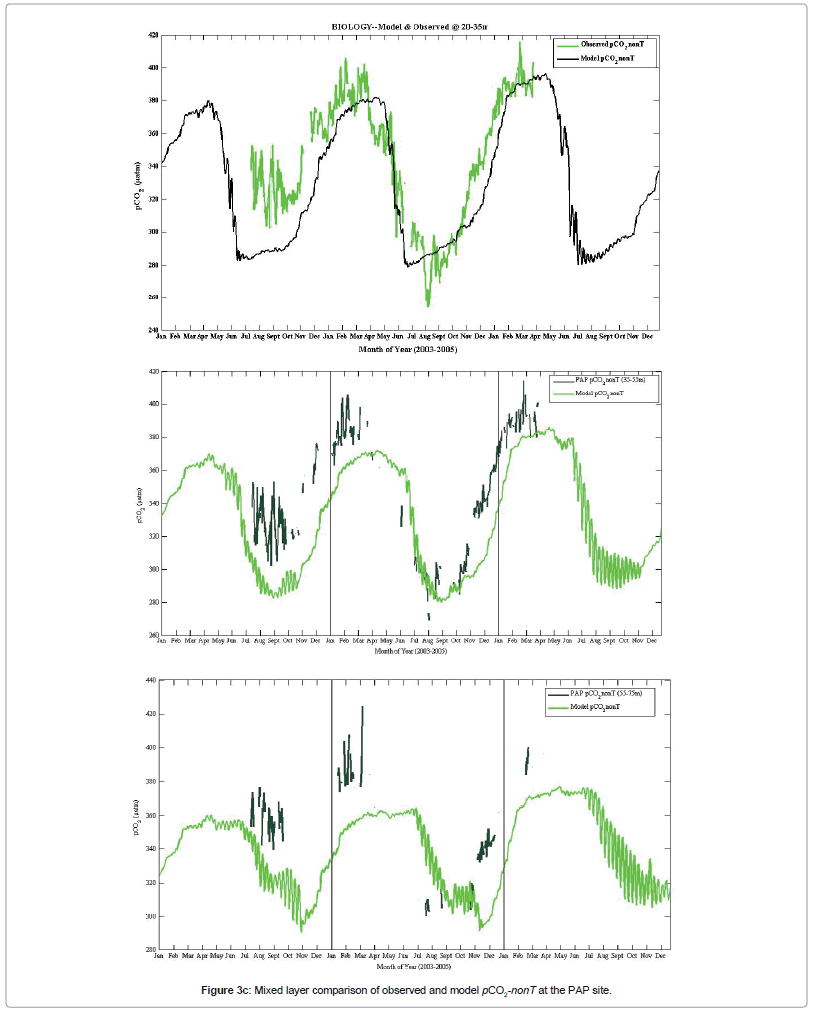
Figure 3c: Mixed layer comparison of observed and model pCO2-nonT at the PAP site.
A combination of the seasonal patterns of pCO2-T and pCO2-nonT cycles creates the model pCO2 cycle, which indicates a large increase in surface pCO2 during the winter and a significant decrease during the summertime. The enhanced surface pCO2 is due to vertical mixing of CO2 (DIC) enriched water from the subsurface depths (mesopelagic zone) to the surface of the ocean in winter [12,18]. However, it is obvious that the model actually estimates the surface mixed layer pCO2 levels of the PAP site, and could be considered realistic in this regard.
The modeled pCO2 performance during the summertime corresponding to the period of the second deployment suggests a temperature-controlled cycle when actually it is the non-thermal forcing that is dominantly regulating the total pCO2 pattern. From non-thermal component attributes of the observed/model output, it can be proposed that the pCO2 variability of the PAP site may not be governed primarily by seasonal temperature changes only, but also by biological forcing fueled by carbon fixation and nutrient availability, as well as deep vertical mixing of dissolved inorganic carbon enriched water from the bottom mixed layer depth to the ocean surface.
A striking observation is that the model evidently captures observed pCO2 summertime minimum and wintertime maximum respectively except for 2003, and also accurately depicted that pCO2 is governed by contrasting effect of temperature and biology. The model captured observed cycles of pCO2, thermal and biology components reasonably well within surface 20-35 m with caveats at deeper layers. More so, the model underestimated the amplitude of annual temperature cycle at 35 m depth and below, suggesting shallow depth of seasonal thermocline.
Data/model pCO2 comparison at NW K1 central labrador sea
In this section, the pCO2, pCO2-T and pCO2-nonT model outputs to observed data at the K1 Labrador Sea time series are presented (Figure 4). At site K1, model pCO2 has a rather peculiar jump during wintertime (mid-Feb. in 2004, and mid-Jan. in 2005), followed by a rather long period of flat value. It seems the model grossly underestimated both the physical and biological activities at this site during this period. The model pCO2 is obviously out of phase with observed pCO2 by about 3 months, peaking in November instead of February. More so, pCO2 peak-to-peak amplitudes between the observed data and model output in early fall (October 2004) and in wintertime (January- March) were out of phase by about 60 μatm. This difference might be considered very significant, thereby indicating a moderate flaw of the model. Discrepancies might be due to model being too cold in the fall, and thus not allowing biological activity to drawdown pCO2 as much as observed. Further, although both model and observed data show a dominance of biological activities over pCO2 variability, caution must be made since modeled seasonal patterns were quite different from the data.
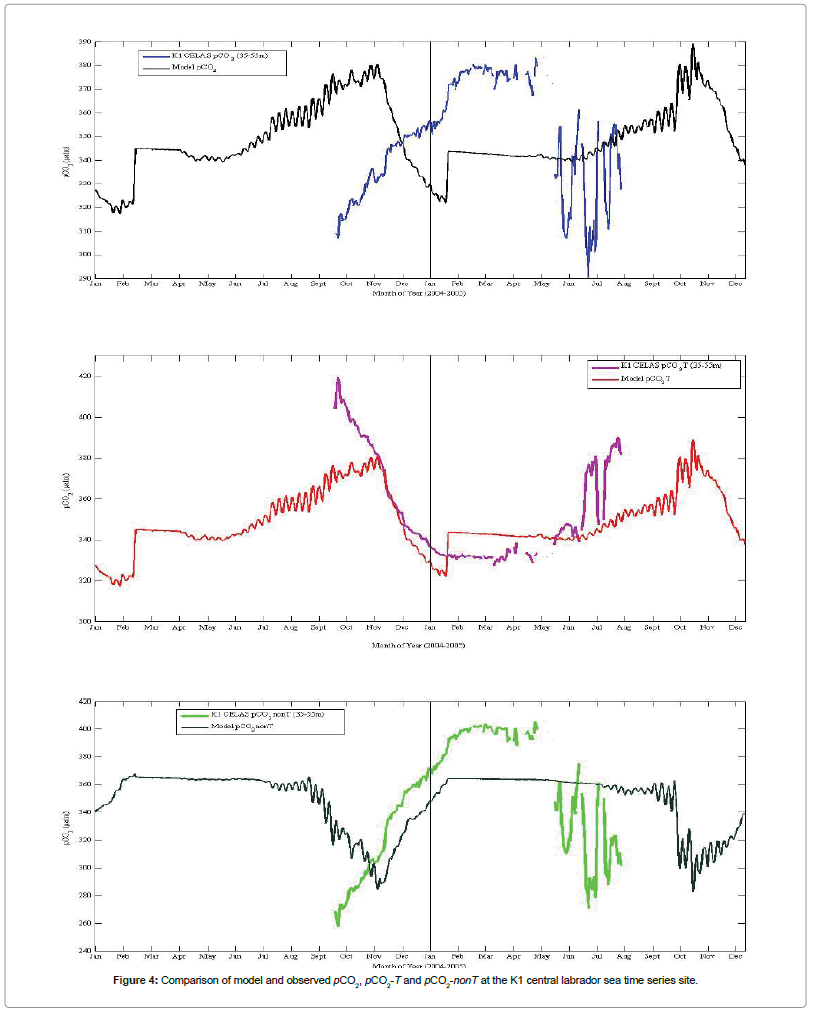
Figure 4: Comparison of model and observed pCO2, pCO2-T and pCO2-nonT at the K1 central labrador sea time series site.
Model pCO2-T of K1 CELAS site looks good between November through June although it appears too cold in late summer/fall. However, it warms up late by three months (three months phase offset). K1 CELAS data pCO2 trend may be considered to be in-phase with model pCO2-T pattern, although there is a significant digression during summertime. The MITgcm fairly captures the K1 CELAS wintertime pCO2-nonT pattern (Figure 4). However, it partially fails in capturing the summertime biological signal observed at the K1 site within the 35-55 m depth. It appears the model pCO2-nonT is not warming enough in summer hence its failure to capture the observed pCO2-nonT drawdown and biological productivity.
Anomalies of pCO2, pCO2-T and pCO2-nonT
The patterns of the averaged daily anomalies of pCO2, pCO2-T and pCO2-nonT calculated from observed data at the PAP and K1 CELAS observatories and model outputs are presented in Figures 5 and 6 respectively. Measurements at PAP site shows a much elevated pCO2 during summer 2003. However, the model grossly over-estimated the biological drawdown during this period, resulting in much lower pCO2 (Figure 5). Relatively high positive anomalies of pCO2 (61 μatm), pCO2-T (58 μatm), and pCO2-nonT (77 μatm) were obtained based on average daily data for PAP pCO2, temperature and non-temperature components of the total pCO2 considered. More so, the computed anomalies based on daily averages indicated negative deviations of 54, 58 and 84 μatm for pCO2, pCO2-T and pCO2-nonT respectively. For K1 CELAS site, positive anomalies of pCO2 (35 μatm), pCO2-T (67 μatm), and pCO2-nonT (57 μatm) were obtained based on average daily data, with corresponding negative deviations of 61, 25 and 96 μatm for pCO2, pCO2-T and pCO2-nonT respectively (Figure 6).
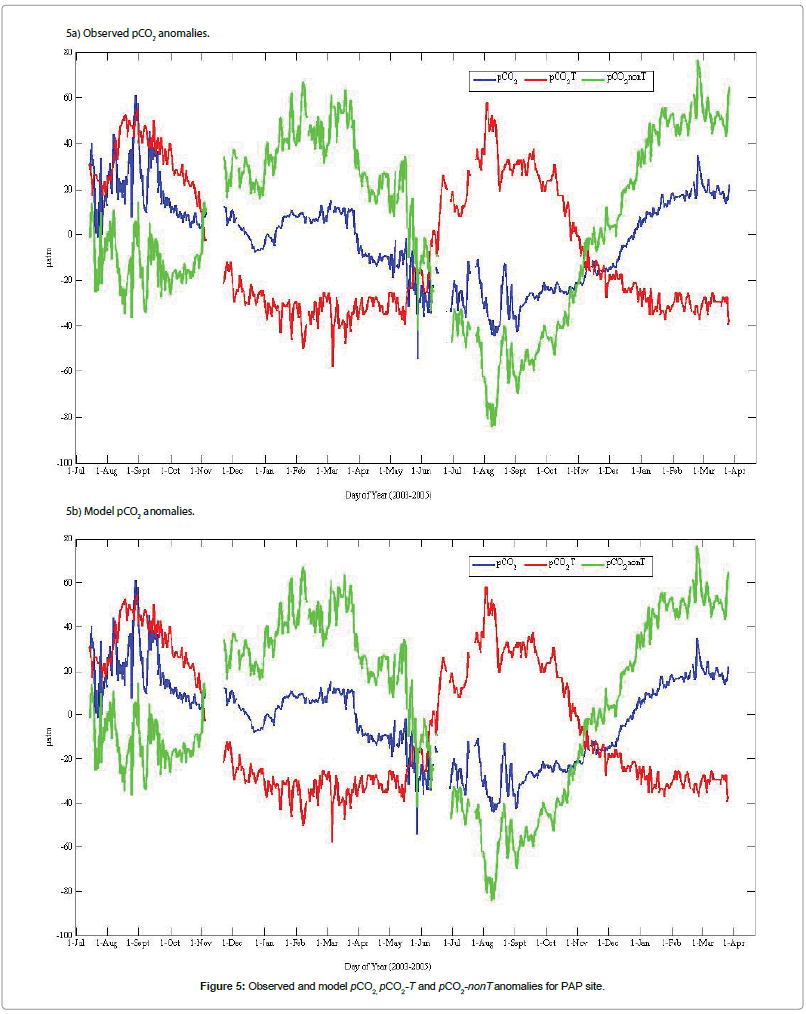
Figure 5: Observed and model pCO2, pCO2-T and pCO2-nonT anomalies for PAP site.
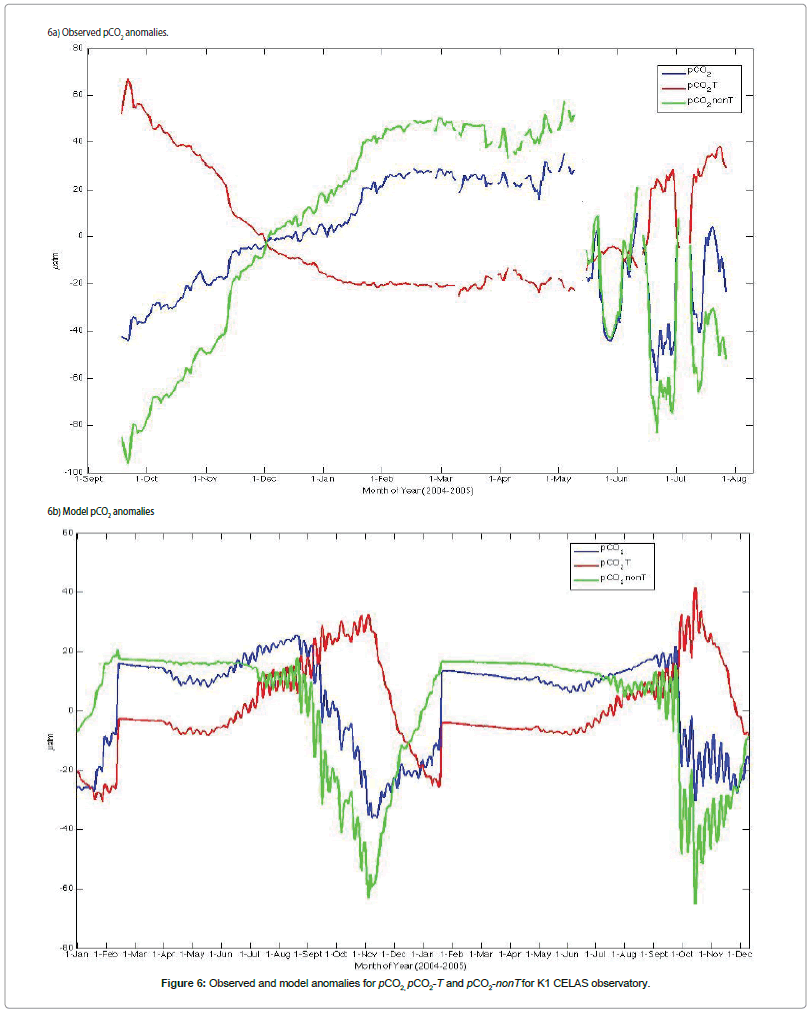
Figure 6: Observed and model anomalies for pCO2, pCO2-T and pCO2-nonT for K1 CELAS observatory.
Conclusion
In this paper, the seasonal distribution of surface ocean observational data and associated thermal and non-thermal factors controlling the variability and processes of pCO2 at the PAP (Northeastern) and K1 Central Labrador Sea (Northwestern) observatories in the North Atlantic Ocean have been investigated using a modestly highresolution ocean general circulation model. This work indicates that in the subpolar North Atlantic on a seasonal timescale the observed as well as the modeled pCO2 distribution is marked by minimum and maximum pCO2 for the summertime and wintertime respectively. The seasonal cycles of model pCO2, pCO2-T, and pCO2-nonT of the biogeochemical model compared to observational data revealed that the thermal component of surface water pCO2 is comparable in magnitude but opposite in direction to the biological effect. For the most part and within specific depth of the mixed layer, the ocean biogeochemical model appears to reproduce seasonal pCO2, pCO2-T, and pCO2-nonT phases and amplitudes favorably consistent with the seasonal PAP pCO2, pCO2-T, and pCO2-nonT observations.
However, few but significant disagreements between the in situ PAP observations and model results at certain mixed layer depths may be partly attributed to the model resolution amongst various factors. In general, model results for the seasonal pCO2, pCO2-T, and pCO2-nonT cycles relative to the observatory data indicates that the model captures the pCO2, pCO2-T, and pCO2-nonT cycles fairly well although with significant underestimation of the pCO2 and pCO2-nonT amplitudes especially within the 35 - 75m mixed layer depth during summer/early wintertime of the 2nd and 3rd deployments. In order words, the model fails to capture the biological signal (nutrient drawdown) observed at the PAP site.
Acknowledgements
The EuroSITES Project data was used for this research. The contributions of the principal investigator and other scientists involved in the PAP project are acknowledged. The first author is particularly thankful to his Fulbright host Prof. G. A. McKinley for guidance. The authors would like to thank anonymous reviewers for their comments and suggestions that much improved the original manuscript.
References
- Sabine CL, Feely RA, Gruber N, Key RM, Lee K, et al.(2004)The oceanic sink for anthropogenic CO2. Science305:367-371.
- Bala G, Caldeira K, Mirin A, Wickett M, Delire C(2005)Multicentury changes to the global climate and carbon cycle: results from a coupled climate and carbon cycle model.J Clim18:4531-4544
- Gruber N, Keeling CD (2001) An improved estimate of the isotopic air-sea disequilibrium of CO2: Implications for the oceanic uptake of anthropogenic CO2. Geophys. Res Lett28:555-558.
- Orr JC, Maier-Reimer E, Mikolajewicz U, Monfray P, Sarmiento JL, et al.(2001) Estimates of anthropogenic carbon uptake from four three-dimensional global ocean models. Global Biogeochem Cycles15:43-60.
- Shim JH, Kim D, Kang YC, Lee JH, Jang ST, et al. (2007) Seasonal variations in pCO2 and its controlling factors in surface seawater of the northern East China Sea. Continental Shelf Res 27: 2623-2636
- Takahashi T, Sutherland SC, Sweeney C, Poisson A, Metzl N,et al. (2002) Global sea to air CO2?ux based on climatological surface ocean pCO2,and seasonal biological and temperature effects. Deep Sea Res Part II: Topical Studies in Oceanography 49:1601-1622.
- Ullman D, McKinley GA, Bennington V, Dutkiewicz S(2009) Trends in the North Atlantic carbon sink: 1992-2006. Global Biogeochem Cycles 23.
- Schuster U, Watson AJ, Bates NR, Corbiere A, Gonzalez-DavilaM, (2009) Trends in North Atlantic sea-surface fCO2 from 1990 to 2006. Deep-Sea Res II: Topical Study in Oceanography 56:620-629.
- Le Quéré C, Raupach MR, Canadell JG, Marland G, Bopp L, et al. (2009) Trends in the sources and sinks of carbon dioxide. Nature Geoscience 2:831-836.
- Le Quéré C, Rodenbeck C,Buitenhuis ET, Conway TJ, Lagenfelds R, et al. (2007) Saturation of the Southern Ocean CO2sink due to recent climate change. Science316:1735-1738.
- Thomas H, Prowe AEF, van Heuven S, de Baar HJW, Schiettecatte L-S (2007) Rapid decline of the CO2 buffering capacity in the North Sea and implications for the North Atlantic Ocean. Global Biogeochem. Cycles 21.
- Takahashi T, Sutherland SC, Wanninkhof R, Sweeney C, Feely RA, et al. (2009) Climatological mean and decadal change in surface ocean pCO2, and net sea-air CO2 flux over the global oceans. Deep-Sea Research II: Topical Studies in Oceanography 56:554-577.
- Le Quéré C, Peters G, Andres R, Andrew R, Boden T, et al. (2014) Global Carbon Budget 2013. Earth System Science Data Discussions 6:235-263.
- Lüger H, Wallace DWR, Körtzinger A, NojiriY(2004)ThepCO2 variability in the midlatitude North Atlantic Ocean during a full annual cycle. Global Biogeochem Cycles18.
- McKinley GA, Takahashi T, Buitenhius E, Chai F, Christian JF, et al. (2006) North Pacific carbon cycle response to climate variability on seasonal to decadal timescales. J Geophys Res111.
- DutkiewiczS, Follows MJ, Parekh P(2005) Interactions of the iron and phosphorus cycles: A three-dimensional model study. Global Biogeochem Cycles 19.
- Omstedt A, Gustafsson E, Wesslander K(2009) Modelling the uptake and release of carbon dioxide in the Baltic Sea surface water. Continental Shelf Res 29:870-885.
- Körtzinger A, Send U, Lampitt R S, Hartman S, Wallace DWR, et al. (2008) Seasonal pCO2 cycle at 49°N/16.5°W in the northeast Atlantic Ocean and what it tells us about biological productivity. J Geophys Res113.
- Körtzinger A, SendU, Wallace DWR, Kartensen J, DeGrandpre M (2008) Seasonal cycle of O2 and pCO2 in the central Labrador Sea: Atmospheric, biological, and physical implications. Global Biogeochem Cycles 22.
- Bennington V, McKinley GA, Dutkiewicz S, Ullman D(2009) What does chlorophyll variability tell us about export and CO2 flux variability in North Atlantic?.Global Biogeochem Cycles 23.
- McKinley GA, Fay AR, Takahashi T,Metzl N(2011) Convergence of atmospheric and North Atlantic carbon dioxide trends on multidecadal timescales. Nat Geosci 4:606-610.
- McKinley G A, FollowsMJ, Marshall J(2004) Mechanisms of air-sea CO2 fluxvariability in the equatorial Pacific and the North Atlantic. Global BiogeochemCy 18:1-14.
- Follows MJ, Dutkiewicz S, Ito T(2006)On the solution of the carbonate system in ocean biogeochemistry models. Ocean Modeling12:290-301.
- Keeling CD, Whorf TP(2005) Atmospheric CO2 records from sites in the SIO air sampling network. Trends: A Compendium of Data on Global Change. Carbon Dioxide Information Analysis Center. Oak Ridge National Laboratory, U.S. Department of Energy, Oak Ridge, Tenn, USA.
- Wanninkhof R (1992) Relationship between wind speed and gas exchange over the ocean. J Geophys Res 97:7373-7382.
- Marshall JC, Adcroft A, Hill C, Perelman L, Heisey C(1997)A finite volume, incompressible Navier-Stokes model for studies of the ocean on parallel computers. J Geophys Res102:5753-5766.
- Marshall JC, Hill C, Perelman L, Adcroft A(1997) Hydrostatic, quasi-hydrostatic, and non-hydrostatic ocean modeling. J Geophys Res102:5733-5752.
- Kalnay E,Kanamitsu M,Kistler R, Collins W,Deaven D, et al.(1996) The NCEP/NCAR 40-Year Reanalysis Project. Bulletin of the American Meteorological Society 77:437-471.
- Reynolds RW, Smith TM, Liu C, Chelton DB, Casey KS, et al.(2007) Daily high-resolution-blended analyses for sea surface temperature. J Climate 20:5473-5492.
- Gent PR, McWilliams JC(1990)Isopycnal mixing in ocean general circulation models. J PhysOceanogr 20:150-155.
- Large WG, McWilliams JC, Doney SC(1994) Oceanic vertical mixing: A review and a model with a nonlocal boundary layer parameterization. Rev Geophys 32: 363-403.
- Takahashi T, Olafsson J, Goddard J, Chipman DW, SutherlandSC(1993) Seasonal variation of CO2 and nutrients in the high-latitude surface oceans: A comparative study. Global Biogeochem Cycles7:843-878.
Citation: Benson NU, Asuquo FE (2016) Modeling Spatial and Temporal pCO2 Variability at 49°N/16.5°W and 56.5°N/52.6°W in the North Atlantic Ocean. 7: 330. DOI: 10.4172/2157-7617.1000330
Copyright: © 2016 Benson NU, et al. This is an open-access article distributed under the terms of the Creative Commons Attribution License, which permits unrestricted use, distribution, and reproduction in any medium, provided the original author and source are credited.
Select your language of interest to view the total content in your interested language
Share This Article
Recommended Journals
Open Access Journals
Article Tools
Article Usage
- Total views: 11455
- [From(publication date): 1-2016 - Sep 01, 2025]
- Breakdown by view type
- HTML page views: 10487
- PDF downloads: 968