Molecular analysis of spinal nerve sheath tumors has identified CSH1 as a candidate gene for differentiating between Schwannomatosis and Spinal schwannoma
Received: 25-Mar-2025 / Manuscript No. DPO-25-163111 / Editor assigned: 27-Mar-2025 / PreQC No. DPO-25-163111 / Reviewed: 10-Apr-2025 / QC No. DPO-25-163111 / Revised: 17-Apr-2025 / Manuscript No. DPO-25-163111 / Accepted Date: 24-Apr-2025 / Published Date: 24-Apr-2025 QI No. / DPO-25-163111
Abstract
Purpose: The most common form of schwannomatosis is defined by the presence of multiple and recurrent spinal schwannomas, which exhibit symptoms resembling those of spinal schwannomas. The molecular mechanisms responsible for tumor multiplicity in schwannomatosis remain poorly understood. This study aims to identify Differentially Expressed Genes (DEGs) between intradural spinal schwannomas and schwannomatosis and to explore the underlying mechanisms of schwannomatosis pathogenesis.
Methods: We utilized high-throughput sequencing technology to analyze 30 tumor samples (15 conventional spinal schwannomas and 15 schwannomatosis cases). Differentially expressed genes between the two groups were identified using the limma R package. Machine learning algorithms were applied to extract significant biomarkers from the DEGs. The diagnostic value of these biomarkers for schwannomatosis was assessed using Receiver Operating Characteristic (ROC) curve analysis and an alignment diagram. Gene Set Enrichment Analysis (GSEA) was employed to identify relevant biological pathways.
Results: Our analysis identified 249 DEGs, with OXTR, CSH1, SNCAIP and DPP4 emerging as key candidate genes. Subsequent q-PCR experiments confirmed the reliability of these biomarkers. Validation demonstrated that CSH1 expression was elevated in schwannomatosis samples, whereas DPP4, OXTR and SNCAIP expression levels were decreased compared to solitary schwannoma cells. ROC curve analysis and the Alignment Diagram supported the stability and accuracy of our diagnostic model. GO functional annotation and KEGG pathway enrichment analysis suggested that these DEGs are involved in biological processes related to immunity, inflammation regulation and tumorigenesis.
Conclusion: We developed a novel diagnostic model for distinguishing between schwannomatosis and spinal schwannomas. These transcriptional changes deepen our understanding of schwannomatosis pathogenesis, identify key risk factors and offer valuable insights into potential therapeutic targets.
Keywords: Spinal tumors; Schwannomatosis; Transcriptomics; Regulatory network; Genomics
Introduction
Spinal schwannomas are benign neurogenic tumors originating from Schwann cells and represent the most common primary benign tumors within the adult spinal canal, accounting for nearly one-third of all spinal tumors [1,2]. Typically, spinal schwannomas are solitary, firm, oval and lobulated tumors that arise from the nerve root [3-5].
The most common form of Schwannomatosis involves multiple and recurrent spinal schwannomas [6]. Due to limited research, Schwannomatosis is often misdiagnosed and treated as spinal schwannoma [7]. However, advancements in diagnostic and treatment technologies have increased the reported incidence of Schwannomatosis, underscoring its significant public health implications. The multilevel manifestation and uncertain recurrence patterns of Schwannomatosis have not received adequate attention, leading to increased disability and economic burden for patients as the disease progresses [8,9].
In 1973, Niimura first described and named Schwannomatosis, characterized by multiple schwannomas throughout the body without bilateral vestibular schwannomas or skin neurofibromas. In 1997, the National Institutes of Health classified Schwannomatosis as the third subtype of neurofibromatosis (NF3). The initial diagnostic criteria established in 1997 required two or more pathologically confirmed schwannomas at different body sites and no evidence of vestibular tumors on enhanced head MRI in individuals older than 18 years [6]. More stringent diagnostic criteria were introduced in 2005 and 2006 [7,10]. Schwannomatosis differs significantly from NF1 and NF2 in genetics, pathology and clinical features, with an incidence of 0.58 cases per million people per year. While 15-25% of cases are familial, the majority are sporadic [11,12].
In Schwannomatosis, central nervous system tumors, especially multiple and recurrent spinal schwannomas, are most common, occurring in up to 74% of patients. These tumors arise at different segments and locations within the spinal column, either simultaneously or at different times [8,13]. Due to their pathological similarity to conventional solitary schwannomas, distinguishing the two through pathology alone is challenging; diagnoses currently rely primarily on imaging. Clinically, misdiagnosing multilevel tumors within the spinal column poses a significant risk, potentially leading to irreversible neurological damage. Surgical removal is the gold standard for treatment but may cause permanent and severe neurological deficits due to the involvement of multiple nerves. Postoperative neurological deterioration occurs in up to 30% of patients [14].
Unfortunately, no drug therapies specifically target Schwannomatosis, highlighting the urgent need for safe and effective treatments [15]. Investigating the mechanisms underlying Schwannomatosis to predict, identify and explore new drug applications is critical. In this study, we selected tumor samples from solitary spinal schwannomas and Schwannomatosis for large-scale sequencing to observe gene expression related to the multiplicity of spinal schwannomas. Our goal was to evaluate the diagnostic value of these genes in differentiating solitary from multiple schwannomas and to investigate the mechanisms driving the multiplicity of schwannomas within the spinal canal.
Materials and Methods
Sample sources
This study complies with the ethical principles outlined in the 1975 Declaration of Helsinki. Approval was obtained from the Ethics Committee of the Third Hospital of Hebei Medical University and all participants provided written informed consent upon registration and were informed about the study details. Tumor tissue samples were collected from patients who had undergone surgery for spinal canal neurofibromas at the Third Hospital of Hebei Medical University, totaling 30 cases (15 with Schwannomatosis and 15 with Spinal Schwannoma).
Inclusion criteria:
1. Age over 18 years.
2. No tumors in locations other than the spinal schwannoma.
3. For Schwannomatosis samples, none met the existing diagnostic criteria for NF2 and had two or more pathologically confirmed schwannomas in different spinal segments within the spinal canal [16,17].
4. For spinal schwannoma samples, solitary tumors of the spinal cord with the pathological type of nerve sheath tumor and no recurrence within three years.
5. All cases were treated surgically, with complete tumor resection, no visible tumor residue in the surgical field and postoperative imaging confirming complete resection [12].
6. No significant differences in age or gender between the two groups and none of the patients had received drug treatment for neurofibromas.
The collected samples were categorized as follows: the spinal neurofibroma group as the case group and the neurofibromatosis group as the control group.
mRNA Library sequencing, preparation and screening
Total RNA was extracted from samples using Trizol reagent and mRNA was isolated. The concentration and purity of the extracted RNA were assessed using a Nanodrop 2000 spectrophotometer and RNA integrity was checked using agarose gel electrophoresis and an Agilent 2100 for RIN value determination. RNA was fragmented using ultrasonication and the concentration and purity were reassessed using Nanodrop 2000. RNA integrity was re-evaluated with agarose gel electrophoresis and the RIN value was measured again using Agilent 2100. For library preparation, a total RNA amount of 5 μg with a concentration of ≥ 200 ng/μL and an OD260/280 ratio between 1.8 and 2.2 was required. The fragmented mRNA was reverse transcribed to produce cDNA. The cDNA fragments underwent end repair and PCR amplification to construct the library, which was then sequenced on a HiSeq 4000 (Illumina, USA). Data filtering was performed using trigalore (version 0.6.6) and cutadapt (v3.4 with Python 3.9.4); data quality control was conducted with FastQC (v0.11.5) and MultiQC (v1.10.1).
Using the human gene annotation file GRCh38 (hg38) as a reference genome, RNA-seq analysis was performed with the Hisat2+ Feature Counts pipeline to obtain a transcript expression matrix. Two-dimensional principal component analysis and hierarchical clustering were conducted to compare similarities and differences between the experimental and control groups. The RNA-seq data were normalized using DESeq2 software.
The over-representation analysis of DEGS
To perform GO and KEGG enrichment analysis of Differentially Expressed Genes (DEGs), Over-Representation Analysis (ORA) was used. Functional annotation of DEGs was conducted using online databases for annotation, visualization, and integrated discovery, including DAVID (version 6.8) and the Kyoto Encyclopedia of Genes and Genomes (KEGG) pathways. Gene Ontology (GO) analysis was performed to explore the Biological Processes (BP), Cellular Components (CC) and Molecular Functions (MF) associated with the predicted targets.
The expression constructing a Protein-Protein Interaction (PPI) network
To study interactions between proteins and evaluate genes within the Protein-Protein Interaction (PPI) network, we constructed the network and performed correlation analysis. Overlapping target detection between candidate target genes and Differentially Expressed Genes (DEGs) was conducted using Venny 2.0 to identify critical target genes. The PPI network was built using the STRING database and various network parameters, including Betweenness Centrality (BC), Closeness Centrality (CC), Degree (De) and Topological Coefficient (TC), were calculated. Critical genes were selected as key targets based on the highest degree values.
Identification of potential diagnostic biomarkers for schwannomatosis
To further assess the accuracy of the genes identified from the PPI analysis, we performed LASSO logistic regression on the candidate genes selected from the PPI results across all sequencing samples. Feature selection was conducted using the glmnet package in R software. Additionally, we constructed a machine learning model using the genes from the PPI analysis, with the entire sequencing dataset as input. The SVM-RFE method was employed to rank features within the dataset. By intersecting the results from both algorithms, we identified more accurate biomarkers.
Identification of potential diagnostic biomarkers
Next, we employed machine learning methods to construct a diagnostic model and evaluated its accuracy using an Alignment Diagram. The model's goodness-of-fit was assessed with the Hosmer- Lemeshow test and its diagnostic value was determined through the area under the receiver operating characteristic (AUC-ROC) curve. Genes with AUCs greater than 0.7 were further explored as potential diagnostic biomarkers for neurofibroma recurrence.
qPCR
Total RNA was extracted following the Trizol protocol and complementary DNA (cDNA) was synthesized using the PrimeScript RT Master Mix kit (Takara, RR036A). Each cDNA sample was diluted 20-fold and used as a template for quantitative real-time PCR (qRT-PCR) with SYBR Green Master Mix (Thermo Fisher Scientific, A25742). The qRT-PCR was performed in a 10 μl reaction volume using the Applied Biosystems® ViiA7 Real-Time PCR System (Thermo Fisher Scientific, USA). Each reaction was conducted in triplicate. The qRT-PCR procedure was as follows: initial denaturation at 95 °C for 30 seconds, followed by 40 cycles of 95 °C for 10 seconds, 60 °C for 20 seconds and 72 °C for 20 seconds. The relative expression levels of the selected genes were calculated using the 2−ΔΔCT method.
Gene set enrichment analysis
Enrichment analysis was conducted using GSEA software (version 4.1.0) to identify biological processes associated with these genes. Genes were ranked based on their differential expression between the two sample types, typically using Fold Change. Predefined gene sets (h.all.v7.5.1.symbols.gmt and c5.all.v7.5.1.symbols.gmt) were tested for enrichment at the top or bottom of this ranked list.
Results
Clinical Characteristics and Outcomes of the Patients
The clinical characteristics of 15 patients with Schwannomatosis are summarized in Table 1. The cohort comprised 9 males and 6 females, with an average age of 50.6 years (median 54 years, range 23-67 years). The most common symptoms included muscular weakness, pain and numbness. Two patients (Case 9 and Case 14) had recurrent spinal neurofibromas, while the remaining 13 patients had multiple spinal neurofibromas. All patients underwent complete tumor resection and spinal reconstruction surgery. Follow-up showed that 3 patients experienced worsening symptoms, whereas 10 patients demonstrated improvement. As of July 2024, all patients are alive (Table 1).
Table 1: Clinical Characteristics of 15 Patients with Spinal Schwannomatosis.
Selection of differentially expressed genes and construction of the PPI network
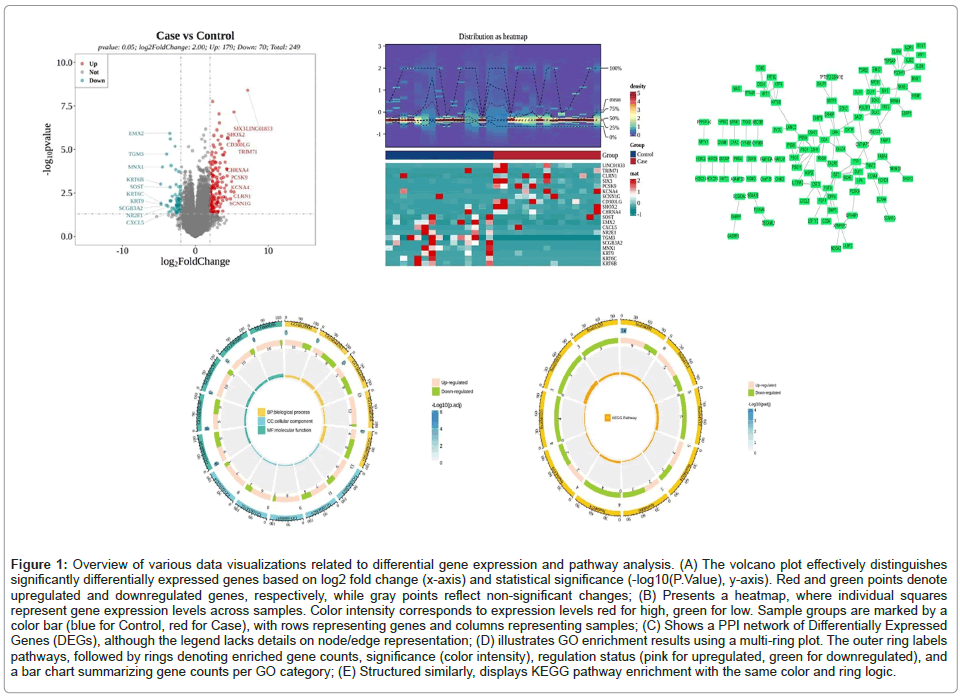
Based on the criteria, a total of 249 Differentially Expressed Genes (DEGs) were identified between the experimental and control groups. Among these, 179 genes were upregulated in the Case group and 70 genes were downregulated. To visualize these DEGs, we created a volcano plot using ggplot2 to display the top 10 upregulated and downregulated DEGs and used ComplexHeatmap to show the expression patterns of these genes. The STRING database results were imported into Cytoscape to construct a Protein-Protein Interaction (PPI) network, which comprised 114 nodes and 143 edges. To ensure that biomarkers were expressed in all sequencing samples, we filtered the PPI results to select genes with non-zero expression across all samples. This filtering yielded 8 genes: PRG4, FABP7, OXTR, CSH1, SNCAIP, CD24, GJB2 and DPP4. Compared to the control group, CSH1 and CD24 were upregulated, while PRG4, FABP7, OXTR, SNCAIP, GJB2 and DPP4 were downregulated. These 8 genes were defined as key targets. Associated with inflammation and tumor progression pathways
Over-Representation Analysis show: The GO enrichment results revealed a total of 2,660 enriched GO pathways, including 2,124 in Biological Process (BP), such as forebrain development (GO:0030900), multi-organism reproductive process (GO:0044703), multicellular organismal process (GO:0044706), embryonic organ development (GO:0048568)et.(Figure 4) KEGG enrichment analysis showed that DEGs were primarily enriched in pathways related to neuroactive ligand-receptor interaction (hsa04080), PI3K-Akt signaling pathway (hsa04151), ECM-receptor interaction (hsa04512), cytokine-cytokine receptor interaction (hsa04060) and cAMP signaling pathway (hsa04024).
These pathways are involved in regulating immune and inflammatory functions. The outermost circle represents the IDs of the pathways. The second circle shows the number of enriched genes, with the color intensity representing the significance of the enrichment. The third circle indicates the number of upregulated and downregulated genes, with pink representing upregulated genes and green representing downregulated genes. The fourth circle is a bar chart where the y-axis represents the number of enriched genes, and different colors correspond to the three parts of the GO analysis (Figures 1A-1E).
Figure 1: Overview of various data visualizations related to differential gene expression and pathway analysis. (A) The volcano plot effectively distinguishes significantly differentially expressed genes based on log2 fold change (x-axis) and statistical significance (-log10(P.Value), y-axis). Red and green points denote upregulated and downregulated genes, respectively, while gray points reflect non-significant changes; (B) Presents a heatmap, where individual squares represent gene expression levels across samples. Color intensity corresponds to expression levels red for high, green for low. Sample groups are marked by a color bar (blue for Control, red for Case), with rows representing genes and columns representing samples; (C) Shows a PPI network of Differentially Expressed Genes (DEGs), although the legend lacks details on node/edge representation; (D) illustrates GO enrichment results using a multi-ring plot. The outer ring labels pathways, followed by rings denoting enriched gene counts, significance (color intensity), regulation status (pink for upregulated, green for downregulated), and a bar chart summarizing gene counts per GO category; (E) Structured similarly, displays KEGG pathway enrichment with the same color and ring logic.
Machine learning methods for screening candidate biomarkers
To identify key feature genes, we performed LASSO logistic regression analysis on the 8 candidate genes obtained from the PPI screening of all sequenced samples.
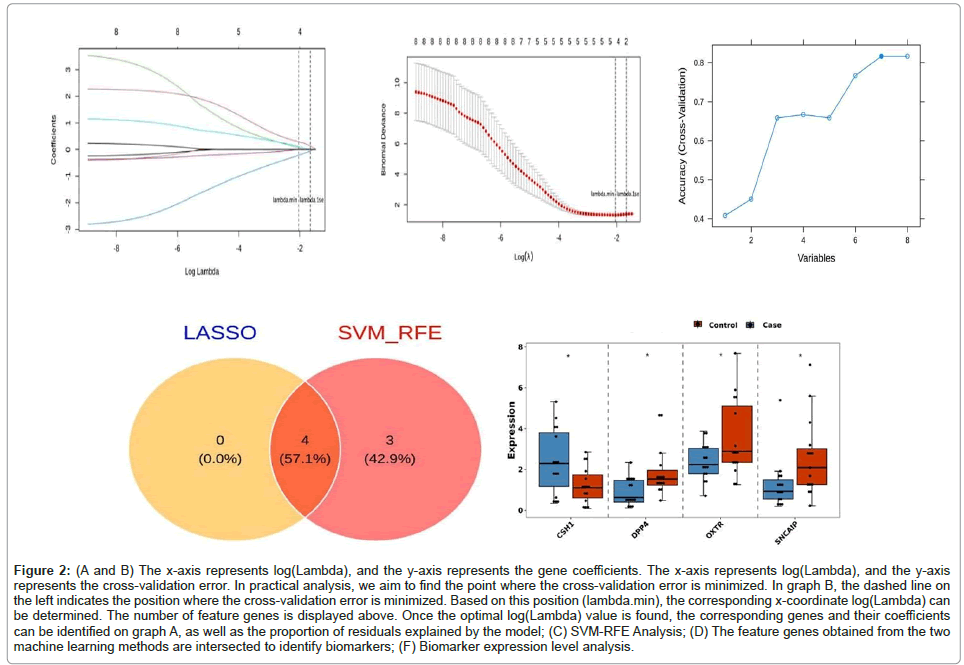
Using the glmnet package in R with the family parameter set to binomial, we generated two graphs: one displaying the gene coefficients and another showing the cross-validation error (Figure 2A and 2B). The optimal model was identified with log(lambda.min)= -2.038655 and log(lambda.1se)= -1.66652, which revealed 4 feature genes: OXTR, CSH1, SNCAIP and DPP4.
Figure 2: (A and B) The x-axis represents log(Lambda), and the y-axis represents the gene coefficients. The x-axis represents log(Lambda), and the y-axis represents the cross-validation error. In practical analysis, we aim to find the point where the cross-validation error is minimized. In graph B, the dashed line on the left indicates the position where the cross-validation error is minimized. Based on this position (lambda.min), the corresponding x-coordinate log(Lambda) can be determined. The number of feature genes is displayed above. Once the optimal log(Lambda) value is found, the corresponding genes and their coefficients can be identified on graph A, as well as the proportion of residuals explained by the model; (C) SVM-RFE Analysis; (D) The feature genes obtained from the two machine learning methods are intersected to identify biomarkers ; (F) Biomarker expression level analysis.
Similarly, we constructed a machine learning model using the 8 genes from the PPI screening and the full dataset of sequenced samples. The SVM-RFE method was used to rank features and the model's accuracy was highest when the number of feature variables was 7. The top 7 candidate biomarkers identified were DPP4, SNCAIP, CD24, CSH1, OXTR, GJB2 and FABP7.
To determine the final biomarkers, we intersected the feature genes identified by both machine learning methods. This analysis identified 4 biomarkers: OXTR, CSH1, SNCAIP and DPP4. The Venn diagram illustrates the similarities and differences between the two algorithms, enhancing the credibility of the biomarker screening. For visual representation, box plots of the biomarker expression levels in the experimental and control groups were created using the ggplot2 package in R (Figures 2A-2E). Alignment diagram and receiver operating characteristic
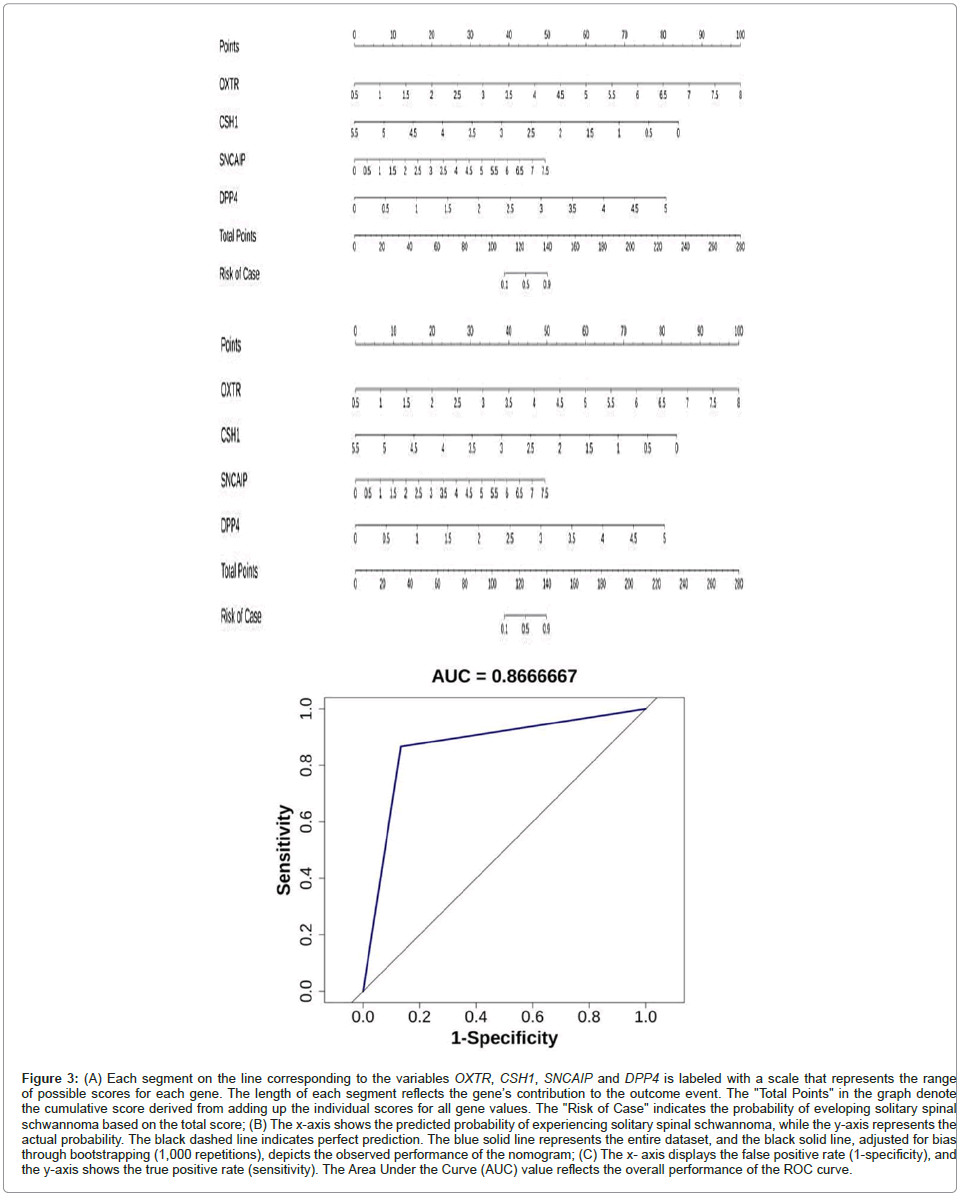
In this study, we used the expression levels of 4 biomarkers (OXTR, CSH1, SNCAIP and DPP4) across all sequenced samples to construct a nomogram model for predicting the risk of solitary spinal schwannoma. The nomogram was developed using the R package "rms" and is designed to aid in diagnosing and forecasting the likelihood of developing solitary spinal schwannoma (Figures 3A-3C).
Figure 3: (A) Each segment on the line corresponding to the variables OXTR, CSH1, SNCAIP and DPP4 is labeled with a scale that represents the range of possible scores for each gene. The length of each segment reflects the gene’s contribution to the outcome event. The "Total Points" in the graph denote the cumulative score derived from adding up the individual scores for all gene values. The "Risk of Case" indicates the probability of eveloping solitary spinal schwannoma based on the total score; (B) The x-axis shows the predicted probability of experiencing solitary spinal schwannoma, while the y-axis represents the actual probability. The black dashed line indicates perfect prediction. The blue solid line represents the entire dataset, and the black solid line, adjusted for bias through bootstrapping (1,000 repetitions), depicts the observed performance of the nomogram; (C) The x- axis displays the false positive rate (1-specificity), and the y-axis shows the true positive rate (sensitivity). The Area Under the Curve (AUC) value reflects the overall performanc e of the ROC curve.
q-PCR
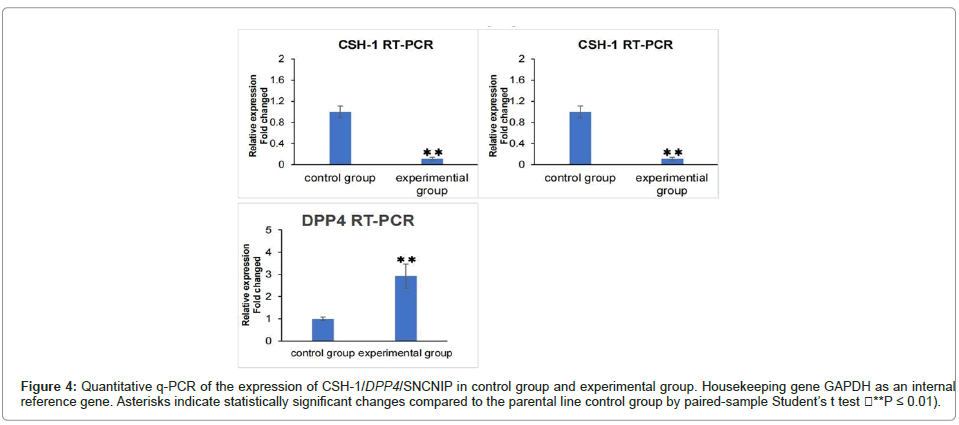
We take 3 samples from each of the experimental group and the control group for q-pcr testing, q-PCR validation of DEGs in the experimental and control groups. The expression of CSH1 gene is upregulated in the schwannomatosis group. The expression of DPP4 and SNCNIP is as decrease in the schwannomatosis group. This manifestation is consistent with our sequencing results. But the expression of OXTR showed opposite results in the qPCR experiments compared to the sequencing results (Figure 4).
Figure 4: Quantitative q-PCR of the expression of CSH-1/DPP4/SNCNIP in control group and experimental group. Housekeeping gene GAPDH as an internal reference gene. Asterisks indicate statistically significant changes compared to the parental line control group by paired-sample Student’ s t test (**P ≤ 0.01).
GSEA revealed the potential roles of relevant genes in the spinal canal
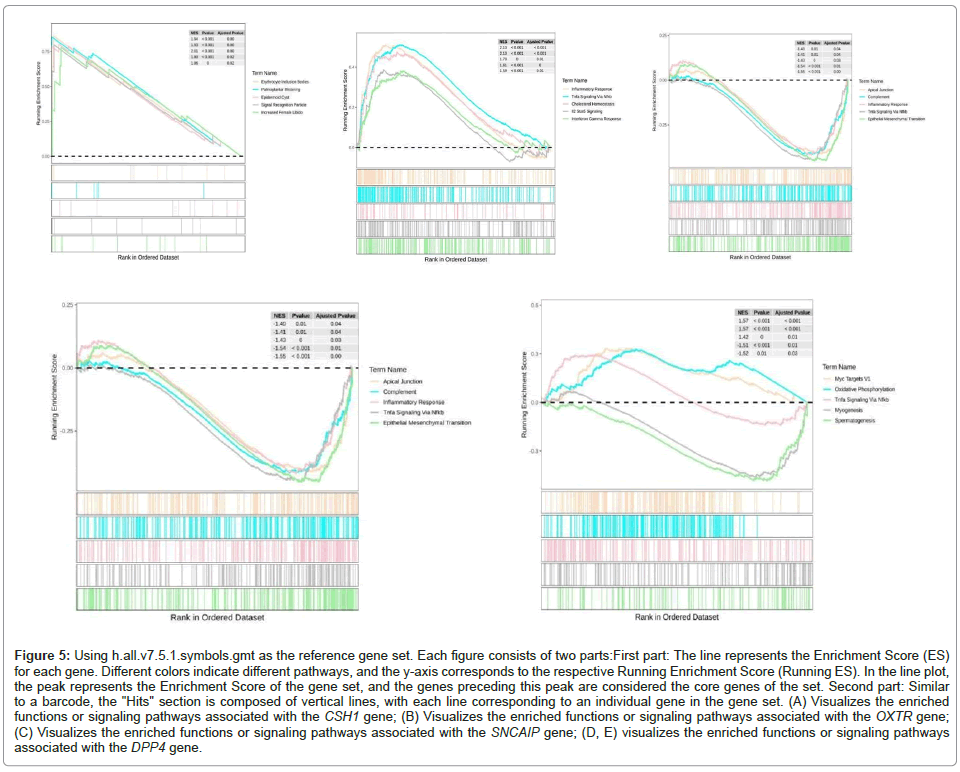
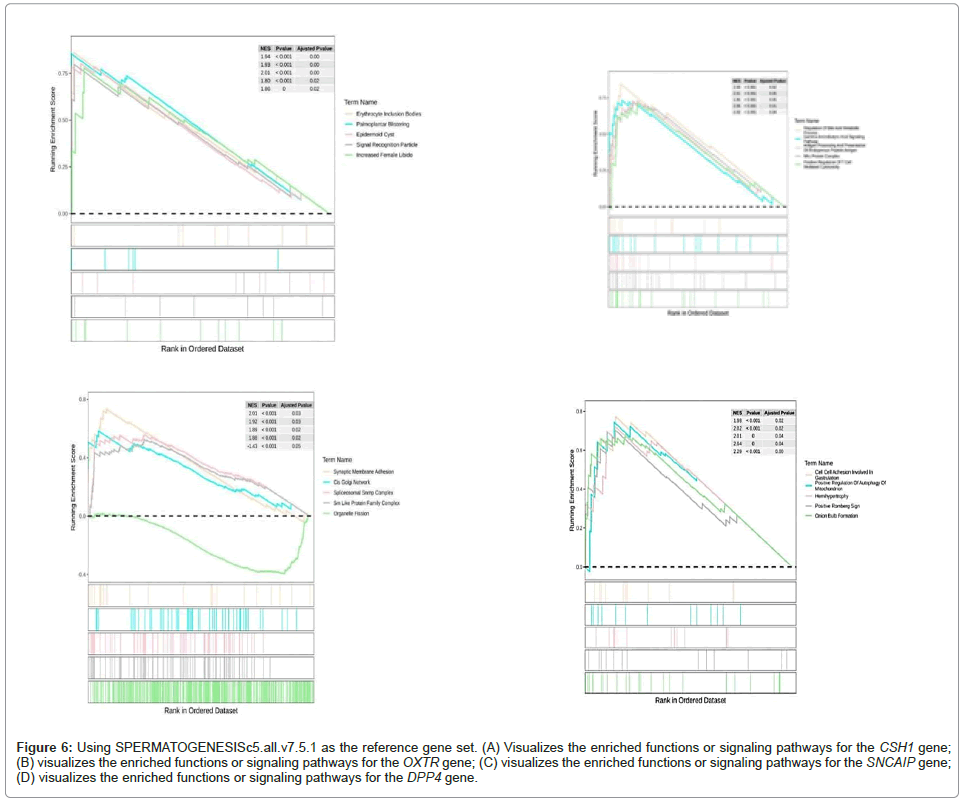
Next, we explored the roles of OXTR, CSH1, SNCAIP and DPP4 in the recurrence of intraspinal schwannomas using GSEA method. Based on the expression levels of each gene, we analyzed their relevant biological behaviors (Figures 5A-5E and 6A-6D).
Figure 5: Using h.all.v7.5.1.symbols.gmt as the reference gene set. Each figure consists of two parts:First part: The line represents the Enrichment Score (ES) for each gene. Different colors indicate different pathways, and the y-axis corresponds to the respective Running Enrichment Score (Running ES). In the line plot, the peak represents the Enrichment Score of the gene set, and the genes preceding this peak are considered the core genes of the set. Second part: Similar to a barcode, the "Hits" section is composed of vertical lines, with each line corresponding to an individual gene in the gene set. (A) Visualizes the enriched functions or signaling pathways associated with the CSH1 gene; (B) Visualizes the enriched functions or signaling pathways associated with the OXTR gene; (C) Visualizes the enriched functions or signaling pathways associated with the SNCAIP gene; (D, E) visualizes the enriched functions or signaling pathways associated with the DPP4 gene.
Figure 6: Using SPERMATOGENESISc5.all.v7.5.1 as the reference gene set. (A) Visualizes the enriched functions or signaling pathways for the CSH1 gene; (B) visualizes the enriched functions or signaling pathways for the OXTR gene; (C) visualizes the enriched functions or signaling pathways for the SNCAIP gene; (D) visualizes the enriched functions or signaling pathways for the DPP4 gene.
Discussion
The pathogenesis of schwannomatosis remains unresolved. Previous research has identified mutations in the LZTR1 or SMARCB1 genes in 86% of familial cases and 40% of sporadic cases of schwannomatosis [9,17,18]. Tumor development in schwannomatosis often involves mutations in multiple tumor suppressor genes, frequently mediated by large heterozygous deletions on chromosome 22q. These deletions typically encompass SMARCB1, LZTR1 and the NF2 gene [13,19]. The combined loss of these tumor suppressor genes leads to variations in 22q fragments, which are associated with the development of schwannomatosis [20-22]. However, clear pathogenic mutations are often absent in most sporadic cases of schwannomatosis [23,24].
This study aims to elucidate the molecular differences between schwannomatosis and spinal schwannomas, assess the diagnostic value of candidate genes for schwannomatosis and analyze potential pathophysiological mechanisms underlying the multiplicity and recurrence of spinal schwannomas. Using sequencing on the Illumina platform, we identified 249 Differentially Expressed Genes (DEGs) between the experimental and control groups, with 70 genes upregulated and 179 downregulated. Through PPI analysis and other machine learning techniques, we highlighted OXTR, CSH1, SNCAIP and DPP4 as key genes associated with the disease. The diagnostic model constructed with Alignment Diagram and ROC analysis validated these genes, suggesting their collective role in the development of multiple intramedullary schwannomas.
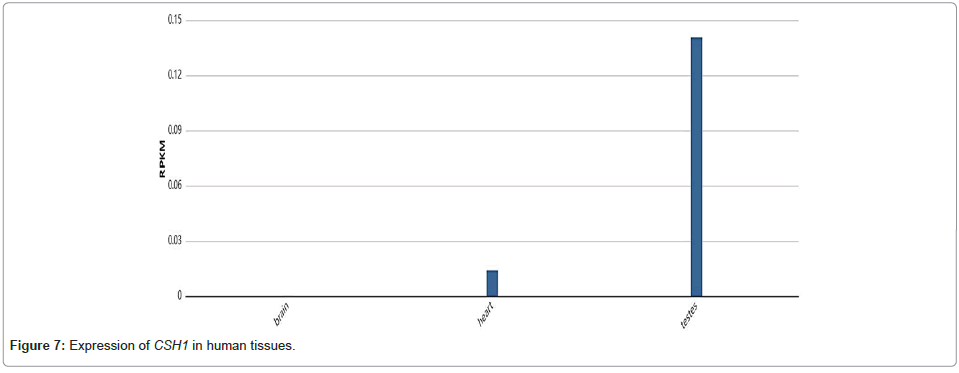
Quantitative PCR (qPCR) results revealed elevated expression of CSH1 in schwannomatosis. CSH1 encodes chorionic somatomammotropin hormone 1 (CSH1), a hormone secreted by placental cells during pregnancy. This protein, produced in the placenta of higher primates, including humans, regulates various metabolic processes during pregnancy [25]. The CSH1 gene is located on human chromosome 17 and is part of the same family as Growth Hormone (GH) and Prolactin (PRL). These hormones influence breast growth, milk secretion and response to other hormones [26,27]. While CSH1 plays a crucial role during normal pregnancy by regulating maternal metabolism and stimulating insulin production, its expression is generally low or absent in non-pregnant states. Data from the National Center for Biotechnology Information (NCBI) (PRJEB2445) show that CSH1 expression is minimal in the normal human nervous system (Figure 5). However, CSH1 has been found to be overexpressed in various tumor cells, including choriocarcinoma [28]. The increased expression of CSH1 in schwannomatosis may provide insights into its role in the multiplicity of intramedullary schwannomas (Figure 7).
DEGs were analyzed using KEGG and GO enrichment analyses, which highlighted potential links to immune regulation and inflammatory responses. Key pathways such as Neuroactive Ligand-Receptor Interaction and the PI3K-Akt signaling pathway were identified as central to signal transduction, immune-inflammatory responses, and tumor development. Gene Set Enrichment Analysis (GSEA) further underscored the importance of pathways like PI3K/Akt and mTOR. The PI3K/Akt signaling pathway is critical in numerous physiological processes and plays a pivotal role in disease development, particularly tumors. mTOR, a downstream protein of this pathway, exists in two complexes, mTORC1 and mTORC2 and regulates cellular functions such as transcription, translation, and proliferation through downstream targets like 4E-BP1 and p70S6K. Aberrant activation of mTOR is associated with tumor progression, as seen in gliomas and breast cancer [29,30].
GSEA results for the biomarkers OXTR, CSH1, SNCAIP and DPP4 revealed significant associations with immune and inflammatory pathways. Notably, the CSH1 gene, which is highly expressed in schwannomatosis, appears to influence the PI3K-Akt-mTOR pathway. This gene may contribute to abnormal mTOR activation, potentially serving as a common risk factor for schwannomatosis [31]. Therefore, the occurrence of multiple intradural schwannomas in schwannomatosis may be driven by factors associated with the PI3K-Akt signaling pathway and neuroactive ligand-receptor interactions, among other inflammatory responses.
Currently, the treatment of schwannomatosis primarily involves surgical intervention [32]. Surgical resection is indicated for cases with spinal cord compression or symptoms related to schwannomas, such as pain or sensory-motor abnormalities, with the goal of controlling symptoms and preserving neurological function [33,34]. However, the surgical management of nerve tumors often risks nerve function damage. There are no established guidelines for radiotherapy, chemotherapy, or targeted therapy in schwannomatosis patients [15]. For patients with extensive spinal schwannomas or very rare malignant schwannomas that are not amenable to surgery, targeted therapies are still under investigation [35,36]. Research into candidate genes and associated pathways like PI3K-Akt may offer insights into potential therapeutic targets. Drugs such as mTOR inhibitors, including Everolimus (RAD001), MLN0128 and AZD014, have been extensively studied for their effects in hematological cancers and solid tumors. However, there is no precedent for their use in schwannomatosis and further research is needed [37,38].
Conclusion
This study aims to elucidate the molecular relationships between spinal schwannomas and schwannomatosis, develop diagnostic models and identify candidate genes while exploring the mechanisms underlying multiple schwannomas. Clinical application and measurement of these biomarkers require further investigation. Future research should validate the roles of these genes and related pathways through RNA interference, overexpression studies and pathway inhibition at both cellular and animal levels. Targeting relevant pathways could potentially provide new therapeutic strategies for patients with multiple schwannomas who are not suitable candidates for surgical treatment.
Declarations
Acknowledgements
The authors would like to thank the participants and GEO Project for its valuable contributions to this research.
Data Availability
Data is provided within the manuscript.
Author Contributions Statement
F.L. solely conducted the bioinformatics analysis, performed RTqPCR validation, analyzed the data and wrote the manuscript. She identified and validated the differentially expressed genes associated with cardiovascular risk in ESRD patients, contributing all aspects of this research.
Conflict of Interests
The authors declare no conflicts of interest regarding the publication of this paper.
Ethics Statement
Not applicable.
Funding Statement
None.
Clinical Trial Number
Not applicable (Since the study used leftover blood samples from patients for testing and we have signed informed consent forms and obtained approval from the hospital's ethics committee, an application for clinical trial is not applicable).
Data Availability-
The data presented in this study are openly available in the GEO database (https://www.ncbi.nlm.nih.gov/geo/).
References
- Takahashi T, Hirai T, Yoshii T, Inose H, Yuasa M, et al. (2023) Risk factors for recurrence and regrowth of spinal schwannoma. J Orthopaedic Sci 28:554-559.
[Crossref] [Google Scholar] [PubMed]
- El-Hajj VG, Segerlind JP, Sandersjöö AF, Edström E, Terander AE, et al. (2022) Current knowledge on spinal meningiomas epidemiology, tumor characteristics and non-surgical treatment options: A systematic review and pooled analysis (Part 1). Cancers (Basel) 14:6251.
[Crossref] [Google Scholar] [PubMed]
- Kurtkaya-Yapicier O, Scheithauer BW, Woodruff J (2003) The pathobiologic spectrum of Schwannomas. Histol Histopathol 18:925-934.
[Crossref] [Google Scholar] [PubMed]
- Scheithauer BW, Woodruff JM, Spinner RJ (2010) Peripheral nerve sheath tumors. Pract Surg Neuropathol 1:235-285.
- Traul DE, Shaffrey ME, Schiff D (2007) Part I: Spinal-cord neoplasms intradural neoplasms. Lancet Oncol 8:35-45.
[Crossref] [Google Scholar] [PubMed]
- Jacoby LB, Jones D, Davis K, Kronn D, Short MP, et al. (1997) Molecular analysis of the NF2 tumor-suppressor gene in schwannomatosis. Am J Hum Genet 61:1293-1302.
[Crossref] [Google Scholar] [PubMed]
- MacCollin M, Chiocca E, Evans D, Friedman J, Horvitz R, et al. (2005) Diagnostic criteria for schwannomatosis. Neurology 64:1838-1845.
[Crossref] [Google Scholar] [PubMed]
- Thomas AK, Egelhoff JC, Curran JG, Thomas B (2016) Pediatric schwannomatosis, a rare but distinct form of neurofibromatosis. Pediatr Radiol 46:430-435.
[Crossref] [Google Scholar] [PubMed]
- Kehrer-Sawatzki H, Farschtschi S, Mautner VF, Cooper DN (2017) The molecular pathogenesis of schwannomatosis, a paradigm for the co-involvement of multiple tumour suppressor genes in tumorigenesis. Hum Genet 136:129-148.
[Crossref] [Google Scholar] [PubMed]
- Baser ME, Friedman J, Evans DGR (2006) Increasing the specificity of diagnostic criteria for schwannomatosis. Neurology 66:730-732.
[Crossref] [Google Scholar] [PubMed]
- Evans DG, Hartley CL, Smith PT, King AT, Bowers NL, et al. (2020) Incidence of mosaicism in 1055 de novo NF2 cases: Much higher than previous estimates with high utility of next-generation sequencing. Genet Med 22:53-59.
[Crossref] [Google Scholar] [PubMed]
- Tamura R (2021) Current understanding of neurofibromatosis type 1, 2 and schwannomatosis. Int J Mol Sci 22:5850.
[Crossref] [Google Scholar] [PubMed]
- Jacoby LB, MacCollin M, Parry DM, Kluwe L, Lynch J, et al. (1999) Allelic expression of the NF2 gene in neurofibromatosis 2 and schwannomatosis. Neurogenetics 2:101-108.
[Crossref] [Google Scholar] [PubMed]
- Merker VL, Esparza S, Smith MJ, Rachamimov AS, Plotkin SR, et al. (2012) Clinical features of schwannomatosis: A retrospective analysis of 87 patients. Oncol 17:1317-1322.
[Crossref] [Google Scholar] [PubMed]
- BushML, Oblinger J, Brendel V, Santarelli G, Huang J, et al. (2011) AR42, a novel histone deacetylase inhibitor, as a potential therapy for vestibular schwannomas and meningiomas. Neuro Oncol 13:983-999.
[Google Scholar] [PubMed]
- Smith MJ, Isidor B, Beetz C, Williams SG, Bhaskar SS, et al. (2015) Mutations in LZTR1 add to the complex heterogeneity of schwannomatosis. Neurology 84:141-147.
[Crossref] [Google Scholar] [PubMed]
- Plotkin SR, Wick A (2018) Neurofibromatosis and schwannomatosis. Semin Neurol 38:073-085.
[Crossref] [Google Scholar] [PubMed]
- Louvrier C, Pasmant E, Briand-Suleau A, Cohen J, Nitschké P, et al. (2018) Targeted next-generation sequencing for differential diagnosis of neurofibromatosis type 2, schwannomatosis and meningiomatosis. Neuro Oncol 20:917-929.
[Crossref] [Google Scholar] [PubMed]
- Mansouri S, Suppiah S, Mamatjan Y, Paganini I, Liu JC, et al. (2021) Epigenomic, genomic and transcriptomic landscape of schwannomatosis. Acta neuropathol 141:101-116.
[Crossref] [Google Scholar] [PubMed]
- Antinheimo J, Sankila R, Carpen O, Pukkala E, Sainio M, et al. (2000) Population-based analysis of sporadic and type 2 neurofibromatosis-associated meningiomas and schwannomas. Neurology 54:71-71.
[Crossref] [Google Scholar] [PubMed]
- Piotrowski A, Koczkowska M, Poplawski AB, Bartoszewski R, Króliczewski J, et al. (2022) Targeted massively parallel sequencing of candidate regions on chromosome 22q predisposing to multiple schwannomas: An analysis of 51 individuals in a single‐center experience. Hum Mutat 43:74-84.
[Crossref] [Google Scholar] [PubMed]
- Caltabiano R, Magro G, Polizzi A, Praticò AD, Ortensi A, et al. (2017) A mosaic pattern of INI1/SMARCB1 protein expression distinguishes Schwannomatosis and NF2-associated peripheral schwannomas from solitary peripheral schwannomas and NF2-associated vestibular schwannomas. Childs Nerv Syst 33:933-940.
[Crossref] [Google Scholar] [PubMed]
- Sestini R, Bacci C, Provenzano A, Genuardi M, Papi L, et al. (2008) Evidence of a four‐hit mechanism involving SMARCB1 and NF2 in schwannomatosis‐associated schwannomas. Hum Mutat 29:227-231.
[Crossref] [Google Scholar] [PubMed]
- Swensen J, Keyser J, Coffin C, Biegel J, Viskochil D, et al. (2009) Familial occurrence of schwannomas and malignant rhabdoid tumour associated with a duplication in SMARCB1. J Med Genet 46:68-72.
[Crossref] [Google Scholar] [PubMed]
- Adu-Gyamfi EA, Salamah J, Cheeran EA, Lee BK (2024) Bisphenol S moderately decreases the expression of syncytiotrophoblast marker genes and induces apoptosis in human trophoblast lineages. Environ Pollut 343:123259.
[Crossref] [Google Scholar] [PubMed]
- Chang CW, Sung YW, Hsueh YW, Chen YY, Ho M, et al. (2022) Growth hormone in fertility and infertility: Mechanisms of action and clinical applications. Front Endocrinol 13:1040503.
[Crossref] [Google Scholar] [PubMed]
- Hivert MF, White F, Allard C, James K, Majid S, et al. (2024) Placental IGFBP1 levels during early pregnancy and the risk of insulin resistance and gestational diabetes. Nat Med 1-7.
[Crossref] [Google Scholar] [PubMed]
- Marsh B, Zhou Y, Kapidzic M, Fisher S, Blelloch R, et al. (2022) Regionally distinct trophoblast regulate barrier function and invasion in the human placenta. Elife 11:e78829.
[Crossref] [Google Scholar] [PubMed]
- Choe G, Horvath S, Cloughesy TF, Crosby K, Seligson D, et al. (2003) Analysis of the phosphatidylinositol 3′-kinase signaling pathway in glioblastoma patients in vivo. Cancer Res 63:2742-2746.
[Google Scholar] [PubMed]
- Smith MJ, O'Sullivan J, Bhaskar SS, Hadfield KD, Poke G, et al. (2013) Loss-of-function mutations in SMARCE1 cause an inherited disorder of multiple spinal meningiomas. Nat Genet 45:295-298.
[Crossref] [Google Scholar] [PubMed]
- Chen Z, Li S, Mo J, Hawley E, Wang Y, et al. (2020) Schwannoma development is mediated by Hippo pathway dysregulation and modified by RAS/MAPK signaling. JCI insight 5:141514.
[Crossref] [Google Scholar] [PubMed]
- Hernandez RN, Kirnaz S, Schmidt F, Härtl R (2021) Minimally invasive surgery for intradural tumors. Tumors Spinal Canal 10:181-200.
- Su X, Shi W, Huang QF, Shen JH, Chen J, et al. (2012) Hemi-semi laminectomy approach for the microsurgical treatment of spinal schwannomas. Chin Med Sci J 27:96-100.
[Google Scholar] [PubMed]
- Gonzalvo A, Fowler A, Cook RJ, Little NS, Wheeler H, et al. (2011) Biggs, Schwannomatosis, sporadic schwannomatosis and familial schwannomatosis: A surgical series with long-term follow-up. J neurosurg 114:756-762.
[Crossref] [Google Scholar] [PubMed]
- Miricescu D, Totan A, Stanescu-Spinu II, Badoiu SC, Stefani Cet al. (2020) PI3K/AKT/mTOR signaling pathway in breast cancer: From molecular landscape to clinical aspects. Int J Mol Sci 22:173.
[Crossref] [Google Scholar] [PubMed]
- Zou Z, Tao T, Li H, Zhu X (2020) mTOR signaling pathway and mTOR inhibitors in cancer: Progress and challenges. Cell Biosci 10:31.
- Li H, Prever L, Hirsch E, Gulluni F (2021) Targeting PI3K/AKT/mTOR signaling pathway in breast cancer. Cancers (Basel) 13:3517.
[Crossref] [Google Scholar] [PubMed]
- Plotkin SR, Blakeley JO, Evans DG, Hanemann CO, Hulsebos TJ, et al. (2013) Update from the 2011 International Schwannomatosis Workshop: From genetics to diagnostic criteria. Am Med Genet 161:405-416.
[Crossref] [Google Scholar] [PubMed]
Citation: Shi G, Ren H, Zhao D, Zhao Q, Chen H, et al. (2025) Molecular Analysis of Spinal Nerve Sheath Tumors has Identified CSH1 as a Candidate Gene for Differentiating between Schwannomatosis and Spinal schwannoma. Diagnos Pathol Open 10:247.
Copyright: © 2025 Shi G, Ren H, Zhao D, Zhao Q, Chen H, et al. This is an openaccess article distributed under the terms of the Creative Commons Attribution License, which permits unrestricted use, distribution and reproduction in any medium, provided the original author and source are credited.
Select your language of interest to view the total content in your interested language
Share This Article
Open Access Journals
Article Usage
- Total views: 956
- [From(publication date): 0-0 - Dec 22, 2025]
- Breakdown by view type
- HTML page views: 810
- PDF downloads: 146
