Optimal Satellite Sensor Selection Utilized to Monitor the Impact of UrbanSprawl on the Thermal Environment in Doha City, Qatar
Received: 22-Nov-2015 / Accepted Date: 19-Jan-2016 / Published Date: 22-Jan-2016 DOI: 10.4172/2157-7617.1000326
Abstract
In the present study, the most appropriate Landsat and ASTER Image spatial and spectral resolutions were selected to extract thermal infrared data in Doha City, Qatar from 1990-2015. Results indicated Urban Heat Island (UHI) calculated from Landsat sensor data was more consistent with ground truthed temperatures. Landsat TM thermal infrared data with low spatial resolution (60-120 m) was more appropriate for large-scale thermal studies, but was not suitable to assess complex urban thermal environments and establish Land Surface Temperatures (LSTs) for individual buildings. However, ASTER sensor, with a Thermal Infrared (TIR) subsystem of 90 m spatial resolution, showed more accurate determination of thermal patterns and LSTs. Landsat data revealed relatively high temperatures, which exhibited increased congruence with ground truthed measures. In Doha City, LST showed an increased trend from 1990 to 2015; low in 1990, moderate in 2000, to very high in 2015. Furthermore, our results confirmed accelerated urban sprawl during 1990-2015. The evaluated areas increased from 80 km2 in 1990 to 179 km2 in 2015. A strong positive relationship was observed between UHI and urban area intensity. Urban planning absence significantly affected the rural environment. Urbanized areas exhibited high thermal conductivity and radiation heat budgets, characterized by increased atmospheric and surface temperatures compared to surrounding rural areas. Therefore, rapid urbanization rates must undergo proper planning and management regimes to insure positive impacts on the local climate and environment.
Keywords: Urban heat island (UHI); Land surface temperature (LST); Doha (Qatar)
10509Introduction
Doha is a boom city on the Arabian littoral and the singular preeminent urban agglomeration on the low Qatari peninsula [1]. It is Qatar's largest city, with over 60% of the nation's population residing there. The city has grown from a port of less than thirty thousand inhabitants in the mid-twentieth century to today’s cosmopolitan extravaganza having over a million people [1]. Doha is characterized by the striking modernity of the urban built space, and perhaps also the pace of social change for the inhabitants therein. Those inhabitants include Qataris, who number less than three hundred thousand, but also more than a million other people who come and go as guests of a sort, mostly to work. Like many other cities on the coast of the Arabian Peninsula, Doha has long been entwined in the maritime trade routes of the Indian Ocean world [1]. In recent years, it has become one of the major and most important producers and exporters of Liquefied Natural Gas (LNG) in the world. The wealth produced by Qatar’s oil and gas exports has generated an unprecedented construction boom in the city and its surrounding peripheries. This has resulted in significant growth at all levels, from urban development and infrastructure provision to the building of office towers and sophisticated architecturally innovative cultural and educational facilities. Doha grew around the native pearling industry. In addition, hydrocarbons were discovered in 1939, but their exploitation and a sequence of further discoveries would escalate only in the waning decades of the twentieth century [1]. It is the economic center of the country located on the coast of the Arabian Gulf. The wealth generated by the resources was substantial, and much of it has been expended urban development. Recently, increasingly large geographical portions of the urban landscape are encompassed in singular planned ventures. Zones, partitions, walls, enclaves, and compounds are familiar aspects of everyday life in Doha. These are the “zoning technologies” that demarcate the increasingly large units of urban planned space in Doha. During the late 1990s and particularly during the first decade of the new millennium the structure of Qatar’s governance was made new due to the establishment of stateowned and semi-privatized institutions intended to implement the liberalization strategy. This resulted in rapid urban growth in Doha and its metropolitan area, which grew from around 500,000 inhabitants in the late 1990s to 1.5 million in 2011 [1]. The everchanging and increasing population not only poses challenges to planners and decision makers, but architects also have to envisage and design sustainable and pleasing environments for the needs of a future. The first revenues made from oil were mainly invested in the development of infrastructure such as the construction of a regional road connecting the Dukhan field with Doha and the first airport, which was built in the east of the city [2,3].
Remote sensing and geographic information system techniques are considered powerful and effective tools and are widely applied to detect the spatio-temporal dynamics of land use/cover changes [4]. LST is derived from satellite thermal infrared (TIR) imagery [5,6]. This study aimed to select the most appropriate remote sensing sensors to monitor changes in the thermal environment of Doha City due to urban sprawl from 1990-2015.
Methods and Techniques
Four sets of remote sensing data were obtained, from the USGS website, to conduct this research, including Landsat 5 Thematic Mapper (TM) during 1990, Enhanced Landsat Thematic Mapper Images Plus (ETM+) during 2000, ASTER images during 2013, and Landsat 8 during 2015. All sensors represented the winter season, i.e. January and February. Spatial, spectral, and temporal resolutions of all sensors are summarized in Table 1 [7-10].
| Sensor | Spectral resolution (wavelength micrometer) | Spatial Resolution (m) | TemporalResolution (Days) |
|---|---|---|---|
| Landsat 5 (TM) | band 6: 10.4-12.5 | 120 m resampled to 30 m | 16 |
| Landsat 7 (ETM) | band 6: 10.4-12.5 | 60 m resampled to 30 m | 16 |
| Landsat 8 (TIRs) | band 10: 10.6-11.9 band 11: 11.5-12.51 |
100 m resampled to 30 m | 16 |
| Aster | band 10: 8.125-8.475 band 11: 8.475-8.825 band 12: 8.925-9.275 band 13: 10.25-10.95 band 14: 10.95-11.65 |
90 m | 16 |
Table 1: Spatial, spectral and temporal resolutions of landsat 5,7,8 and ASTER thermal bands.
Remote sensing image processing and Geographic Information Systems (GIS) techniques were utilized to classify land cover and extract the UHI in Doha City from 1990-2015.
Image classification
Image classification was applied to automatically categorize all pixels in an image into land cover classes or themes. Unsupervised classification was performed separately on the remotely-sensed images using a histogram peak cluster technique to identify dense or frequently occurring pixelated areas [11-15]. In the unsupervised approach, spectrally separable classes were determined to form a supervised classification scheme. ENVI 4.8 was employed to process satellite image classifications [16]. Authors applied supervised maximum likelihood classification (MLC) to detect land cover classes. Once a sufficient number of spectral subclasses were obtained for all information classes, MLC was performed with the full set of refined spectral classes [15]. MLC is a statistically complex approach to classify images for change detection; however several studies reported the methodology was most effective for supervised classification [17,18]. Here, supervised classification was verified for each date using field investigation information collected from more than 34 ground checkpoints.
Calculation of urban heat island
ENVI 4.8 and ERDAS Imagine 9.3 were used to retrieve UHI for the study area. Landsat calibration equations were obtained and corrected from Landsat 7 and Landsat 8 handbooks [7,8]. ASTER calibration equations and required parameters were obtained from the ASTER user handbook [9,10].
In order to retrieve UHI of the study area, the following processing was performed:
Convert DN values into spectral radiance: Landsat DN values were converted into spectral radiance (TOA) in units (W m-2 μm-1 sr-1) using the Landsat calibration equation following author [19]. All specific calibration coefficients and other related parameters (such as sun elevation, gain, and offset) were obtained from a level 1-product header or ancillary data record. For Landsat 8, the following equation was used:
where Lλ represents spectral radiance in units (W m-2 μm-1 sr-1), ML indicates the band specific multiplication rescaling factor obtained from metadata, AL represents the band specific rescaling additive factor obtained from metadata, and Qcal the quantified and calibrated standard product pixel values (DN) [8].
ASTER data radiance can be obtained from DN values as follows:
Radiance = (DN value –1) x unit conversion coefficient
Where the unit conversion coefficient of each band was obtained from the ASTER user handbook [9,10].
Convert the spectral radiance into effective radiance at sensor brightness temperature: For Landsat 5,7, and 8 and ASTER data, the spectral radiance of thermal infrared bands were converted into effective radiance at sensor brightness temperature (the temperature values of black body) using Planck's function equation as follows:
C1 = 1.19104356 × 10⁻¹⁶ W.m2,
C2 = 1.4387685 × 104 μm K
where Ti represents sensor brightness temperature in kelvin; C1 and C2 are constants; λ is emitted radiance wavelength for peak response and average limiting wavelengths (λ=11.5 μm for Landsat band 6 data, λ=10.9 μm and 12 μm for Landsat 8 bands 10 and 11, respectively; λ=10.6 μm and 11.3 μm for ASTER bands 13 and 14, respectively); and Li is spectral radiance, [20,21].
Landsat data were converted using the following equation in which Planck's function is similar to the two free parameters K1 and K2 [19,22]:
 (1)
(1)
Where Ti indicates effective at-satellite brightness temperature in kelvin; K2 represents the calibration constant 2 in kelvin; K1 is the calibration constant 1 in W/ (m2.sr.μm); and Lλ represents spectral radiance at the sensor's aperture (Table 2).
| Units | W/(m2.sr.µm) | Kelvin |
|---|---|---|
| Constant | K1 | K2 |
| Landsat5 TM | 607.76 | 1260.56 |
| Landsat7 ETM+ | 666.09 | 1282.71 |
| Landsat8 TIRS | Band-specific thermal conversion constant from the metadata associated with the images (scene dependent) | Band-specific thermal conversion constant from the metadata associated with the images(scene dependent) |
Table 2: TM thermal band calibration constant.
Land surface temperature calculation
Satellite thermal infrared sensors measure Top of the Atmosphere (TOA) radiances, from which brightness temperature (known as blackbody temperatures) can be derived based on Plank's law. TOA radiances are the result of mixing three parts of energy. The first is the emitted radiance from earth's surface, the second is the upwelling radiance from the atmosphere, and the third is the down welling radiance from the sky [23,24]. The difference among TOA and land surface brightness temperature is subject to the influence of atmospheric conditions. Therefore, to obtain an actual land surface brightness temperature, atmospheric effects, including absorption upward emission and downward irradiance reflected from the surface, should be corrected first. This correction was conducted by calculating spectral emissivity (?), [23,24]. LSTs were obtained by recovering satellite temperature Ti by applying the correction for emissivity. The following steps were performed:
Calculation of land surface emissivity ?
The effects of land surface emissivity on satellite measurements can be generalized into three categories [23]: i) emissivity causes a reduction of surface-emitted radiance; ii) non-black surfaces reflect radiance; and iii) anisotropy of reflectivity and emissivity might reduce or increase total surface radiance. It is known that emissivity as a function of wavelength is controlled by surface water content, chemical composition, structure, and roughness. For vegetated areas, emissivity can vary significantly with plant species, areal densities, and growth rates. In fact, land surface emissivity is closely related to NDVI. Therefore, emissivity can be estimated using the following steps:
Computing NDVI: Normalized Difference Vegetation Index (NDVI) was used to transform multispectral data into a single image band representing vegetation distribution. NDVI values between -1 and 1 indicate the amount of green vegetation present in a pixel. The higher the NDVI value, the more green vegetation exists. A standard algorithm was computed using ENVI (4.8) software following the equation in [25]. For Aster data, this equation was applied using band 2; (0.63-0.69 μm) and band 3N; (0.78-0.86 μm). The equation was also applied to Landsat 8 using bands 4 (0.64-0.67) and 5 (0.85-0.88).
Emissivity ε estimates: The emissivity values from NDVI used Table 3 [20].
| NDVI | Land surface emissivity ? |
|---|---|
| NDVI < -0.185 | 0.995 |
| -0.185≤ NDVI <0.157 | 0.970 |
| 0.157≤NDVI≤0.727 | 1.0094+0.047ln (NDVI) |
| NDVI>0.727 | 0.990 |
Table 3: NDVI values and its corresponding values of land surface spectral emissivity.
LST (Ts) estimates
The emissivity-corrected LST was obtained using the following equation [26,27]:
where Ts represents LST, Ti indicates sensor brightness temperature in kelvin, λ is wavelength of the emitted radiance (for peak response and average limiting wavelengths), ? represents land surface spectral emissivity,  = 1.438 × 10⁻² mk, where h is Plank's constant (6.626 × 10⁻³⁴Js), c indicates light velocity (2.998 × 10⁸ m/s), and σ is the Boltzmann constant (5.67 × 10⁻⁸ Wm-2 k-4 = 1.38 × 10⁻²³ J/k). This step was carried out using ASTER data after resampling the satellite brightness temperature image (step 2). This image was resampled into a spatial resolution 15 × 15 pixel.
LST normalizing and obtaining urban heat island
Although we chose to sample the study area during approximately the same season, it was not appropriate to compare multiple data images from different years. This was due to inter annual variation and different atmospheric conditions within the same time period among years. Therefore, to compare LST from different dates, a normalization method was performed using the following equation [26]:
where Ui represents the LST of pixel i after normalizing, Tsi is LST of date i in degree kelvin as obtained in step 3, Tmin and Tmax indicate the minimum and maximum LST retrieved from all data sets, extremes excluded.
The output value Ui varied from 0 to 1 (0 ≤ Ui ≤ 1.0), which was classified as follows:
Class 4 and class 5 were merged and defined as the UHI zone.
Results and Discussion
Image classification was applied to determine changes among the available images. Unsupervised/supervised classification was employed to obtain detailed land use classification data. The classes in the unsupervised classification scheme were very similar to those generated in the supervised classification. Maximum likelihood supervised classification was applied to Landsat images acquired from 1990, 2000, and 2015 for land cover class assessment. Four land use categories were identified, including sea-water, urban areas, and sand and vegetation cover (Figure 1). Each class was ground truthed using a Garmin 38 GPS unit; more than 34 ground data sites were visited and confirmed with GPS coordinates. The results were consistent with urban area acceleration from 1990-2015, with an increase from 80 km2 in 1990 to 179 km2 in 2015.Remote sensing data were used to monitor discrete land cover types and estimate biophysical characteristics of land surfaces [28]. Potential parameters describing urban construction materials, composition, and urban canopy structure can be derived from remote sensing approaches. Consequently, UHI effects produced from urban surface energy budgets can be recognized. High resolution remotely sensed thermal imagery has the advantage of providing a time-synchronized dense grid of temperature data over an entire city and distinctive temperatures for individual buildings [27]. Remote sensing technology was used to monitor the impacts of surface water and vegetation cover on the thermal environment. Abutaleb et al., assessed UBI over greater Cairo using remotely sensed imagery during 2002-2012 [29]. Results indicated expansion of urban areas increased land surface thermal radiation in highly populated areas. The growing interest in thermal remote sensing methodologies to extract LST and urban energy budgets is due to the importance of this information to study urban climatology, global environmental changes, human-environment interactions, and planning and management practices. A strong positive relationship was observed between UHI intensity and urban areas. Urban planning significantly affected the thermal environment. Urbanized areas exhibited high thermal conductivity and radiation heat budgets, characterized by increased atmospheric and surface temperatures compared to surrounding rural areas [30].
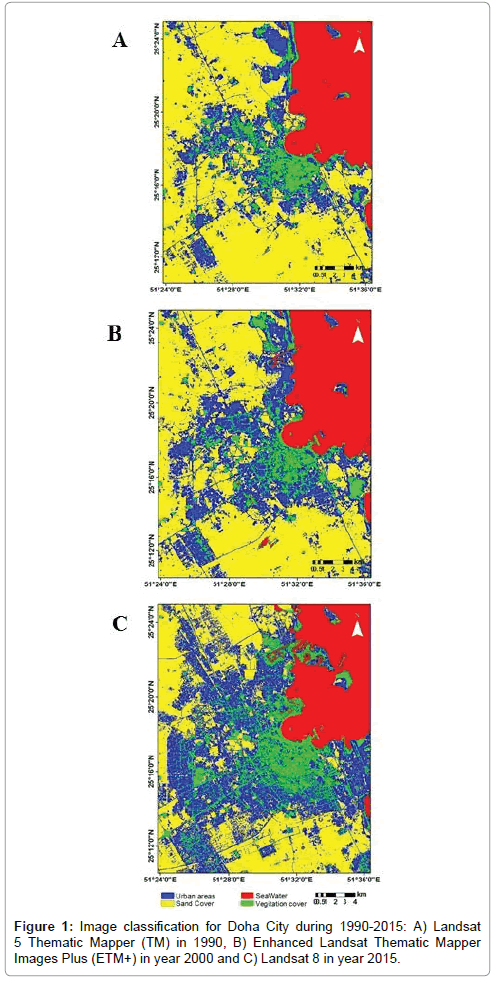
Figure 1: Image classification for Doha City during 1990-2015: A) Landsat 5 Thematic Mapper (TM) in 1990, B) Enhanced Landsat Thematic Mapper Images Plus (ETM+) in year 2000 and C) Landsat 8 in year 2015.
Ahmed and kaiser reported local thermal changes occurred during rapid urbanization [31]. Cultivated land expansion and relocation of industrial facilities from cities to suburban and rural areas achieved further reductions in UHI. In the present study, remote sensing technology was used to monitor urban growth impacts on the thermal environment from 1990-2015 in Doha City. These changes were analyzed using thermal infrared. Thermal bands were processed to obtain radiant surface temperatures to spatially and temporally investigate UHI effects associated with increased urban areas over the 25-year period (Figure 2). LST increased from low in 1990 to moderate in 2000 to very high in 2015. UHI and the energy budget extracted from Landsat 5 and 7 thermal infrared data were significantly correlated with urban planning and development activities. Vegetation cover reduced the amount of solar radiation reaching man-made surfaces; in addition, vegetation caused cooling of the surrounding air by releasing moisture through a process known as evapotranspiration [32]. Therefore, proper planning and management regimes must be put in place as rapid urbanization proceeds to mitigate negative impacts on the local climate and environment. All processed data were acquired in the early morning (approximately 7:00) in the winter season; i.e. January and February. The actual mean near-surface air temperature was kindly supplied from the Qatar International airport. Measured data obtained from the field were used to verify calculated LST extracted from remote sensing images. UHI was also extracted from ASTER images for 2013 (Figure 3). The results were compared with those extracted from the Landsat 8 image. Results showed UHI calculated from the Landsat sensor were more consistent with ground truthed temperatures.
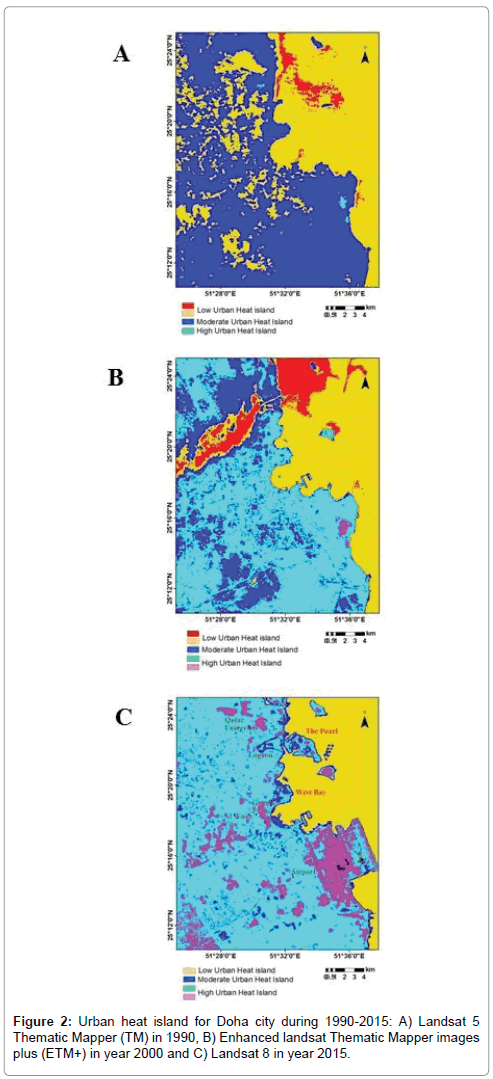
Figure 2: Urban heat island for Doha city during 1990-2015: A) Landsat 5 Thematic Mapper (TM) in 1990, B) Enhanced landsat Thematic Mapper images plus (ETM+) in year 2000 and C) Landsat 8 in year 2015.
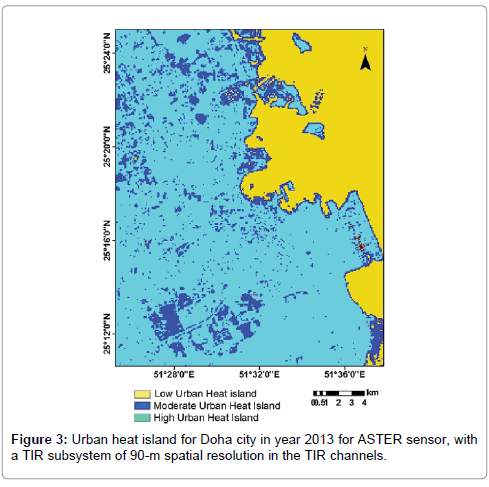
Figure 3: Urban heat island for Doha city in year 2013 for ASTER sensor, with a TIR subsystem of 90-m spatial resolution in the TIR channels.
Conclusion
Analysis of four remote sensing datasets, including Landsat 5 Thematic Mapper (TM) from 1990, ETM+ from 2000, ASTER images from 2013, and Landsat 8 from 2015 established the most appropriate remotely sensed approach to monitor thermal environment change in Doha City due to urbanization sprawl during the 25-year period from 1990-2015. All sensors were chosen to represent the same season, which was during the Qatar January and February winter season. Remote sensing image processing and GIS techniques were utilized to classify land cover and extract UHI from data obtained for Doha City from 1990-2015. Unsupervised/supervised classification was employed to obtain detailed land use classification data. Four land use categories were identified, including seawater, urban areas, sand and vegetation covers. Each class was verified in the field using a Garmin 38 GPS unit; more than 34 ground data sites were visited and confirmed with GPS coordinates. The results were consistent with urban area acceleration from 1990-2015, with an increase from 80 km2 in 1990 to 179 km2 in 2015. A strong positive correlation was observed between UHI intensity and urban areas. Urban planning significantly affected the thermal environment. Urbanized areas exhibited high thermal conductivity and radiation heat budgets, characterized by increased atmospheric and surface temperatures compared to surrounding rural areas. In Doha City, LST increased from low in 1990 to moderate in 2000 to very high in 2015. UHI and the energy budget extracted from Landsat 5 and 7 thermal infrared data were significantly correlated with urban planning and development activities. Vegetation cover reduced the amount of solar radiation reaching man-made surfaces; in addition, vegetation caused cooling of the surrounding air by releasing moisture through a process known as evapotranspiration. Therefore, proper planning and management regimes must be put in place as rapid urbanization proceeds to mitigate negative impact on the local climate and environment. Landsat TM thermal infrared data with low spatial resolution (60-120 m) was more appropriate for large-area thermal studies, however it might have utility to investigate complex urban thermal environments and determine LSTs for individual buildings. However, ASTER sensors with a TIR subsystem of 90 m spatial resolution were more accurate in resolving thermal patterns and LSTs. Landsat data show relatively high temperatures, which were more reliable relative to the actual measured data. ATLAS data (10 m resolution) or TABI (2 m resolution) performed well in community level studies in terms of thermal exchange [33,34], while ASTER and Landsat data were more appropriate for large area thermal studies. In this study, UHI calculated from the Landsat sensor was more consistent with ground truthed temperatures.
References
- Gardner A(2013) The transforming landscape of Doha: An essay on urbanism and urbanization in Qatar.
- KCIC-Kuwait China Investment Company (2011) Qatar Country Profile [WWW document].
- Scholz F (1999)Die kleinenGolfstaaten, Justus PerthesVerlag Gotha GmbH, Gotha.
- Weng Q (2011)Remote sensing of impervious surfaces in the urban areas: requirements, methods andtrends. Remote Sensing of Environ117: 34-49.
- Li J, Song C, Cao L, Zhu F, Meng X,et al. (2011) Impacts of landscape structure on surface urban heat islands: a case study of Shanghai, China. Remote Sensing Environ 115:3249-3263.
- Evrendilek F, Karakaya N, Gungor K, Aslan G ( 2012) Satellite-based and mesoscale regression modeling of monthly air and soil temperatures over complex terrain in Turkey. Expert Systems With Applications 39: 2059-2066.
- USGS, Landsat 7 Thermal Band Calibration Update (2013) USGS/EROS, available on the USGS web site
- Loyd C (2013) Putting Landsat 8's Bands to Work, published on June 14, 2013.
- Gillespie A, Rokugawa S, Matsunaga T, Cothern JS, Hook S, et al. (1998) A Temperature and Emissivity Separation Algorithm for Advanced Spaceborne Thermal Emission and Reflection Radiometer (ASTER) Images.IEEE Transactions on Geoscience and Remote Sensing 36: 1113-1126.
- Kalinowski A, Oliver S (2004) ASTER Mineral Index Processing Manual Remote Sensing Applications Geoscience Australia October 2004.
- Ahmed S,Kaiser MS (2014)Geo-Environmental Assessment of the Suez Canal Area, using Remote sensing and GIS Techniques. J Earth Sci and Geotechnical Eng 4:2.
- Lillesand TM, Kiefer RW (1994)Remote sensing and image interpretation. John Wiley & Sons, Inc. 750.
- Eastman JR (1997) Supervised classification in IDRISI for windows version 2, tutorial exercises. Worcester, Massachusetts: Clark University, 86-94.
- Mather PM (1999) Computer processing of remotely-sensing images, an introduction, (2nd ed.), Chichester: John Wiley & Sons, Inc., pp. 1-75.
- Lillesand TM, Kiefer RW,Chipman JW (2004)Remote sensing and image interpretation. John Wiley & Sons, Inc., 763 pp.
- Salem BB, El-Cibahy A, El-Raey M (1995) Detection of Land Cover Classes in Agro-Ecosystems of Northern Egypt by Remote Sensing. Int J Remote Sensing16: 2581-2594.
- Csillage F (1986) Comparison of Some Classification Methods on a Set Site (Kiskore, Hungary): Separability as a Measure of Accuracy. Int J Remote Sensing7: 1705-1714.
- Hixon MM, Davis BJ, Bauer ME (1981) Sampling Landsat Classification for Crop Area Estimation. Photogrammetric Eng Remote Sensing47: 1343-1348.
- Chander G,Markham B (2003) Revised Landsat-5 TM radiometric calibration procedures and post calibration dynamic ranges. IEEE Transaction onGeosci Remote Sensing 41: 2674-2677.
- Liu L,Zhang Y (2011)Urban heat island analysis using the Landsat TM data and ASTER data: A case study in Hong Kong. Remote Sensing 3: 1535-1552.
- Stathopoulou M, synnefa A, Cartalis C, Santamouris M, Karlessi T,et al. (2009) A surface heat island study of Athens using high resolution satellite imagery and measurements of the optical and thermal properties of commonly used building and paving materials. Int J Sustainable Energy 28: 59-76.
- Wu C, Wang Q, Yang Z, Wang W (2007) Monitoring heated water pollution of the Da Ya Wan nuclear power plant using TM images. Int J Remote Sensing 28: 885-890.
- Weng Q, Larson RC (2005) 10 satellite remote sensing of urban heat islands: current practice and prospects.Geo-Spatial Technologies in Urban Environ 91-111.
- Van TT, Bao HDX (2010) Study of the impact of urban development on surface temperature using remote sensing in Ho Chi Minh city, north Vietnam. Geographical Res 48: 86-96.
- Jensen JR (1986) Introductory Digital Image Processing, Prentice-Hall, New Jersey, p. 379.
- Xiong Y, Huang S, Chen F, Ye H, Wang C, et al. (2012) The impacts of rapid urbanization on the thermal environment: A remote sensing study of Guangzhou, South China. Remote sensing 4: 2033-2056.
- Yue W, Liu Y, Fan P, Ye X, Wu C (2012) Assessing spatial pattern of urban thermal environment in Shanghai, China. Stochastic Environ Res and Risk Assessment 26: 899-911.
- Weng Q,Quattrochi DA (2006) Thermal remote sensing of urban areas: An introduction to the special issue. Remote Sensing of Environ104: 119-122.
- Abutaleb K, Ngie A, DarwishA, Ahmed M, Arafat S(2015)Assessment of Urban Heat Island using remote sensed imagery over greater Cairo, Egypt.Advances in Remote Sensing 4: 35-47.
- Voogt JA, Oke TR (1998) Effects of urban surface geometry on remotely sensed surface temperature.Int J Remote Sensing 19: 895-920.
- Ahmed S,Kaiser MF (2014) Monitoring water pollution of Lake Maryout on the Mediterranean coast of Egypt. Int J Remote Sensing Applications 4: 36-40.
- Kaiser MF (2014) Impact of the human activities on the local climate and environment of the Suez City in Egypt. IntJ Geosci5: 700-709.
- Gluch R, Quattrochi DA,Luval JC (2006)A multi-scale approach to urban thermal analysis. Remote sensing of environ104: 123-132.
- Pu R, Gong P,Michishita R,Sasagawa T (2006) Assessment of multi-resolution and multi-sensor data for urban surface temperature retrieval. Remote sensing of environ 104: 211-22 5.
Citation: Al Kuwari NY, Ahmed S, Kaiser MF (2016) Optimal Satellite Sensor Selection Utilized to Monitor the Impact of Urban Sprawl on the Thermal Environment in Doha City, Qatar. J Earth Sci Clim Change. 7:326. DOI: 10.4172/2157-7617.1000326
Copyright: © 2016 Al Kuwari NY, et al. This is an open-access article distributed under the terms of the Creative Commons Attribution License, which permits unrestricted use, distribution, and reproduction in any medium, provided the original author and source are credited.
Select your language of interest to view the total content in your interested language
Share This Article
Recommended Journals
Open Access Journals
Article Tools
Article Usage
- Total views: 13346
- [From(publication date): 1-2016 - Aug 20, 2025]
- Breakdown by view type
- HTML page views: 12264
- PDF downloads: 1082