Phosphorus Sorption Characteristics and External Phosphorus Requirement of Bulle and Wonago Woreda, Southern Ethiopia
Received: 23-Jan-2015 / Accepted Date: 27-Apr-2015 / Published Date: 29-Apr-2015 DOI: 10.4172/2329-8863.1000169
Abstract
Determination of the P-sorption characteristics of soils is important for economic fertilizer application and to recommend appropriate management strategies for high P-fixing soils. Thus, the objectives of this study were to evaluate P-sorption characteristics of soils occurring in some areas of southern Ethiopia and identify factors contributing to P sorption. Composite surface (0-20 cm) soil samples from 6 sites of two locations were collected. The results revealed that the P-sorption data were fitted well with both Langmuir and Freundlich models with r2 values of 0.99. But later model was found to better in describing P-sorption data than the former model. The adsorption maxima (Xm) and distribution coefficient (Kf) values of soils ranged from 909-2000 mg PKg-1 and 245-487 mg PKg-1 based on Langmuir and Freundlich models respectively. The corresponding SPR values ranged between 57-196 mg P kg-1 and 71.8-211 mg P kg-1 based on Langmuir and Freundlich models respectively. Bonding energy constant (K) of Langmuir model and Freundlich constant (b) ranged from 0.15-1.4 and 0.54-0.66 Lmg-1 respectively. The bonding energy constant (K) of Langmuir model was found to be more valuable than Xm in discriminating the study soils as high and low P sorbing soils. Based on both models soils of Bulle had SPR values >150 mg PKg-1 and then were classified as high P-fixing soils while soils of Wonago had SPR values <150 mgPKg-1 were classified as low P-fixing. The result of path analysis revealed that exchangeable Al and Clay had direct effect on P-sorption parameters of both models. It is concluded that P-sorption models can effectively be used to discriminate soils based on P-fixation ability. However, validation of both models through real time experiments in greenhouse and field is recommended before the models used for large scale.
Keywords: P-Sorption/Fixation; Standard P requirement (EPR); Exchangeable Al; Fe; Langmuir model; Freunlich model
403561Introduction
In tropical and subtropical acidic soils low Phosphorus (P) availability is a major factor that limits plant growth. When soil P levels are too low, phosphorus deficiency in plants represents a major constraint to world agricultural production [1]. According to [2], soil P deficiency may be due to low P containing parent material from which soil was formed or low inherent P content, high weathering incidence and soil reaction, long term anthropogenic mismanagement through imbalance between nutrient inputs, and P losses by erosion and surface runoff.
Furthermore, the limited availability of P in soils may be attributed to severe P fixation or retention. In which Phosphorus retention by soils often involves complex combination of sorption and precipitation reactions. Initially, the phosphate ions undergo sorption onto organic and inorganic particle surface and then slowly precipitate into less available forms [3]. Depending on this the fate and efficiency of native and applied P therefore remains one of the biggest problems in arable crop production in the tropics. One problem is that fertilizer P can largely be fixed by oxides, hydroxides and oxy-hydroxides of Fe and Al and clay minerals in acidic soil, which makes it less available or effectively unavailable to plants [4].
According to Abayneh [5] Ethiopia has diverse soil resources largely because of diverse topography, climatic conditions and geology. Therefore, successful agriculture to meet the increasing demands of food, fiber, fuel and others requires the sustainable use of soil by managing the nutrient supplying capacity of the soil.
However, the morphological, physical and chemical characteristics of soils of Southern Ethiopia in relation to nutrient retention and management alternatives are not well documented with this accurate prediction of nutrient requirements is highly desirable, because the cost of fertilizer is a constraint that limiting fertilizer use by small farmers.
Isotherm equations still are a common approach to study P sorption in soils, since their use allows summarizing results, reducing the sorption data to comparable values. Among isotherm adsorption models, Langmuir and Freundlich equations are the one most used for soil characterization and research purposes [6].
Recommending fertilizer requirement of crops based on biological tests alone is unlikely to address the problem of plant nutrition unless used in combination with soil test results. Moreover, [7] stressed that soil testing is essential for accurate and profitable fertilizer recommendations provided that the soil test result correlate to the crop response.
Langmuir and Frendlich models are the most widely used models to describe P-sorption charactatersitics of soils and draw external P-requirements [8]. These models are able to discriminate soils based on their ability to sorb/adsorb P from soil solutions. They also give an insight into strength of P-adsorption on the surface of a particular soil.
However, so far only limited research results [9] are available on the P sorption characteristics and soil factors contributing to P-sorption for Ethiopian soils. Thus, it is essential to determine the P-sorptin isotherm of some soils of southern Ethiopia and model the resulting data for generating valuable recommendation for future use. Therefore, the objectives of this study were: to identify soil with high and low p sorption characteristics, to estimate the soil’s standard P requirement based on P- sorption isotherm.
Materials and Methods
Description of study sites
The sites considered in the present study are among the agriculturally important soils in the Gedeo Zone, Southern regions of the country. Only two sites from the Zone (Bulle and Wonago woreda) were selected by stratifying the entire study area based on differences in altitude, crop type, slope gradient and mainly as classified by government for the ease of political management by identifying the potential area and grouping them in to sub kebelles (which called locally “Goxi”). The sampling depth was restricted to the plough layer (0-20 cm) where most of the plant nutrient and the roots of crops are concentrated and actively interact.
Soil sampling and sample preparation
Visual observations of the area were first taken to have a general view of the variations in the study area and representative fields were selected. Following the site selection, 40 subsamples were taken from each site to make one composite sample for each from the depth of 0-20 cm in a Zigzag sampling scheme using an auger. For labeling conventions the soil samples from the Wonago site were (Wo1, Wo2 and Wo3) while sample from, Bulle (Be1, Be2 and Be3). The soil samples were mixed well, air-dried and passed through a 2 mm sieve for the analysis of selected soil physical and chemical properties.
Analysis of selected soil physico-chemical properties
Soil analysis was done following standard procedures adopted by National Soil Testing Center for determining selected soil chemical and physical properties at Hawssa University, College of Agriculture Soil Laboratory and Southern Region Agricultural Bureau soil laboratory.
Soil particle size distribution was determined by the Bouyoucos hydrometer method [10] after destroying OM using hydrogen peroxide and dispersing the soils with sodium hexametaphosphate.
The pH of the soils was measured in water suspension in a 1:2.5 (soil: liquid ratio) potentiometrically using a glass-calomel combined electrode [10]. The Walkley and Black wet digestion method was used to determine soil carbon content and percent soil OM was obtained by multiplying percent soil OC by a factor of 1.724 following the assumption that OM contains 58% carbon [11]. Even though the Olsen method is the most widely used for P extraction under wide range of pH both in Ethiopia and elsewhere in the world [12,13] available soil P was analyzed according to the standard procedure of Bray-??.
Cation Exchange Capacity (CEC) of soil was determined by neutral sodium-acetate saturation and neutral NH4–acetate displacement. Exchangeable basic cations (Ca, Mg, K, and Na) of the soil were determined in the leachate using 1N neutral ammonium acetate adjusted to a pH of 7. Finally, exchangeable Ca++ and Mg++ were determined in the extract using AAS, whereas K+ and Na+ were determined by flame photometer. Exchangeable Al was determined by saturating the soil samples with potassium chloride solution and titrating with sodium hydroxide as described by McLean. Available micronutrients (Fe, Cu, Zn and Mn) were extracted by DTPA and all these micronutrients were measured on AAS, as described by Lindsay and Norvell [14].
P-Sorption study
Phosphorus sorption characteristics were determined by batch equilibrium methods in which soil samples were agitated with P solutions of known concentrations [15]. Subsamples of soils collected from seven sites (Hagereselam, Damot Gale, and Hawassa zuria, Wonago, Chencha, Bulle and Halaba) that were previously used for soil physico -chemical analysis were used in P-sorption study. All samples were air dried at ambient temperature (Preferably between 20-25°C) crushed and sieved through a 2 mm sieve.
Phosphorus as (KH2PO4) was dissolved in a 0.01M solution of Calcium chloride in distilled water. The CaCl2 solution is used as the aqueous solvent phase to improve centrifugation and minimize Cation exchange [16].
According to the methods of Fernandes MLV and Coutinho J to study the sorption of P by soils, 2 g air-dried samples of each soil were placed in 100 ml plastic bottle in order to leave free space for with 25 ml of 0.01M CaCl2 in which the final volume was adjusted to 30 ml [17]. The Continuous mixing was provided during the experimental Period with a constant agitation speed of 350 rpm for better mass transfer with high interfacial area of contact. Afterwards, calculated amount of stock solution of P for each rate was added. The concentrations of the stock solution were 0, 10, 20, 30, 40 and 50 mgl-1 P. Each sorption set for P was replicated twice. The mixture was shaken for 30 minutes with maximum speed of 380 rpm and equilibrated for 24 hr. After equilibration time, the suspension was filtered through Whatman paper No. 42 filter paper and the concentration of P in the clear extract was determined by ascorbic acid method. Phosphorus disappeared from the solution was considered as sorbed P which was plotted against P concentration in the solution to obtain a P sorption isotherm. A blank was run for each soil with the same amount of soil and total volume of 30 ml 0.01 CaCl2 solution (without P) was added and it was subjected to the same procedure. This served as a background control during the analysis to detect interfering compounds or contaminated soils. All the tests, including blanks were performed in duplicate.
The P sorption data for the soils were fitted into the following forms of Langmuir equation and Frendlich equation, because linear regression is convenient and best of data-fitting process.
Langmuir equations: C/X = 1/K.Xm + C/Xm (Equation1) [18-20].
Where C(mgl-1) is the equilibrium concentration, X (mg kg-1) is the amount of P adsorbed per unit mass of adsorbent, K (Lmg-1) is a constant related to the energy of sorption, and Xm (mg kg-1) is P sorption maximum.
X is calculated as CoVo - CfVf/mass of soil (kg) (Equation 2)
WhereCois initial concentration, Cf is final concentration, V is volume of solution. The linear form of equation (1) was obtained by plotting the equilibrium concentration of phosphate(C) against the amount of phosphate adsorbed (X) and the slope of the graph equals to 1/Xm and intercept of the graph is equals to 1/K Xm. But K was easily determined by dividing the slope by intercept.
Freundlich equation: X = KCbor logX = logkf + blogC (Equation 3)
Where, K and b (b<1) are constants, X (mgkg-1) is the amount of P adsorbed per unit mass of adsorbent, and C (mgl-1) is the equilibrium concentration. The linear form of equation 3 was obtained by plotting LogC against LogX. The slope b (Lkg-1) and intercept LogKf representing respectively. Phosphorus sorption curves were drawn by plotting the quantity of sorbed P against the P concentration in the equilibrated soil solution [21].
The external P-requirement of each soil or the amount of P required for each soil at 0.2 mg/L equilibrium solution of P also known as the standard P requirement (SPR) was calculated based on Langmuir and Freundlich models/Equations developed for each soil. The soil solution P of 0.2 mg/L is the amount of P that should be available in the soil for optimum plant growth [22].
Statistical analysis
Path coefficient analysis to differentiate between correlation and causation and to describe P-sorption as influenced by the various soil properties was carried out using SAS®,(2002) software. This analysis allows direct comparison of causal relationships between soil properties and P-sorption by soil. Moreover, it permits partitioning of simple correlation coefficient between dependent (isotherm parameters) and independent (soil properties) variables into direct and indirect effects [23].
Result And Discussion
Soil physico-chemical properties
Selected physico-chemical properties of soils are summarized in Table 1. The soil tests have demonstrated variations among soils in their soil physical and chemical properties. Accordingly, all soils of Bulle and some soils of Wonago were belonged to Clay loam textural class. The pH of the soils ranged from 5.19 to 5.5, According to USDR, almost all of the soils of study area had pH values between lower than or equal to 5.5 and were categorized as very strongly acidic. The soils had OM ranging from 3.4 to 5.7, according to Sahlemedihn ranked 3-5% organic matter (OM) as high and more than 5% as very high [24]. According to this rating, the organic matter content of soils was generally high, which is related to environmental conditions, particularly to vegetation, climate and to the history of cultivation. In line with this, the OM content of the soils of study area was in the high range (Table 1). The high levels of organic carbon are in agreement with observations made by Asnakew et al. who reported that a large proportion (62-100%) of cultivated field soils in the acidic soil had high organic carbon [25].
| Location | Soil texture | pH(H2O) | CEC (cmolkg-1) | Av. P(Mg/kg) | OM (%) | Exch.Al(cmolkg-1) | Ex. Bases(meq/100 g) | Micronutrient(mgkg-1) | ||||||||
|---|---|---|---|---|---|---|---|---|---|---|---|---|---|---|---|---|
| Ca | Mg | K | Na | Fe | Zn | Cu | Mn | |||||||||
| Wonago | ||||||||||||||||
| Wo1 | CL | 5.4 | 32.0 | 24.9 | 5.7 | 0.72 | 5.67 | 1.7 | 0.89 | 0.47 | 2.23 | 0.41 | 1.67 | 2.22 | ||
| Wo2 | L | 5.5 | 25.8 | 23 | 3.8 | 0.38 | 4.64 | 3.1 | 1.35 | 0.32 | 1.59 | 1.62 | 2.81 | 3.51 | ||
| Wo3 | CL | 5.3 | 31.0 | 19 | 3.4 | 0.72 | 4.97 | 2.1 | 2.33 | 0.45 | 2.20 | 1.09 | 0.98 | 1.92 | ||
| Bulle | ||||||||||||||||
| Be1 | CL | 5.39 | 13 | 15 | 5.2 | 3.12 | 2.8 | 1.9 | 0.26 | 0.03 | 24.68 | 1.99 | 4.01 | 3.91 | ||
| Be2 | CL | 5.28 | 14.3 | 14.7 | 4.2 | 3.09 | 2.6 | 1.7 | 0.33 | 0.05 | 14.81 | 1.32 | 3.29 | 4.82 | ||
| Be3 | CL | 5.19 | 13.8 | 15.9 | 4.8 | 3.21 | 3.6 | 2.1 | 0.18 | ND | 22.47 | 1.21 | 2.99 | 7.29 | ||
CL: Clay Loam, L: loam, SCL: Sandy Clay Loam, SL: Sandy Loam.
Av.p: Available Phosphorus (Bray-ɪɪ); CEC: Cation Exchange Capacity, Ex.Al: Exchangeable Almunium, OM: Organic Matter, ND: Not Detected
Table 1: Selected physico-chemical properties of soil from two agriculturally important sites with three fields each at Wonago (Wo) and Bulle (Be) in southern Ethiopia.
The highest values of organic carbon could be because of poor drained condition of the soil and high amount of rainfall that reduces the rate of organic matter decomposition in the study sites [26]. The available P content of the soils ranged from 14.7 to 24.9 mgkg-1 for all soils ranged in acidic which indicates that the soil available P of the study area is low, as described by Birru et al. [9]. From this it needs further treatment in all the acidic soils which is in agreement with the finding of Mengel and Kirkby which stated that values of lower soluble P was indicative of soil capable of significant yield responses to application of appropriate level of P fertilizer [27].
The lower availability P of the surface soils in the southern region may partially be a result of depletion of P through crop removal and improper management of land. The soil exchangeable aluminum was ranged from 0.72 to 3.21 cmolkg-1 and it was highest for the soil of Bulle. The CEC value between 13 to 32.0 cmolkg-1 are high to medium and satisfactory for agriculture with the use of fertilizer and CEC>40 as high to very high and needs only small amounts of lime and potassium fertilizers, the result of experiment show the CEC value ranged in medium.
The soils were low in exchangeable bases, which due to the higher rainfall and seasonal variation normally observed in the region leading to intense leaching of bases and accumulation of exchangeable Al in these soils.
Concerning the micronutrients, the highest contents of available Fe (24.68 mgkg-1) were observed mainly on the soils under Bulle while the rest were low in the study area (Table 1) and the highest (7.29 mgkg- 1) of available Mn was obtained in the soils of Bulle (Table 1). Sims and Johnson (1991) indicated that the critical or threshold levels of available Fe and Mn for crop production are 2.5-4.5 mgkg-1 and 1-50 mgkg-1, respectively. Therefore, the results observed in this study seem to be adequate for the production of most crop plants, especially in the soils of Bulle high Fe observed is the indication of high P sorbing capacity of the soil.
P sorption indices
The P sorption data was adequately plotted according to the Freundlich and Langmuir equations for all soils. The data showed a satisfactory agreement with both Freundlich (R2>0.99) and Langmuir (R2>0.99) equation (Table 2).
| Location | P sorption indicesLE | P sorption indices Fl | ||||||
|---|---|---|---|---|---|---|---|---|
| Xm | K | SPR(0.2) | R2 | b | Kf | SPR(0.2) | R2 | |
| Mg.kg-1 | L.mg.kg-1 | Mg.kg-1 | L.kg-1 | Mg.kg-1 | Mg.kg-1 | |||
| Wonago | ||||||||
| Wo1 | 2000 | 0.15 | 57 | 0.99 | 0.81 | 245 | 71.8 | 0.99 |
| Wo2 | 1428 | 0.26 | 70 | 0.95 | 0.66 | 265 | 94 | 0.96 |
| Wo3 | 1111 | 0.45 | 92 | 0.92 | 0.62 | 322 | 119 | 0.99 |
| Bulle | ||||||||
| Be1 | 1000 | 1.1 | 182 | 0.92 | 0.54 | 479 | 200 | 0.99 |
| Be2 | 909 | 1.4 | 196 | 0.92 | 0.52 | 487 | 211 | 0.99 |
| Be3 | 909 | 1.4 | 196 | 0.92 | 0.52 | 484 | 208 | 0.99 |
LE: Langmuir Equation, Fl: Freundlich Equation, Xm: Langmuir Sorption Maximum, K: Bonding Energy, SPR: Standard P Requirement, Kf: Freundlich Surface Coverage.
Table 2: Slope, intercept and coefficient of determination (R2) of the isotherm models of selected soils.
Sorption behavior was described by the linearzed Langmuir sorption model with regression coefficient (R2>0.93) observed for almost all soils under study (Table 2). The soils differed considerably in sorption characteristics with different location.
Almost all the soils had Sorption maxima ranging from 909 to 2000 mg Pkg-1 which indicates that the soils have high sorption site, but sorption affinity constant, which is the dominant factor showing the bonding energy of the soil to retain P, ranged from 0.15 to 1.4 (l mg-1) and was smaller for all soils of Wonago compared to the soils of Bulle (Table 2).
The amount of P required for maintaining a soil solution concentration of 0.2 mg P kg-1(P0.2) ranged from 57 to 196 mg P kg-1 soil (Table 2).
Soils within a site were classified under the same group, but they differed substantially in the extent to which they fixed P, which shows soils with the same group will not necessarily fix P to the same extent or have similar P fertilizer requirements. This is because soils in nature have variable characteristics, which make them, very complex. This finding is in agreement with B¨uhmann et al. who observed similar sorption trends for soils of South Africa and suggested that for optimum P recommendations soil P fertilization assessments done at field scale level [28].
In addition, the amounts of added P required maintaining a concentration of 0.2 mg P L−1 (P0.2) in solution, which is Standard P requirement in this study (Table 2), were generally higher than the range reported in other studies.
Sarafaz et al. for example reported values ranging from 50 to 201 mg P kg−1 for surface samples from non-cultivated and non-fertilized areas in Ethiopia in which only one sample having a SPR of 123 mg P kg−1 fell within this range while others had very low SPR values indicating possible early P saturation of these soils following repeated applications of P fertilizers [29]. This could lead to elevated P levels in the soil solution, which in time could contribute to the eutrophication of freshwater bodies. However, the present study ranges strongly highly acidic to (Table 1) and had high range of SPR, which indicate that acidic soil, have high need of SPR.
The Freundlich parameter, i.e., sorption capacity (logkf) and P sorption energy (b); and correlation coefficient values computed from the data plotted according to logX against logC in equilibration solution were explained. The goodness of fit of the model was ascertained by looking at the R2 values. All the plots were highly correlated with R2 values ≥ 0.96 indicating apparent high conformity of the adsorption data to the Freundlich model.
Generally, the Freundlich model seemed fit at all equilibrium concentrations (Table 2). For all the soils of the study area the values of sorption capacity and P sorption energy ranged from 245 to 487 mgkg-1 and 0.52 to 0.81 Lkg-1, respectively (Table 2). Since the Freundlich adsorption equation was derived empirically, its parameters (logkf) and (b) have been considered. Despite this, it was proposed that logkf could be considered as capacity factor Sarafaz et al. implying having a larger logkf value has a larger adsorbing capacity than the one having a smaller logkf value [29]. For practical purpose, the logkf may be used to differentiate soils having different P adsorption capacities. Thus, in this study, all the soils of Bulle had the higher sorption capacity relative to the others. The Freundlich parameter logkf was found to be practically useful parameter in summarizing the adsorption properties of soil over a wide range of equilibrium concentrations. The sorption energy (logkf, Freundlich model) is the value which an indication of the adsorption capacity of the adsorbent and the slope (b) show the effect of concentration on the adsorption capacity and represents adsorption intensity. Therefore, sorption capacity in Freundlich is determines whether the soil is high sorber or not relative to each other and was found to be strong for the high P-sorbing soils.
Figure 1a and 1b show the P sorption curves that were obtained by plotting the quantity of P sorbed on the surfaces of against the solution P concentration. According to Sanchez and Goro, soils that adsorb less than 150 mg Pkg-1 soil to meet the SPR value of 0.2 mgl-1 in soil solution are considered to be low sorbing soil and those adsorbing greater than this value are high P sorbing ones [30]. Accordingly, all soils of Bulle were high P fixers while the soils of Wonago were low P fixers (Table 2). Since the six composite samples used in the study were from two different locations in the Gedeo Zone, there is need for a broader study involving soils from other agro-ecologies in the region in order to confirm the proportions.
Nevertheless, the results suggest that P availability could be compromised in the soils of Bulle with high P-sorption capacity and that measures to mitigate the adverse effects of P-sorption may be necessary to ensure that P is not a limiting factor to crop production where such soils are found.
Figure 1a and 1b. Phosphorus sorption isotherm curves for the high P sorbing soils; vertical arrows indicate SPR of the soils (on the y-axis) at a standard solution P concentration 0.2 mg Pl-1.
The rest soils were grouped as low P- sorbing soils (Figure 1a and 1b). The curve followed a smooth plateau pattern. It is evident from the curves that the rate of P sorption increased with an increase of P concentration, but at a certain point of higher concentration, the level of P became almost constant having no more sorption capacity, it was evident from the observations that during sample collection where the soil color of low sorbing soils did not have the same appearance as that of other soils grouped under high P-sorbing ones. The relative amount of P sorbed was dramatically higher at a low concentration than at a higher concentration as also reported by Tsado [31]. This suggests that the reaction between phosphate and the soil was rapid on initial contact; this perhaps could have been due to a low available P content (Table 2) resulting in high adsorption potential at the surface. Similar observations have been reported by Bala [32].
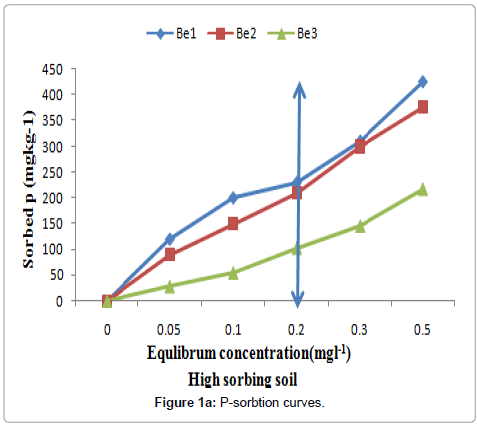
Figure 1a: P-sorbtion curves.
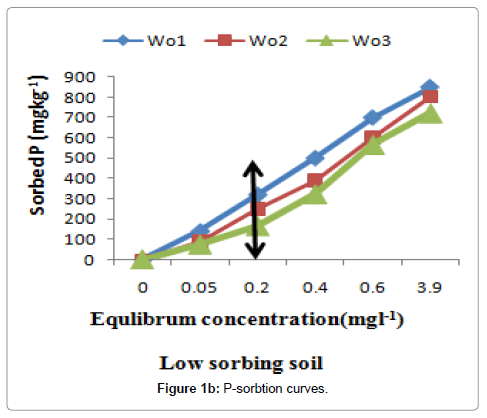
Figure 1b: P-sorbtion curves.
Correlation between P-sorption indices and soil properties
The sorption maximum in the soils of study area was found to correlate negatively with SOM and pH (p ≤ 0.05). Soil OM may also be able to complex Al, stabilizing the compound and possibly enhancing its ability to sorb P which is in agreement with Darke and Walbridge [33]. Organic matter can also inhibit recrystalization of both Fe and Al oxides, thus indirectly assisting P sorption. In these soils, SOM was positively correlated with both Fe and Al. The effect of SOM is often attributed to complexation with Al or both Al and Fe [33]. Organic matter has the potential to impede or enhance P sorption. If of appropriate size it may occlude sorption sites, either by filling them or by physically blocking them.
Soil texture was also significantly correlated with P sorption. Fine textured soils, such as clays, have higher surface area and thus greater reactivity. They also tend to have higher concentrations of Fe and Aloxides than coarser soils. Studies in the southeastern US on acidic soil condition which is similar to the present study have found that finetexture soils were able to sorb more P than coarser substrates [33]. Soils with higher clay and silt contents had higher Xm.
Soil pH was negatively correlated with Xm, indicating that P sorption increases with decreasing pH. In acidic soils (pH<5.5), more sites on the soil matrix are protonated and Al is liberated, thus enhancing P sorption. According to Birru, pH is a significant predictor of P sorption in soils. As pH is a master variable, controlling many biological and chemical processes, it can also enhance P sorption at high values, the negative correlation with pH was probably observable in the soils of the study area, because the pH ranged from 5.19 to 5.5 (Table 1) [34].
Sorption isotherms indices showed that Xm was negatively correlated with sorption energy of Langmuir (k) (Table 2) which shows that the soils may have high sorption sites. But it may have low sorption energy to hold P on the surface since it is determinant factor showing the soil have high sorption capacity of soil (Table 2). Sorption energy was related with the standard P requirement of soil which is positively correlated (p ≤ 0.01). Xm is negatively correlated with SPR0.2, meaning that the soil having high Xm may have low SPR (Table 2).
Freundlich sorption parameter logkf and b were negatively correlated with SPR of soil which shows that this sorption isotherm didn’t determine SPR0.2 of the soil, rather show the fitness of the model. It shows the advantage of Langmuir equation over the Freundlich equation in the determination of SPR(0.2). Generally, the Freundlich model seemed fit at all equilibrium concentrations (Table 2) for all the soils. Since the Freundlich equation was derived empirically, its parameters have been considered physically, but for present study it best explains the high and low sorbing soil. Besides, to this, it was proposed that logkf could be considered as capacity factor which is related to sorption capacity of the soil. This is in agreement with the finding Taylor et al. conducted in both acidic and calcareous soil [6].
Path analysis of P sorption
Concerning the correlation and causation between the isotherm parameter (Xm and logkf) and the soil variable (pH, OM, CEC, Exch. Al and Clay), analysis was made and adequate result was found. Additionally an uncorrelated residue (U) was calculated for both models using the equation ( ). Soil pH, Exch.Al and OM were positively correlated (p ≤ 0.01) with the Xm (Table 3). However, not with the specific isotherm parameters, there are reports that indicate sorption of P increased with decreasing soil pH (acidic soil reaction) and with increasing content of Exchangeable Al [35].
| Variables | pH | OM | CEC | Exch.Al | Clay | r | R2 | U |
|---|---|---|---|---|---|---|---|---|
| pH | 0.548 | -0.086 | 0.012 | -0.43 | 0.42 | 0.937*** | 0.624** | 0.61 |
| OM | -0.291 | 0.163 | -0.006 | 0.007 | -0.87 | 0.990*** | ||
| CEC | -0.143 | 0.023 | -0.045 | -0.46 | -0.19 | 0.812** | ||
| Exch.Al | -0.147 | -0.004 | -0.022 | 0.69** | -0.33 | 0.967*** | ||
| Clay | 0.142 | -0.087 | 0.005 | -0.33 | 0.58** | 0.775** |
Table 3: Path coefficient analysis for direct effect of soil properties (diagonal and underliend) and indirect effect of other soil variable (off diagonal) on the p sorption maximum (Xm) of langmuhir isotherm.
Result of path coefficient analysis, showed that Xm was significantly (p ≤ 0.01) influenced by the direct effect of soil pH with negligible indirect effect from other soil variable (Table 3). At low pH, the adsorbed P is said to be held tightly because at this pH situation, the physically adsorbed p will slowly convert to the mineral apatite by precipitating and crystallizing into iron and Aluminum P forms [36].
The positive and significant direct effect (p ≤ 0.01) on the P sorption maximum (Xm) occurred from exchangeable Al (Table 2). The direct effect of Exch.Al and clay on the sorption maximum (0.69, 0.58; p ≤ 0.01) is an indication of the specific role of Al and clay plays in the processes of P sorption.
Apparently, as concentration of exchangeable Al in the soil increases, the soil’s surface areas for anion sorption will definitely be larger. As far as the correlation between Xm and both pH and organic matter are concerned, the larger portions were due to the direct effect of exchangeable Al than to the indirect effects (Table 2). However, the modes of action of exchangeable aluminum through pH and SOM might be different. The SOM has strong coating effect on the sorbing surface of the soils and minerals such as Al, Fe and the various silicate clay minerals, and in turn these minerals have immobilizing effect on the functional groups of organic matter as reported by Loganathan et al. [37].
Depending on the output of the path diagram, it is possible to calculate the total effect of soil parameter on Xm. The pH of the soil has direct effect on the Xm (= 0.548, Table 2) and indirect effect on the Xm with organic matter (Table 2). Therefore to calculate the total effect (direct and indirect) of pH on Xm, indirect effect first should be calculated by multiplying the direct effect of pH by indirect effect of OM and then add to the direct effect.
( 0.548* - 0.291= -0.159, then -0.159 + 0.548 = 0.389), this value indicate the total effect of pH on Xm, likewise the total effect of soil parameter on Xm could be 0.166, -0.044, 0.462 and 0.385 for OM, CEC, Exch.Al and Clay respectively. The total effect of Exch. Al was higher followed by that of pH and clay content, which was highly related with the soil of Bulle having high Exch. Al than Wonago my finding was in agreement with Henry and Smith who also observed that Al had greater influence on P retention than other [38].
As to that of Frendliuch, energy of P sorption (logkf) was significantly (p ≤ 0.01) influenced by the direct effect of soil pH with negligible indirect effect from the other variable (Table 4). At low pH, the adsorbed p is held tightly because at this pH, the physically adsorbed P will slowly convert to the mineral apatite by precipitating, and crystallizing into Fe and Al forms.
| Variable | pH | OM | Exch.Al | CEC | Clay | r | R2 | U |
|---|---|---|---|---|---|---|---|---|
| pH | 0.14** | -0.064 | 0.039 | 0.006 | -0.19 | -0.61** | 0.898** | 0.101 |
| OM | -0.073 | 0.12** | 0.003 | -0.003 | 0.39 | 0.95** | ||
| Exch.Al | -0.037 | -0.003 | -0.15** | -0.01 | 0.15 | -0.34 | ||
| CEC | -0.036 | 0.016 | -0.07 | -0.02 | 0.085 | 0.65** | ||
| Clay | 0.035 | -0.064 | 0.03 | 0.003 | -0.72** | -0.82** |
Table 4: Path coefficient analysis for direct effect of soil properties (diagonal and underliend) and indirect effect of other soil variable (off diagonal) on the p sorption energy (logkf) of Freundlich isotherm.
Of the total estimated correlation coefficient between the organic matter and logkf (r=0.95; p ≤ 0.01), the larger portion (0.016) was due to the indirect effect of CEC. Although it was not specifically indicated for which isotherm parameter, Hernandez and Burnham observed the cause of changes in P sorption due to the SOM content as to be related to the changes in clay, the correlation coefficient between OM and logkf was positive [39]. However, this was also the indirect effect of clay with negligible direct effect from OM. This result might be partly explained by the fact that the rate of decomposition of SOM increases with rising soil pH from acidic to neutral and also clay type were dominant. In this situation, the organic anions released from the decomposing organic matter have the capacity to replace P ions from exchangeable sites. In addition, organic matter has a coating effect upon Fe, Al and other soil particle surface that can form stable complex and thus prevent their subsequent reaction with the P ions.
Conclusion and Recommendation
The results revealed that depending on the SPR value all the soils of Bulle were classified as high P sorbing while the soils of Wonago was low P sorbing. In the study Langmuir model well described P-sorption data, but Xm value is not a good indicator of P-fixing capacity of soil rather the K (bonding energy) that plays important role in determining SPR value and the P-fixation capacity of the soils in the study area. This further implies that it is not necessarily true that soils with high Xm values will have high external P requirements.
It is concluded that in general both Langmuir and Freunlich models found to be effective in describing the P-sorption data. Based on these models the test soils have widely varied in their P-fixation capacity and SPR values. Variations in their Al, Fe, OM, Were found to be the most important factors that accounted significantly for variation in P-sorption by different soils.
Based on the result it is recommended that, there is a need to investigate measures to mitigate against P sorption in the soils identified as high P sorbing soils to ensure that P availability is not compromised in these soils and also Model validation based on greenhouse and field experiments are needed before the results of the current sorption studies are applied on wide scale.
The contrasting differences in the P fixing capacities of the soils suggested that the use of blanket phosphate fertilizer recommendations may not be a good strategy for the study area as it may lead to underapplication or over-application of P.
References
- Palomo L, Claassen N, Jones DL (2006) Differential mobilization of P in the maize rhizosphere by citric acid and potassium citrate. Soil Biology and Biochemistry 38: 683-692.
- Fairhurst TR, Lefroy R, Mutert E, Batijes N (1999) The importance, distribution and causes of phosphorus deficiency as a constraint to crop production in the tropics. Agroforestry Forum 9: 2-8.
- Ravikovitch S (1986) Anion exchange: I. sorption of phosphoric acid ions by soil, In: Robert D. Harter (ed.) Sorption phenomena, Soil Science Series, Van Nostrand Raeinhold Co, New York, Pp: 147-166.
- Shen HH, Shi XC, Wang C, Cao Z (2001) Study on adaptation mechanisms of different crops to low Phosphorus stress. Plant Nutr Fert Sci 7: 172-177.
- Abayneh E (2001) Application of Geographic Information System (GIS) for soil resource study in Ethiopia. Proceedings of the National Sensitization Workshop on Agro metrology and GIS, Addis, Ababa, Ethiopia, Pp: 17-18.
- Taylor RW, Bleam WF, Tu SI (1996) On the Langmuir phosphate adsorption maximum. Commun Soil Sci Plant Anal 27: 2713-2722.
- Sharpley AN (1995) Dependence of runoff phosphorus on extractable soil phosphorus. J Environ Qual 24: 920-926.
- Freundlich PN (1988) Kinetic control of dissolved phosphate in natural rivers and estuaries: A primer on the phosphate buffer mechanism. Limnol Oceanogr 33: 649-668.
- Birru Yitaferu, Heluf Gebrekidan, Gupta VP (2003) Sorption characteristics of soils of the north-western highlands of Ethiopia. Ethiopian Journal of Natural Resources 5: 1-16.
- Van Reeuwijk LP, (1992) Procedures for soil analysis (3rd Ed) International Soil Reference and Information Center (ISRIC), Wageningen, the Netherlands, pp: 34.
- Walkley A, Black IA (1934) An examination of the Degtjareff method for determining soil organic matter and a proposed modification of the chromic acid titration method. Soil Sci 37: 29-38.
- Landon JR (1991) Booker tropical soil manual: A Handbook for Soil Survey and Agricultural Land Evaluation in the Tropics and Subtropics. Longman Scientific and Technical, Essex, New York. PP: 474.
- Tekalign Mamo, Haque I (1991) Phosphorus status of some Ethiopian soils, Evaluation of some soil test methods for available phosphorus. Tropial Agriculture 68: 51-56.
- Lindsay WL, Norvell WA (1978) Development of a DTPA soil test for zinc, iron, manganese and copper. Soil Science Society of American Journal 42: 421-428.
- Graetz DA, Nair VD (2008) Phosphorus sorption isotherm determination,In: J.L. Kovar and Pierzynski, G.M. (ed) Methods of P analysis for soils, sediments, residuals, and waters -So. Coop. Ser. Bull. No. 396, Pp: 35-38.
- Fuhrman JK, Zhang H, Schroder JL, Davis RL, Payton ME (2004) Water soluble phosphorus as affected by soil to extractant ratios, extraction time and electrolyte. Commun. Soil Sci Plant Anal.
- Fernandes MLV, Coutinho J (1994) Phosphorus sorption and its relationship with soil properties, Trans. 13th World Congress Soil Science. Acapulco, Mexico, 3b: 103-104.
- Fang F, Brezonik PL, Mulla DJ, Hatch LK (2002) Estimating runoff phosphorus losses from calcareous soils in the Minnesota River basin. J Environ Qual 31: 1918-1929.
- Kleinman PJA, Sharpley AN (2002) Estimating soil phosphorus sorption saturation data from Mehlich-3 data. Commun Soil Sci Plant Anal 33: 1825-1839
- Xu D, Xu J, Wu J, Muhammad A (2006) Studies on the phosphorus sorption capacity of substrates used in constructed wetland systems. Chemosphere 63: 344-352.
- Fox RL (1981) External phosphorus requirements of crops; in: Chemistry in the Soil Environment. America Society of Agronomy, Madison, Wisconsin 40: 223-240.
- Bolland K, Otabbong E, Barberis E (2001) Phosphorus sorption in relation to soil properties in some cultivated Swedish soils. Nutrient. Cycling Agroecosyst 59: 39-46.
- Basta NT, Pantone DJ, Tabatabi MA (1993) Path analysis of heavy metal sorption by soil . Agronomy Journal 85: 1054-1057.
- Sahlemedhin Sertsu (1999) Draft guideline for regional soil testing laboratories. NFIA, Addis, Ababa, Ethiopia.
- Asnakew Wldeab, Tekalign Mamo, Mengesha Bekele, Tefera Ajema (1991) Soil fertility management studies on wheat in Ethiopia. Ethiopia, pp: 137-141.
- Mandiringana OT, Mnkeni PNS, Mkile Z, Van averbeke, Ranst WEV et al. (2005) Mineralogy and Fertility status of selected soils of the Eastern Cape Province, South Africa. Communications in Soil Science and Plant Analysis 36: 2431-2446.
- Mengel K, Kirkby EA (1996) Principles of Plant Putrition. Panimo publishing yields, in a Mediterranean climate. Agronomy Journal 86: 221-226.
- Buhmann C, Beukes DJ, Turner DP (2006) Plant nutrient status of soils of the Lusikisiki area, Eastern Cape Province. South African Journal of Plant and Soil 23: 93-98.
- Sarafaz M, Abid M, Mehdi SM (2009) External and internal phosphorus requirement of wheat in Rasulpur soil series of Pakistan. Soil and Environ 28: 38-44.
- Sanchez P, Goro U (1980) In: The role of phosphorus in agriculture. Symposium proceeding.ASA, CSSA, SSSA, Madison, Wisconsin, USA, pp. 471-514.
- Tsado PA, Osunde OA, Igwe CA, Adeboye MKA, Lawal BA (2012) Phosphorus sorption characteristics of some selected soil of the Nigerian Guinea Savanna.University of Nigeria,Nsukka, Enugu State .International Journal of AgriScience Vol. 2: 613-618.
- Bala A (1992) The effect of phosphate on zinc and copper sorption by a tropical soil. M.Sc. Dessertation. Department of Soil Science, UK. Pp: 33.
- Darke AK, Walbridge MR (2000) Al and Fe biogeochemistry in a floodplain forest: implications for P retention. Biogeochemsitry 51: 1-32.
- Birru Yitaferu (2000) Phosphorus status and sorption characteristics of soils of the north-wastern highlands of Ethiopia. Msc thesis, School of Graduate Studies, Alemaya University, Alemaya, Ethiopia. pp. 106.
- Tekalign Mamo, Haque I (1987) Phosphorous status of some Ethiopia soils. Sorption characteristics, Plant and Soil 102: 261-266.
- Archer J (1988) Phosphorus In: John Archer(ed.) Crop nutrition and fertilizer use, (2ndedn) Farming Press. Ltd, USA. pp. 57-64.
- Loganathan P, Isirimah NO, Norachuku DA (1987) Phosphorus sorption by Ultisols and Inceptisols of the Niger delta in Southern Nigeria. Soil Science 144: 330-338.
- Henry PC, Smith MF (2002) Phosphorus sorption study of selected South African soils. South Africa Journal of Plant and Soil 19: 61-69.
- Hernandez LD, Burnham CP (1974) The effect of pH on sorption in soils. Journal of Soil Science 25: 207-216.
Citation: Wolde Z, Haile W, Singh D (2015) Phosphorus Sorption Characteristics and External Phosphorus Requirement of Bulle and Wonago Woreda, Southern Ethiopia. Adv Crop Sci Tech 3:169. DOI: 10.4172/2329-8863.1000169
Copyright: © 2015 Wolde Z, et al. This is an open-access article distributed under the terms of the Creative Commons Attribution License, which permits unrestricted use, distribution, and reproduction in any medium, provided the original author and source are credited.
Select your language of interest to view the total content in your interested language
Share This Article
Recommended Journals
Open Access Journals
Article Tools
Article Usage
- Total views: 15891
- [From(publication date): 5-2015 - Jul 12, 2025]
- Breakdown by view type
- HTML page views: 11144
- PDF downloads: 4747