Research Article Open Access
Porosity in Disk Shape Spray Formed Al-Si-Pb Alloy Preform
Aruna Tomar1 and Devendra Singh2*
1Department of Physics, College of Engineering, Roorkee, India
2Department of Metallurgical and Materials Engineering, Indian Institute of Technology Roorkee, Roorkee-247667, India
- *Corresponding Author:
- Devendra Singh
Department of Metallurgical and Materials Engineering
Indian Institute of Technology Roorkee
Roorkee-247667, India
Fax: +91-1332-273560, 285243
E-mail: dev27fmt@gmail.com
Received Date: March 22, 2012; Accepted Date: June 18, 2012; Published Date: June 20, 2012
Citation: Tomar A, Singh D (2012) Porosity in Disk Shape Spray Formed Al-Si-Pb Alloy Preform. J Powder Metall Min 1:102. doi: 10.4172/2168-9806.1000102
Copyright: © 2012 Tomar A, et al. This is an open-access article distributed under the terms of the Creative Commons Attribution License, which permits unrestricted use, distribution, and reproduction in any medium, provided the original author and source are credited.
Visit for more related articles at Journal of Powder Metallurgy & Mining
Abstract
Spray forming technique was employed to produce a disc shape preform of Al-Si-Pb alloys. Porosity of this disc was investigated as a function of lead content and the distance from centre to periphery of the disc. The porosity decreases with distance from centre to periphery for all compositions of lead. The decay rate in porosity increases with the increase in lead content. Also the decay rate in porosity decreases towards the periphery of the deposit. The areas having large and small amount of porosity were observed in the microstructure of Al-Si-Pb alloys. The large and small amount porosity areas belong to the lead and aluminum rich areas, respectively.
Keywords
Spray forming; Porosity; Al-alloy; Near-net shape
Introduction
Aluminum based alloys have the advantage of high strength to weight ratio, and therefore they are widely used in the automotive and aerospace industries. The liquid immiscible alloys based on Al– Pb system are potential materials for bearing alloys [1-6] because they possess superior performance like superior friction properties, low cost of production, high thermal conductivity and high corrosion resistance than other aluminum bearing alloys [4,5,7,8]. Processing of Al–Pb alloys by the conventional casting techniques is difficult due to liquid immiscibility in a wide range of temperature and composition; and also large density difference of the constituent phases compared to Al alloys [6,7]. Early attempts to synthesize these alloys by the conventional casting routes had limited success. A slow cooling rate associated with conventional casting processes results in rapid separation of Al and Pb-rich phases [4,9]. In the past, several techniques, different from conventional casting, have been employed to prevent segregation of lead during melt solidification. Techniques based on powder metallurgy [5], stir casting [2,5,6], rheocasting [7], melt spinning [10] and spray forming [4,9], results in a uniform distribution of lead particles in Al matrix. However, some of these techniques are often associated with either a higher energy consumption or generation of coarse grain microstructures. Among these techniques, spray forming possesses several advantages in effective microstructural control together with producing a near-net shape [11-15] preform in a less number of processing steps. Rapid cooling associated with solidification of atomized droplets and a turbulent fluid flow condition on the deposition surface minimizes the separation of the Al- and Pbrich phases [9,16].
In the present work, Al-Si-Pb alloys were spray formed in the form of a disc. The change in porosity with distance from centre to periphery of the deposit and its variation with lead content are reported.
Experimental
A Schematic of spray forming set-up is given elsewhere [17]. The base alloy composition (wt. %) used in the present work consisted of Al-6Si. The alloy was super heated to 200°C above its melting temperature in graphite crucible using an induction furnace. Different amount (0, 10, 15, 20, 25 wt. %) of lead was added in the Al-Si alloy before atomization of the melt. In each run, 800 gm of Al-Si-Pb alloy was charged in crucible. Nitrogen gas was supplied for atomization prior to melt flow. The atomization was carried out at a N2 gas pressure of 10 bar. The spray droplets were deposited over a rotating (240 rpm) copper substrate centered along the axis of the atomizer, which was either inclined to 0°, 15° and 30° or/and offset at a distance of 40 mm from central axis of the atomizer to achieve a disc shape preform for different experimental runs. Preforms were taken out of the substrate after deposition.
In order to investigate porosity, samples were cut from centre of spray deposit with 10, 15, 20 and 25% Pb and then prepared by using standard metallographic technique. These samples were examined for surface porosity by image analysis using the optical microscope ‘Olympus model PM-3-311U’ in conjunction with a computer having image analysis software from ‘Dewinter material plus’.
Surface porosity variation with distance from centre to periphery of the spray deposit was examined by Scanning Electron Microscope (SEM) JEOL JXA 840A.
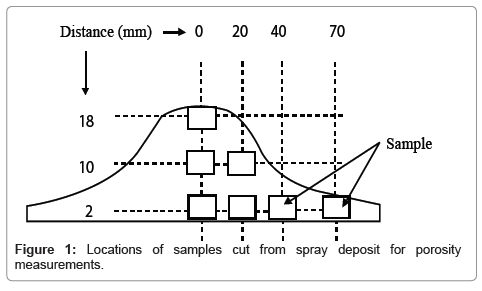
To measure total porosity at different locations of the deposit, samples were cut from different locations as shown in Figure 1. The measured density was determined by Archimedes principle and followed by the ASTM B 328-96 practice. Mean values of three measurements were taken and hence the observed values are equal to mean ± δ. Where δ is the deviation from the mean value.
Results
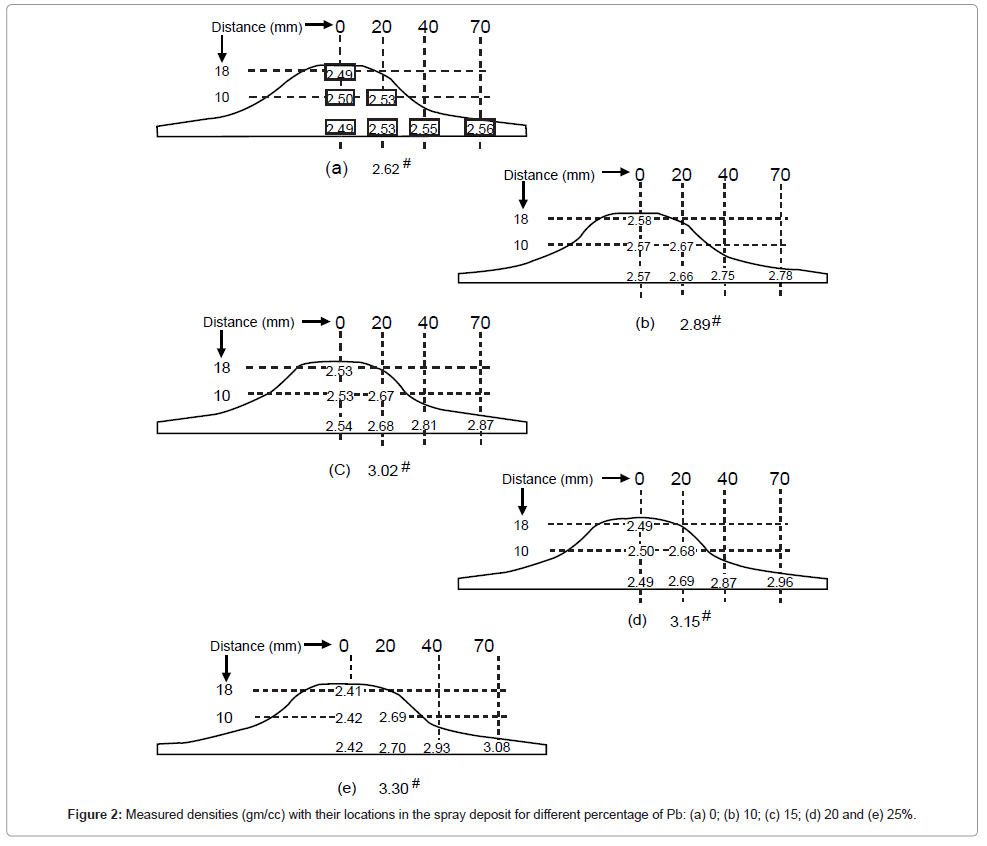
Corresponding theoretical densities calculated by mixture rules for all the alloys and mean value of measured densities with their location are reported in the spray deposit in Figure 2. The deviation of mean value (δ) was found to vary between 0.004 to 0.01 gm/cc.
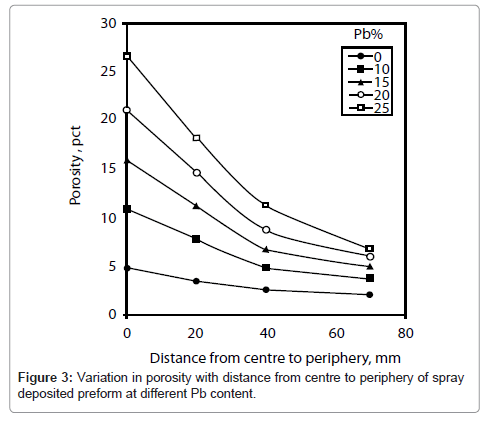
It can be seen that there is no change in density in the thickness direction of the deposit. The change in density and hence the porosity variation is observed with the distance from centre to periphery of the deposit. Therefore, total porosity calculated from these densities is plotted in Figure 3 as a function of distance from centre to periphery of the deposit for various compositions of lead. It can be seen that the porosity decreases with the distance from centre to periphery for all compositions of lead. The decay rate in porosity increases with the increase in lead content. For example, for 0% and 25% Pb average decrease in porosity is 0.27 and 0.036 per unit of distance, respectively. The porosity is higher for higher lead content. Also the decay rate in porosity decreases towards the periphery of the deposit. For example, it is 0.15 per unit of distance for 25% Pb.
The change in porosity with lead content at four different locations viz 0, 20, 40 and 70 mm from centre of the deposit is shown in Figure 4. It can be seen that the porosity increases more rapidly with lead content at centre of the deposit as compared to that of other locations. For example, the average increase in porosity is 0.83 and 0.19 per unit of lead content at the centre and periphery (70 mm from centre), respectively. Initially, the rate of increase in porosity is slow with the increase in lead content. For example, it is 0.61 per unit increase in lead content at centre of the deposit.
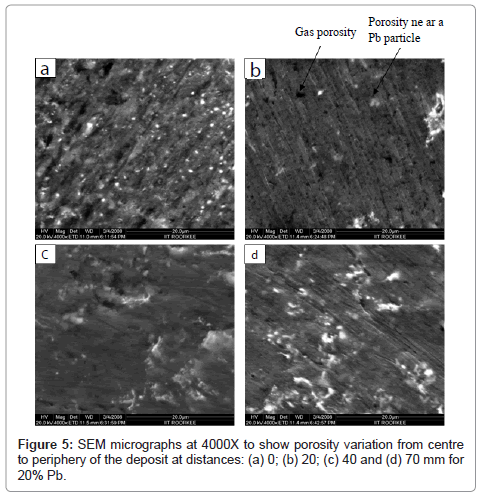
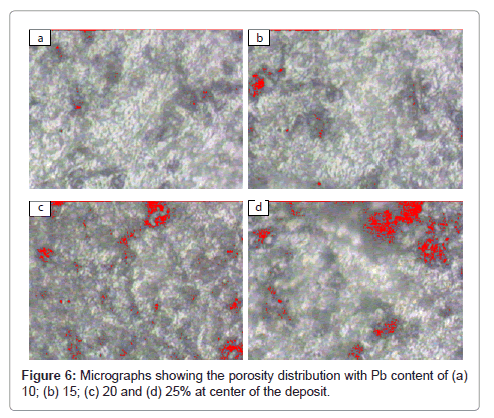
To observe porosity and its distribution with the distance from centre to periphery of the deposit (to see gas velocity effect) and with lead content the recorded micrographs are shown in Figures 5 and 6, respectively. Figure 5 shows porosity for 20% Pb at distances 0, 20, 40 and 70 mm from centre to periphery of the deposit and Figure 6 shows porosity for 10, 15, 20 and 25% Pb at centre of the deposit. Micrographs shown in Figure 6 are taken by Image analyzer. These micrographs were taken at high magnification 4000X to visualize the porosity. The porosity can be due to the gas entrapment, insufficient melt to fill the porosity, and the lead shrinkage (causing porosity near lead particles). In micrographs (a) and (b) of Figure 5, large number of black spots can be seen uniformly distributed throughout the matrix. These spots show gas porosity. This type of porosity seems to be low at periphery i.e. 70 mm distance from centre of the deposit (Figure 5(d)). The size of pores varies from sub-micron to ~ 5μm.
The effect of lead content on porosity is shown in Figure 6 for various lead contents. Red spots in micrographs represent porosity. It can be seen that porosity increases with the increase in lead content. Every micrograph is having two types of areas viz. the first type is having large amount of porosity and the second type is having small amount of porosity. The large and small amount porosity areas belong to the lead rich and aluminum rich area, respectively.
Discussion
The porosity formation can take place due to the gas entrapment, insufficient melt to fill porosity, dissolved gas evolution and solidification shrinkage. All these factors are explained for some metals or alloy systems in the literature [18,19]. In present study some interesting features observed on porosity formation were the decrease in porosity from centre to periphery of the deposit (Figure 4) and the increase in porosity with the increase in lead content (Figure 5). The other feature was more porosity around the lead particles.
The decrease in porosity from centre to periphery can be explained as follows. There can be two reasons. First, the grain size decreases from centre to periphery because the decrease in grain size of aluminum also decreases the grain size of lead droplets [20]. These fine lead droplets pushed into the interstitial voids generated due to solidification of Alrich phase and thereby decrease porosity of the deposit. That is why porosity decreases at a higher rate with the increase in lead content. Second, it can be due to the decrease in gas velocity from centre to periphery of the deposit. High gas velocity at centre can lead to more entrapment of gas in the deposit as compared to that of periphery (Figure 5) and hence more porosity at centre of the deposit. The decrease in porosity with distance from centre to periphery was observed to decrease at a faster rate in initial stage and then at a slow rate. The gas velocity also shows similar trend for decay in velocity with radial distance. Therefore, gas entrapment should be a major reason for the decay in porosity with distance from centre to periphery of the deposit. In contrast to the decay in porosity from centre to periphery of the present study, Sahu et al. [18] have shown an increase in the porosity of the commercially pure aluminum spray formed strip but the reason for it has not been reported.
Surface tension of aluminum decreases [21] by increasing the lead content and hence the flow of aluminum should take place easily. The easy flow of aluminum should decrease the porosity of preform. But it was found that porosity increases by increasing the lead content. The increase in porosity with increase in lead content (Figure 6) can be due to the difference in solidification shrinkage of aluminum and lead. The solidification shrinkage of lead is higher than that of aluminum. In the deposit, lead solidifies after the solidification of aluminum rich phase, so there can be formation of shrinkage cavity around lead particles. Also, by increasing the lead content, the fraction of melt (as Pb) increases on the deposition surface. More melt will give rise to more solidification shrinkage porosity.
There can also be significant dissolution of hydrogen in the Al-Si- Pb alloy. This hydrogen comes from the humidity and it can dissolve mainly in aluminum because in lead its solubility is very low [18]. Therefore, the decrease in lead content should decrease the porosity but the reverse is true in the present study. Hence, the former reason of solidification shrinkage explained above dominates over this factor of gas dissolution.
The lower rate of increase in porosity at the periphery as compared to centre of the deposit with the increase in lead content can be explained as follows. The droplets or particles depositing at periphery will travel more distance and also with low velocity in the low gas velocity field as compared to that of at centre of the deposit [20]. Therefore, temperature of these droplets should be lower than that of at the centre of the deposit. It should be noted that lead will be in molten state at both the locations because aluminum will keep it in molten state. So, the lead in droplets at the periphery will solidify from a lower temperature as compared to that of at the centre of the deposit and hence lesser solidification shrinkage at the periphery. Less solidification shrinkage leads to the less rate of porosity increase at periphery as compared to that of at the centre.
Conclusions
The porosity of the Al-Si-Pb spray deposited alloy increases with the increase in lead content and decreases with the distance from centre to periphery of the deposit. It remains constant with thickness of the deposit. The effect of lead content on porosity decreases with the distance from centre to periphery of the deposit. The areas having large and small amount of porosity were observed in the micrograph of Al- Si-Pb alloys. The large and small amount porosity areas belong to the lead and aluminum rich areas, respectively.
References
- Mohan S, Pathak JP, Sarkar S, Chander N (2007) Surface studies of centrientrifugally cast aluminium based lead bearing alloys. J Reinf Plast Comp 11: 37-42.
- Guang R, Jing-En Z, Shengqi Xi, Pengliang Li (2006) Microstructure and morphology of Al-Pb bearing alloy synthesized by mechanical alloying and hot extrusion. J Alloy Compd 419: 66-70.
- AnJ, Liu YB, Lu Y, Zhang QY (2003) The formation of reacted film and its influence on tribological properties of extruded Al-Si-Cu-20-25Pb alloy under dry sliding. J Mater Sci 38: 1975-1982.
- Yu F, Dwarakadasa DS, Ranganathan S (2003) Microstructure and mechanical properties of spray-formed Al-Si-Pb alloys. J Mater Process Technol 137: 164-167.
- An J, Dong C, Zhang QY (2003) Improvement of the wear behavior of stircast Al-Si-Pb alloys by hot extrusion. Tribol Int 36: 25-34.
- AnJ, Liu YB, Lu Y (2004) The influence of Pb on the friction and wear behavior of Al-Si-Pb alloys. Mater Sci Eng A 373: 294-302.
- FangX, Fan Z (2006) Rheo-die casting of Al-Si-Pb immiscible alloys. Scripta Mater 54: 789-793.
- Padhi P, Anand Santosh K, Kar Debashis, Ghosh S, Panigrahi SC (2006) Modeling structure of Al-Sn alloys. Mater Sci Forum 519-521: 1519-1524.
- Rudrakshi GB, Srivastava VC, Pathak JP, Ojha SN (2004) Spray forming of Al-Si-Pb alloys and their wear characteristics. Mater Sci Eng A 383: 30-38.
- Suh YC, Lee ZH (1995) Nucleation of liquid Pb-phase in hypermonotectic Al-Pb melt and the segregation of Pb-droplets in melt-spun ribbon. Scripta Metall Mater 33: 1231-1237.
- Cui C,Fritsching U, Schulz A (2007) Three-Dimensional Mathematical Modeling and Numerical Simulation of Billet Shape in Spray Forming Using a Scanning Gas Atomizer. Metall Mater Trans B 38: 333-346.
- Ojha KV, Tomar A, Singh D, Kaushal GC (2008) Shape, microstructure and wear of spray formed hypoeutectic Al-Si alloys. Mat Sci Engg A 487: 591-596.
- Mi J, Grant PS (2008) Modelling the shape and thermal dynamics of Ni superalloy rings during spray forming Part 1: Shape modelling – Droplet deposition, splashing and redeposition. Acta Mater 56: 1588-1596.
- Liu DM, Zhao JZ, Li M (2009) Modelling and experimental verification of tubular product formation during spray forming. Trans Nonferrous Met Soc China 19: 661-667.
- Mittal R, Singh D (2012) Dry sliding wear behavior of spray formed ZrSiO4 reinforced Al-Si-Sn alloy. Adv Mat Lett 3: 38-43.
- Rudrakshi GB, Srivastava VC, Ojha SN (2007) Microstructural development in spray formed Al-3.5Cu-10Si-20Pb alloy and its comparative wear behaviour in different environmental conditions. Mater Sci Eng A 457: 100-108.
- Leatham AG, Ogily A, Elias L, Princeton NJ (1993) P/M, in aerospace, Defence and Demanding Applications. Metal Powder Industries Federation, Princeton NJ 165.
- Sahu KK, Dube RK, Koria SC (2009) Aspects of porosity formation in spray deposited thin aluminium strip. Powder Metall 52: 135-144.
- Muller HR, Ohla k, Zauter R, Ebner M (2004) Effect of reactive elements on porosity in spray formed copper alloy Billets. Mater Sci Eng A 383: 78-86.
- Mittal R, Tomar A, Singh D (2012) Thickness uniformity and microstructure of disc shape spray formed Al-Si-Pb alloys. Adv Mat Lett 3: 55-63.
- Candan E (2006) Effect of alloying addition on the porosity of SiCp Preforms infiltrated by aluminium. Mater Lett 60: 1204-1208.
Relevant Topics
- Additive Manufacturing
- Coal Mining
- Colloid Chemistry
- Composite Materials Fabrication
- Compressive Strength
- Extractive Metallurgy
- Fracture Toughness
- Geological Materials
- Hydrometallurgy
- Industrial Engineering
- Materials Chemistry
- Materials Processing and Manufacturing
- Metal Casting Technology
- Metallic Materials
- Metallurgical Engineering
- Metallurgy
- Mineral Processing
- Nanomaterial
- Resource Extraction
- Rock Mechanics
- Surface Mining
Recommended Journals
Article Tools
Article Usage
- Total views: 7513
- [From(publication date):
September-2012 - Aug 17, 2025] - Breakdown by view type
- HTML page views : 2896
- PDF downloads : 4617
