Prediction of Fat Content in Intact Cocoa Beans Using Near Infrared Reflectance Spectroscopy
Received: 05-Jun-2014 / Accepted Date: 21-Jul-2014 / Published Date: 23-Jul-2014
Abstract
The majority of Indonesia’s cocoa export is raw beans which accounted by 82% of the total export. Indonesian cocoa beans are only used as additional material by cocoa industrialized countries due to low quality. The objective of this research was to study and analyze the application of near infrared reflectance spectroscopy (NIRS) method coupled with partial least squares (PLS) to determine the quality of cocoa particularly to predict the fat content in intact cocoa beans which has never been conducted before. Besides, this research was also to study the application of six spectra pre-processing methods i.e. mean centering (MC), multiplicative scatter correction (MSC), standard normal variate (SNV), mean normalization (MN), orthogonal signal correlation (OSC) and de-trending (DT) in increasing the performance of PLS. It is found in this study that PLS combined with MSC and SNV provide prediction value with root mean square error calibration (RMSEC) were 0.93% and 0.91% respectively, whilst root mean square error prediction (RMSEP) and ratio of performance to deviation (RPD), generated from both spectra pre-processing were similar i.e. 1.11% and 1.95 respectively.
Keywords: Cocoa beans; Quality; NIR spectra pre-treatment
Introduction
Indonesia is acknowledged as the third world largest cocoa beans exporter. As raw material for chocolate, cocoa beans role as strategic estate commodity which generated US$ 1.345 billion of foreign exchange revenue in 2011. The Indonesian annual production of cocoa beans is about 550 thousand tons which grown over Sulawesi, Papua, Java and Sumatera. Cocoa bean from Indonesia, accounted by 82% of the total cocoa export, is only used as additional material by cocoa industrialized countries. However, the value of this commodity still can be increased by improving the quality of cocoa beans to comply the demand of destined countries in ASEAN, USA, European Union and China. Thus, rapid and appropriate cocoa beans quality determination method is required in order to provide high quality product required by consumers [1-3].
Near infrared reflectance spectroscopy (NIRS) has become one of the most promising and used non-destructive methods of analysis in many field areas including in agriculture due to its advantage; simple sample preparation, rapid, and environmental friendly since no chemical materials are used. More importantly, it has the potential ability to determine multiple quality parameters simultaneously [4]. Several researches concerning on NIRS application for cocoa have been conducted, including raw cocoa beans that made into powder, [5-7] cocoa powder, [8-10] raw cocoa liquors and roasted cocoa liquors, [11] cocoa butter and liquid cocoa, [12] commercial cocoa, [13] and dark chocolate [14]. Spectra comparison generated from raw cocoa beans powder, roasted cocoa powder, chocolate mass and fine chocolate had been carried out [15]. Material used by those researchers was processed cocoa or powder cocoa. However, Indonesia as cocoa beans exporter requires cocoa quality determination in the form of intact or unprocessed beans.
In order to generate robust calibration model used for food analysis, PLS is one of widely used quantitative analysis method. PLS leads to a reduction in the number of latent variables where the convergence of the system to the minimum residual error is often achieved in fewer latent variables. Meanwhile, research regarding the use of NIRS has applied spectra correction to obtain reliable, accurate and robust model. It was due to the heterogeneity of cocoa beans characteristics and the performance of spectra correction. SNV removes the multiplicative interferences of scatter, particle size, and the change of light distance as well as MSC. It corrects both multiplicative and additive scatter effects. MC is often the simply preferred preprocessing method prior calibration development as it focuses on differences between observations rather than their absolute values. MC ensures that the resulting data or model may be interpreted in terms of variation around the mean. It was applied to all spectras (calibration and prediction). The purpose of MN is to scale samples in order to get all data on approximately the same scale based on area, mean, range, maximum, peaks and unit vector. All spectra data were also normalized as mean normalization. OSC used for correction of instrumental drift, bias and scatter in NIR spectra. The OSC seek to correct X data matrix; NIR spectra data by removing the information from the spectra that is orthogonally uncorrelated to the Y data matrix; reference quality attributes data. This is was done in order to avoid the removal of useful information that is important for modeling, and removes only the irrelevant variation that creates problems for the regression model. This treatment is applied jointly to all the spectra in the calibration set. DT tends to remove nonlinear trends in spectroscopic data. It calculates a baseline function as a least squares fit of a polynomial to the sample spectral data. DT was applied to individual spectra [16,17].
In previous research, it had been revealed that spectra of intact cocoa beans found in individual bean were similar to stacked cocoa beans [18]. Thus, this research was regarded as further study to predict fat content in intact cacao beans which had never been conducted before by any researchers. The objective of this research was to test and analyze the quality of intact cacao beans particularly the fat content using NIRS method. This research used PLS as regression approach. Besides, this research also studied the uses of 6 spectrum correction methods in increasing the performance of PLS.
Materials and Methods
Time and venue
The research was conducted from July 2012 up to February 2013 in Indonesian Coffee and Cocoa Research Institute (ICCRI), Indonesia and Georg-August-University of Göttingen (GAUG), Germany. Samples were collected in ICCRI, Indonesia. Meanwhile, spectra acquisition by NIRS, fat content determination by standard laboratory methods, were carried out in GAUG, Germany.
Cocoa sample
Material used in this research was cocoa cv.“Lindak”, harvested on July till August and came from the same orchards. Harvested cocoa was dried using mechanical dryer to obtain cocoa beans which suitable for storage. Dried cocoa beans were sorted and packed in a sealed plastic stored at cold storage below 20°C temperature prior transported to Göttingen, Germany.
The following step was to package 40-45 g of cocoa beans per each sample into a sealed plastic and then labeled. The total sample packages were 110. All samples were stored at temperature approximately 20°C for about 2 weeks. Cocoa powder was obtained by grinding cocoa beans and sieved at 24 mesh to produce uniform size and then stored using sealed labeled plastic bottle.
NIRS spectra acquisition
NIR spectra data of all samples were acquired using a benchtop fourier transform near infrared (FT-NIR) instrument (Thermo Nicolet, Antaris model MDS-method development sampling). Sample measurement with integrating sphere was chosen as a basic measurement in this study. Background spectra correction was performed every hour automatically. Cocoa beans sample in a bulk form, amounted 40 – 45 grams, were placed manually into the cup and it rotates for 360 degree during spectra acquisition. Diffuse reflectance spectra in wavelength range of 1000 – 2500 nm with the increment of 2 nm resolution were acquired 64 times and averaged. The spectra of cocoa were collected at two different forms, i.e. intact cocoa beans and cocoa powder. The spectra of intact cocoa beans were acquired by placing cocoa beans into cup arranged in compact, multi-layered and piled with minimum air space among beans. During spectra acquisition, the cup was set to rotate 360 degree. Meanwhile, the spectra of powder cocoa were acquired by placing powder cocoa into cup which also set to rotate 360 degree. Spectra acquisition of intact cocoa beans and cocoa powder for similar sample were taken at the same day [18].
Fat content
Fat content was determined using Soxhlet method [10]. Ten gram of sample was mixed in the tube with maximum 150 ml n-hexane and extracted in soxhlet apparatus set at 95°C for 6 hours. Once this process is complete, n-hexane was evaporated using rotary evaporator until it is only fat liquid is left in the tube. These liquid fat were dried at 105°C for 30 minutes.
Spectra analysis
Spectra analysis was computed using Unscrambler software® X version 10.1. Spectra data correction was performed using six spectrum correction methods i.e. mean centering (MC), multiplicative scatter correction (MSC), standard normal variate (SNV), mean normalization (MN), orthogonal signal correlation (OSC) and de-trending (DT).
Partial least square (PLS) was used to predict fat and moisture content which also compared with the laboratory result test. PLS regression is one of the most popular methods for multivariate calibration of NIR spectra data. PLS takes X (NIR spectra data) and Y (desired quality attributes) matrices into account when developing the models to find the latent (or hidden) variables in X that will best predict the latent variables in Y. PLS maximizes the covariance between X and Y. In this case, convergence of the system to a minimum residual error is often achieved in fewer factors. PLS also leading to the reduction of the number of latent variable [17,19].
Calibration and validation
Calibration models were developed to predict fat content based on raw and pre-processed spectra. Samples were split into calibration and validation datasets. PLS calibration with ten-segments full cross validation was applied to establish these models. The capability of calibration models were quantified by predicting quality attributes of external validation samples.
Prior to calibration model development, original NIR spectra acquired from the NIR instrument were analyzed through principal component analysis (PCA). It was important to select data for calibration in order to obtain a robust model. PCA employs a mathematical procedure that transforms a set of possibly correlated response variables into a new set of non-correlated variables, called principal components. The first principal component accounts for as much of the variability in the data as possible, and each succeeding component accounts for as much of the remaining variability as possible. PCA is used as a tool for screening, extracting, compressing and discriminating samples based on their similarities or dissimilarities of multivariate data. In this study, all data were subjected to PCA in accordance with the Y value (measurement reference value), and then used 65% of the data for calibration set and the remaining 35% was used for prediction set. In order to obtain good calibration and prediction data set, some requirements should be met including: data used for prediction set should be in the range of calibration set, and prediction dataset should evenly distributed. Based on this portion (65%: 35% for calibration and prediction respectively), a total 72 samples were used for calibration while 38 samples for prediction set.
The reliability of the model was determined using correlation coefficient (r) and root mean square error calibration (RMSEC) parameters. A good model was determined by high value of correlation coefficient and low value of RMSEC. Subsequently, cross validation at selected spectra was conducted using K-fold cross validation method. In this study, samples were divided into 10 folds (segments) with randomized average 7 samples per segment. The reliability of cross validation was determined using r and root mean square error cross validation (RMSECV) [20,21].
Once calibration step is completed, the models were quantified using prediction dataset. The model reliability was determined using statistic parameters including r value, root mean square error prediction (RMSEP), and ratio of performance to deviation (RPD) value. It is obvious that an ideal model should have high value of r and RPD, but low value of RMSEP. Additionally, the RMSEP should be also lower than SD of actual studied data [22,23].
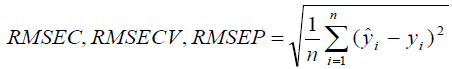
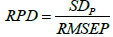
Where ŷi is the predicted value of the i-th observation. yi is the measured value of the i-th observation from desired quality attributes. n is the number of observations in the calibration, validation or prediction set. SDP is standard deviation for the prediction data.
Result and Discussion
Calibration and Validation Data Set
Descriptive statistics for fat content measurement in calibration and prediction dataset are described in Table 1.
| Set of data | Number of data | Fat content | ||
|---|---|---|---|---|
| Range (%) | Mean | SD | ||
| Calibration | 72 | 35.3-44.3 | 40.7 | 2.19 |
| Prediction | 38 | 36.5-45.8 | 40.6 | 2.16 |
SD = standard deviation
Table 1: Reference measurement in calibration and prediction set
Cocoa Beans Spectra
Generally, the spectra collected from intact cocoa beans and cocoa powder had quite similar pattern (Figure 1). Obvious peak in wavelengths at around 1460 nm and 1940 nm (moisture bands) were found in both spectra. However, detail figure shows that the peak spectra indicating the fat content, are more easily seen in the NIRS spectra generated by cacao powder rather than found in intact cacao beans. In the previous study, [18] found the wavelength that generates information of fat content ranges from 1200-1220 nm, 1730- 1750 nm, 1755-1775 nm, 2320-2340 nm and 2340-2360 nm. Similar findings also noted by other researchers for cocoa bean, cocoa powder and commercial chocolates that effective wavelengths for fat content prediction are: 1200, 1730, 1744, 1760, 2250-2300, 2322, 2334, 2340, 1243 and 2360 nm [10,13,15].

Figure 1: Intact cocoa beans and cocoa powder spectra
Fat content calibration and prediction
Cocoa beans with fat content of 35.3% – 45.8% were used in this research. PLS analysis for fat content measurement was conducted with spectra correction treatment (Table 2).
| Spectra Correction | # LVs | Calibration | Prediction | |||
|---|---|---|---|---|---|---|
| r | RMSEC (%) | RMSECV (%) | RMSEP (%) | RPD | ||
| Non spectra correction | ||||||
| Cocoa powder | 8 | 0.89 | 0.99 | 1.28 | 1.07 | 2.02 |
| Intact cocoa beans | 10 | 0.85 | 1.15 | 1.58 | 1.31 | 1.65 |
| MSC | ||||||
| Cocoa powder | 7 | 0.90 | 0.94 | 1.21 | 1.06 | 2.05 |
| Intact cocoa beans | 4 | 0.91 | 0.93 | 1.50 | 1.11 | 1.95 |
| SNV | ||||||
| Cocoa powder | 7 | 0.90 | 0.94 | 1.17 | 1.06 | 2.05 |
| Intact cocoa beans | 4 | 0.91 | 0.91 | 1.38 | 1.11 | 1.95 |
| MC | ||||||
| Cocoa powder | 9 | 0.90 | 0.95 | 1.20 | 1.12 | 1.93 |
| Intact cocoa beans | 10 | 0.85 | 1.15 | 1.68 | 1.19 | 1.82 |
| MN | ||||||
| Cocoa powder | 8 | 0.89 | 0.98 | 1.21 | 1.11 | 1.95 |
| Intact cocoa beans | 9 | 0.86 | 1.10 | 1.59 | 1.19 | 1.82 |
| OSC | ||||||
| Cocoa powder | 6 | 0.90 | 0.95 | 1.17 | 1.09 | 1.98 |
| Intact cocoa beans | 4 | 0.90 | 0.93 | 1.56 | 1.15 | 1.88 |
| DT | ||||||
| Cocoa powder | 9 | 0.91 | 0.89 | 1.18 | 1.20 | 1.80 |
| Intact cocoa beans | 9 | 0.87 | 1.07 | 1.57 | 1.23 | 1.76 |
Table 2: Calibration and prediction result to fat content of cocoa beans
In the prediction of fat content without spectra correction, as shown in Figure 2, it can be seen that cocoa powder had higher r value, lower RMSEC and RMSEP compared to intact cocoa beans. Thus, it may be concluded that cocoa powder had better prediction result compared to intact cocoa beans. In accordance with RPD result, it was found that RPD value for cocoa powder and intact cocoa beans were 2.02 and 1.65, respectively. The good performance of a model is indicated by RPD value ranging from 2 – 3. If RPD value ranges from 1.5 to 2, it means that the performance of model is sufficient which still appropriate for rough quantitative prediction [24]. Moreover, latent variables used for cocoa powder prediction was fewer than intact cocoa beans. Thus, it can be concluded that fat content prediction for cocoa powder was more efficient than intact cocoa beans.

Figure 2: Scatter plot of predicted and measured fat content based on noncorrected spectra (a) for cocoa powder, (b) intact cocoa bean.
The differences on the reliability and robustness generated from prediction result of intact cocoa beans and cocoa powder could be due to the round and irregular flat shape of cocoa beans. The shape of cocoa beans creates air space inside the cup which can scatter the spectra. Besides, air space inside the cup also contributes in reducing the acquisition performance of NIRS. In contrast, the condition of scattered spectra was not occurred in cocoa powder where the powder was uniform and fine.
The application of spectra corrections gave different result in the fat content prediction of intact cocoa beans and cocoa powder (Figure 3). It obviously increase the prediction performance compared to untreated spectra. Correction using MSC and SNV could increase the performance and model robustness generated from cocoa powder acquisition which can be seen from r, RMSEC, RMSEP and RPD value. Meanwhile, the application of spectra corrections using MSC and SNV in intact cocoa beans could give tremendous increases on the performance and model robustness which can be seen from the significant increases of r, RMSEC, RMSEP and RPD value.

Figure 3: Scatter plot of predicted and measured fat content based on (a) MSC cocoa powder (b) SNV cocoa powder, (c) MSC intact cocoa bean (d) SNV intact cocoa bean.
Spectra corrections, MSC and SNC, have ability to remove multiplicative interferences of scatter, particle size, and the change of light distance. They are also known could improve the multiplicative effect and additive scatter. All those abilities are very important in reducing the effect of air space among cocoa beans and air space inside the bean. Those were thought as factors that made MSC and SNV in this study, as the fittest spectra correction methods that could enhance the performance and robustness of PLS result for intact cacao beans with similar r value i.e. 0.91, similar RMSEP value i.e. 1.11% and similar RPD value i.e. 1.95. Accordingly, the RMSEC generated from MSC and SNV was 0.93% and 0.91%.
Moreover, spectra corrections could give significant increment on the efficiency result. In cocoa powder, it was found that OSC had the highest ability in reducing the latent variables from 8 to 6. Meanwhile, MSC, SNV and OSC could significantly reduce latent variables from 10 to 4. Several references mentioned that OSC together with PLS is the most applicable spectra correction in spectra processing that could reduce latent variables.
Conclusion
The application of PLS together with spectra correction method in intact cocoa beans gave better prediction result compared to PLS without spectra correction which indicated by higher r value, lower RMSEC and RMSEP value and higher RPD value. In this research, MSC and SNV generated prediction result which considered having sufficient performance with RPD and RMSEP value were 1.95 and 1.11%, respectively. Thus, MSC and SNV were found as the fittest spectra correction methods. It was also found that OSC, MSC and SNV could reduce the high number of latent variables of PLS prediction result in intact cocoa beans. Thus, it suggested that these three spectra correction methods could increase the prediction efficiency.
Acknowledgements
The first author would like to express his gratitude to the Directorate General of Higher Education, Ministry of Education and Culture of Indonesia for the financial support through Sandwich-Like Scholarship Program year 2012. Also sincerely acknowledge to Dr. Sukrisno for his valuable support in preparing cocoa samples in Indonesian Coffee and Cocoa Research Institute. Dr. Daniel Mörlein and Prof. Dr. Elke Pawelzik for their support and permit for using NIRS facilities in Abteilung Qualität Tierischer Erzeugnisse (Division of Animal Quality Products) and Abteilung Qualität Pflanzlicher Erzeugnisse (Division of Plant Quality Products), Georg- August- University of Göttingen, Germany.
References
- Hasibuan AM, Nurmalina R, Wahyudi A (2012) Performance Analysis and Trade Competitiveness of Indonesian Cocoa Beans and Cocoa Processed Products in International Market (in bahasa Indonesia). Bul RISTRI 3: 57-70.
- Rubiyo, Siswanto (2012) Increased Cocoa Production and Development in Indonesia (in bahasa Indonesia). Bul RISTRI 3: 33-47.
- Ragimun (2013) Competitiveness Analysis of Indonesian Cocoa Commodities (in bahasa Indonesia).
- Munawar AA (2014) Multivariate Analysis and Artificial Neural Network Approaches of Near Infrared Spectroscopic Data for Non-Destructive Quality Attributes Prediction of Mango. Phd Thesis. Georg-August University, Goettingen.
- Nielsen DS, SnitkjaerP, Berg Fv (2008) Investigating the Fermentation of Cocoa by Correlating Denaturing Gradient Gel Electrophoresis Profiles and Near Infrared Spectra. J Food Microbiology 125: 133–140.
- Aculey PC, Snitkjaer P, OwusuM, BassompiereM, TakramaJ, et al.(2010)Ghanaian Cocoa Bean Fermentation Characterized by Spectroscopic and Chromatographic Methods and Chemometrics. J Food Science 75: 300-3007.
- HueC, GunataZ, BergounhouA, AssematS, BoulangerR, et al. (2014) Near Infrared Spectroscopy as a New Tool Determine Cocoa Fermentation Levels Through Ammonia Nitrogen Quantification. J Food Chemistry : 240-245.
- Kaffka KJ, NorrisKH, KulcsárF, Draskovits I(1982) Attempts to Determine Fat, Protein and Carbohydrate Content in Cocoa Powder by The NIR Technique. Acta Alimentaria 11: 271-288.
- Permanyer JJ and PerezML (1989) Compositional Analysis of Powdered Cocoa Products by Near Infrared Reflectance Spectroscopy. J Food Sci 54 : 768-769.
- Vesela A, BarrosAS, SynytsyaA,Delgadillo I, CopikovaJ, et al.(2007) Infrared Spectroscopy and Outer Product Analysis for Quantification of Fat, Nitrogen, and Moisture of Cocoa Powder. J Analytica Chimica Acta 601 : 77–86.
- Whitacre E, Oliver J, Den BroekRv, EngelenPv, KremersB, et al.(2003) Predictive Analysis of Cocoa Procyanidins Using Near-Infrared Spectroscopy Techniques. J Food Sci 68: 2618 – 2622.
- Bolliger S, Zeng Y, WindhabEJ (1999) In-line Measurement of Tempered Cocoa Butter and Chocolate by Means of Near-Infrared Spectroscopy. J. Am. Oil Chem Soc. 76: 659–667.
- Moros J, Inon FA, Garrigues S, Guardia M de la (2007) Near-Infrared Diffuse Reflectance Spectroscopy and Neural Networks for Measuring Nutritional Parameters in Chocolate Samples. J Analytica Chimica Acta 584: 215–222.
- CambraiA, Marcic C, Morville S, Houer PS, Bindler F, et al. (2010) Differentiation of Chocolates According to The Cocoa’s Geographical Origin Using Chemometrics. J. Agric Food Chem 58.
- Davies AMC, Franklin JG, Grant A, Griffiths NM, Shepherd R,et al.(1991) Prediction of Chocolate Quality from Near-Infrared Spectroscopic Measurements of the Raw Cocoa Beans. J Vibrational Spectroscopy 2: 161-172.
- Cen H, He Y (2007) Theory and Application of Near Infrared Reflectance Spectroscopy in Determination of Food Quality. J Trends in Food Sci & Technol 18: 72-83.
- Zulfahrizal, Sutrisno, Budiastra IW, Seminar KB, Munawar AA (2013) Near Infrared Reflectance Spectra Acquisition of Cocoa Beans (in bahasa Indonesia). Bul RISTRI 4: 1-10.
- Felizardo P, Baptista P, Menezes JC, Correia MJN (2007) Multivariate Near Infrared Spectroscopy Models for Predicting Methanol and Water Content in Biodiesel. Analytica Chimica Acta. 595: 107-113.
- Jha SN, Kingsly ARP, Chopra S (2006) Non-Destructive Determination of Firmness and Yellowness of Mango During Growth and Storage Using Visual Spectroscopy. Biosystems Engineering. 94: 397-402.
- Flores K, Sanchez MT, Perez-Marin D, Guerrero JE, Garrido-Varo A (2009) Feasibility in NIRS Instruments for Predicting Internal Quality in Intact Tomato. J. Food Engineering. 91: 311-318.
- Naes T, Isaksson T, Fearn T, Davies T (2004) A User-Friendly Guide to Multivariate Calibration and Classification. Chichester, UK: NIR publications.
- Sinelli N, Spinardi A, Di Egidio V, Mignani I, Casiraghi E (2008) Evaluation of Quality and Nutraceutical Content of Blueberries (Vaccinium corymbosum L.) by Near and Mid-Infrared Spectroscopy. Postharvest Biology and Technology. 50: 31-36.
- Nicolai BM, Beullens K, Bobelyn E, Peirs A, Saeys W, et al.(2007) Nondestructive Measurement of Fruit and Vegetable Quality by Means of NIR Spectroscopy: a Review. Postharvest Biology and Technology. 46: 99-11.
Citation: Zulfahrizal, Sutrisno, Seminar KB, Munawar AA, Budiastra IW (2014) Prediction of Fat Content in Intact Cocoa Beans Using Near Infrared Reflectance Spectroscopy. Adv Crop Sci Tech 2:134. doi: 10.4172/2329-8863.1000134
Copyright: © 2014 Zulfahrizal, et al. This is an open-access article distributed under the terms of the Creative Commons Attribution License, which permits unrestricted use, distribution, and reproduction in any medium, provided the original author and source are credited.
Select your language of interest to view the total content in your interested language
Share This Article
Recommended Journals
Open Access Journals
Article Usage
- Total views: 3828
- [From(publication date): 0-2014 - Dec 09, 2025]
- Breakdown by view type
- HTML page views: 2907
- PDF downloads: 921