Predictive Models for Incidence and Economic Burden of Liver Cancer in Saudi Arabia
Received: 23-Jun-2015 / Accepted Date: 28-Jul-2015 / Published Date: 31-Jul-2015 DOI: 10.4172/2161-1165.1000193
Abstract
Hepatocellular carcinoma (HCC) is a major cause of cancer-related death worldwide, and the burden of this devastating disease is expected to increase. The variability in the incidence and prevalence of this disease is documented in many epidemiological studies. This variation may be attributed to the variation in the prevalence of major risk factors such as, smoking, drinking, gender, hepatitis B and C viral infection and the Nonalcoholic Fatty Liver Disease (NAFLD). In order to understand the role of such risk factors in the disease etiology a surveillance system with rich data should be available. We intend to use the Saudi Cancer Registry (SCR) data to establish the relationship between age, gender, and the HCC incidence, and the future burden in terms of the forecasted number of liver cancer cases. Moreover we shall link the information available from the Saudi Transplant Registry (STR) with a model that utilizes the number of forecasted HCC cases to predict the future number of needed liver transplants, and hence the economic burden for the next 10 years. This is done by using the Poisson regression model for count data. The projected information will be reported (within limits of uncertainty) and is expected to play a critical role in guiding health officials on future disease patient management.
Keywords: Hepatocellular carcinoma; Risk factors; Saudi cancer registry; Count regression models; Incidence prediction; Goodness of fit
163324Introduction
Hepatocellular Carcinoma (HCC) is ranked the third most common cause of cancer-related deaths worldwide, and each year, approximately 750,000 new cases are diagnosed [1]. Bruix and Sherman [2] emphasized the need for effective surveillance system in order to gauge the magnitude of the anticipated burden of the disease. The frequently cited source of information on the worldwide incidence of major types of cancer is the GLOBOCAN. The information provided highlighted the global variation in the incidence of HCC with the highest incidence clustering in developing countries [3,4] with 55% in China. This worldwide variation in the incidence of this disease can be attributed to variations in the distributions of risk factors. In most HCC cases, patients are initially affected with liver cirrhosis [5,6]. The key risk factors for liver cirrhosis are the hepatitis B and C infection. Other documented risk factors are smoking, gender, age, obesity, and diabetes, through their associations with nonalcoholic fatty liver disease (NAFLD).
In Saudi Arabia, information regarding liver cancer and other types of cancers are available from the Saudi National Cancer Registry (SCR). The Saudi Cancer Registry (SCR) “is a combination of active and passive system responsible for the collection, maintenance, and dissemination of high quality population-based cancer data”. The SCR consists of a central office, 5 regional offices, and 5 offices at the Medical Services Divisions or Oncology Departments [7].
In the SCR there are over 170,000 cancer cases that were received from 1994-2010 from over 500 governmental and private hospitals, physician's offices, cancer treatment centers, and pathology laboratories located throughout Saudi Arabia. The SCR collects information, such as the type and site of cancers that occur, extent of cancer at the time of diagnosis, and patient characteristics. The Saudi Cancer Registry (SCR) of Saudi Arabia is a population-based registry established in 1992 under the jurisdiction of the Ministry of Health (MOH). The SCR commenced reporting cancer cases from 01 January 1994. The primary goal of the SCR is to define the population-based incidence of cancer in Saudi Arabia. Additional objectives include programs for early detection and cancer screening, as well as cancer research projects. In 2013, it became under the umbrella of Saudi Health Council. For each cancer type, the age standardized incidence (ASI), the number of cases, gender, and region from which the data are made available, are provided. One can then utilize two important risk factors (age and gender) provided in the registry to construct a prediction model for both incidence and count of HCC cases. A recent review [8] reported that the ASI of HCC peaked in the age interval 40 to 65 for both males and females. No attempt was made in this review to link the HCC with its risk factors in Saudi Arabia.
In this manuscript we use the SCR data from 1997 to 2010 (data for 2011-2014 are not officially published) to detect the trend of the disease and attempt to predict the number of HCC cases over the next 10 years. One of the fundamental contributions of our study is to construct a predictive model for HCC incidence based on the Saudi registry data. We shall establish a mathematical relationship between the incidence rate and age, for each gender separately, and provide statistical evidence supporting the hypothesis that the disease incidence is significantly higher among males relative to females. Application of predictive model in health care is becoming an area of interest to clinicians and decision makers. As a third objective we shall use the predicted information regarding the HCC incidence to predict the future burden of the disease in terms of liver transplant costing.
The paper is structured as follows. In Section 2 we investigate the widely known risk factors for HCC and report on their distributions in Saudi. In Section 3 we construct statistical models for HCC count prediction and the relationship with the future needs for the liver transplants. A general discussion will be given in Section 4.
Risk Factors of HCC in Saudi Arabia
Hepatitis B and C infection
The most common risk factor for liver cancer is chronic infection with the hepatitis B virus (HBV) and hepatitis C virus (HCV). Individuals chronically infected with HBV and HCV are more likely to develop liver cancer than uninfected people because the virus directly and repeatedly attacks the liver, which over time can lead to progressive liver damage and liver cancer. This association between chronic HBV infection and HCC has been demonstrated in many studies [9-11]. HCC can develop in patients with HBV even when cirrhosis is absent. Co-infection with HCV has also been implicated in an elevated risk of HCC. Some studies suggested that the dual infection of both HBC and HCV may increase the risk of the disease even higher [12]. Globally, 78% of HCC was attributed to HBV (53%) or HCV (25%) [13]
Reports on the incidence and prevalence of HBV and HCV in Saudi Arabia are based on cross-sectional investigations in regions within the country or subgroup of individuals [14]. For example, a study in south west of the country, reported that HCV contributes significantly less than HBV in the development of HCC. Since measuring the incidence of both infections on the population level is a difficult task, and indeed impractical [15-18], it is therefore impossible to establish a causal relationship between the HCC and viral infections.
Smoking
Tobacco smoking is classified by IARC [19] as a cause of liver cancer; and smoking by either parent (pre-conception or during pregnancy) is classified as a cause of childhood hepatocellular carcinoma. Chemical material in cigarette smoke are metabolized and activated as carcinogens in the liver. Therefore it can “act as an initiator in the liver, whereas HBV and HCV mainly act as promoter through chronic inflammation and cell proliferation through chronic hepatitis and liver cirrhosis” [20]. Two studies [21,22] conducted on populations of Chinese origin, known to have high prevalence of HCC, but very low prevalence of alcohol consumption, provided “strong” evidence that smoking is a probable causal factor for HCC development. The study in ref. [19] demonstrated that a dose response relationship exists between the amount and duration of tobacco use and HCC.
In Saudi Arabia most of the reports on smoking focused on survey-based estimation of prevalence among high school students, since they are the most vulnerable group. A study from the capital city, Riyadh [23] reported that 28.6% of the students are current smokers. The most recent report by the MOH of Saudi Arabia showed that 21.2% of the males and 9.1% of the females are current smokers. To-date no Saudi population-based investigation has been conducted to link smoking with liver cancer. This information was obtained from ref. [24]. Note that many studies combine alcohol consumption with smoking as one risk factor. But due to the Islamic culture, alcohol consumption is forbidden by law in Saudi Arabia, and hence it is not a risk factor.
Diabetes
Population based studies and several systematic reviews and meta-analyses found association between HCC and diabetes mellitus [25-27]. The incidence of HCC was significantly higher among diabetic patients when compared with non-diabetic patients [28]. HCC risk may increase with duration of diabetes, a cohort study (mainly including men) showed that HCC risk in diabetics appears to be independent of other liver cancer risk factors, and diabetes is associated with further increased HCC risk in people with chronic liver disease, HBV infection, or cirrhosis [29].
The figures in (d) an (e) of Table 1 are the 8 years average incidence as reported in ref. [30]. The data presented in Table 1 do not support the claim of monotonic trend in the relationship between HCC prevalence and the suspected risk factors. For example, Saudi Arabia has the highest percentage of male smokers, with highest diabetes prevalence, yet it is classified as a country with moderate disease prevalence. On the other hand, New Zealand has the highest prevalence among female smokers and the lowest disease prevalence. The problem is that there may be either a synergetic or an antagonistic effect for the three risk factors. While it might be clinically possible to explain the effect of each risk factor one-at-a-time, their joint effect on the disease prevalence will be understood only if a population based, large scale epidemiological investigation is carried out. The problem is that disease-exposure association to the antecedent risk factors needs a long period of exposure that might extend be over two decades.
| Region | Prevalence (a) | Smoking (b) | (c) | (d) | (e) | ||
|---|---|---|---|---|---|---|---|
| Male | Female | Male | Female | Diabetes | HCV | HBV | |
| China | 39.9 | 14.2 | 7.1 | 4.1 | 9.32% | 7.2% | 2.2% |
| Saudi Arabia* | 14.9 | 5.8 | 21.2 | 9.1 | 23% | 0.08% | 0.11% |
| New Zealand | 3.9 | 1.3 | 18.7 | 21.5 | 12.4% | 0.1% | 0.3% |
Table 1: HCC risk factors in China (high prevalence), Saudi Arabia (moderate prevalence), and New Zealand (low prevalence).
Sources: Prevalence is given to 100,000 population count [31], (https://www.idf.org/diabetesatlas) [32], (c) [33], and (d) [34].
Non-alcoholic fatty liver disease (NAFLD) and its association with HCC
Several authors advised that the apparent association between HCC and diabetes should be interpreted with caution, and effects of other confounding factors should be taken into account. The most serious of these factors are the NAFLD and NASH.
The term NAFLD is used to describe a condition of fat accumulation in the liver in the absence of alcohol consumption. It is the most common etiology of chronic liver disease in the USA and many other countries. NAFLD is directly associated with many of the components of what is known as “Metabolic Syndrome”, and in particular obesity, diabetes. Recent studies have highlighted that NAFLD as a chronic condition that associated with liver injury including non-alcoholic steato-hepatitis (NASH) [35]. NASH is a severe form of NAFLD and shown to be associated with obesity, insulin resistance, and mitochondrial dysfunction [36]. The prevalence of NAFLD is increasing worldwide. It is estimated that the prevalence of NAFLD in the adult US population is 30-40%, while studies from other parts of the world report a prevalence ranging from 6% to 35%. In Saudi Arabia, the prevalence of NAFLD as evaluated by computed tomography is about 10% [37]. Moreover, it has been estimated that 15-20% of patients with NAFLD have NASH. We estimate the percentage of NASH to be 5% of the NAFLD based on figures provided in reference [38]. Since obesity is one of the components of the metabolic syndrome, several studies confirmed its association with NAFLD. The prevalence of simple steatosis in obese individuals ranges from 30% to 37%, and NAFLD existed in almost 57% of overweight individuals attending out-patient clinics [39,40]. It is noteworthy that obesity is additive to other factors predisposing liver steatosis [41]. A recent study showed that the relative risk (RR) pf obesity-related liver cancer ranged from 1.5 to 4 [42]. Several studies report a high prevalence of NAFLD and NASH in severely and morbidly obese individuals [43,44]. A recent study [45] estimated the prevalence of obesity in Saudi Arabia to be 28.7%.
Age and gender distribution
The total population of Saudi Arabia is almost 27,500,000, distributed according to age and gender as follows: 0-14 years age: 28.2% (male 3,890,771/female 3,703,725), 15-24 years age: 19.6% (male 2,823,458/female 2,450,629), 25-54 years: 44.8% (male 6,927,445/female 5,148,565), 55-64 years: 4.3% (male 639,051/female 524,058), 65 years and over: 3.1% (male 429,951/female 401,930) (2013 est.). This means that nearly 48% are under the age of 25 years. It will be shown that the incidence of the disease is strongly associated with age, particularly for the age interval above 35 years, and that the incidence among males is significantly higher than females in that age group (Figure 1).

Figure 1: Age distribution of the Saudi population by gender [46].
The prevalence of NAFLD and NAFLD-related fibrosis increases with age [47]. But it is important to note that the older patients had significantly more NAFLD risk factors, such as hypertension, obesity, diabetes, and hyperlipidemia. Another study assessed the prevalence of NAFLD in a cohort of octogenarians admitted to the rehabilitation departments of a geriatric hospital. This study reported a prevalence rate of 46%, which is greater than that of the general population.
In summary, the relationship between age, NAFLD, and fibrosis remains unsettled. We also note that the association between age and the high prevalence of NAFLD, as well as the higher stage of fibrosis and cirrhosis in NAFLD, may be related to the duration of disease rather than to age itself [47].
Relationship between the HCC incidence and age
The HCC incidence in both males and females is quite low among the young and rises rapidly into old age but at a slower rate (Figures 2 and 3). As an attempt to explain this relationship we fitted a simple statistical model relating the logarithm of age standardized incidence rate to age >35 years to the logarithm of midpoint age [48].

Figure 2: Log of incidence versus log of midpoint of age for male HCC cases. It can be seen that the disease is almost absent for young and the increase in incidence occurs after age 45.

Figure 3: Log of incidence versus log of midpoint of age for female HCC cases.
It can be seen from Figures 2 and 3, that the rates are divided with respect to age into two components (for both sexes) that separated at about age 35 years. The incidence before age 35 is almost non-existent. This finding is in agreement with the fact that the risk factors NAFLD and NASH are prevalent among the middle age people. We shall restrict the following analyses to the age groups>45 years.
Model fitting
The fitted models are:
 .
.
The fitted models are:
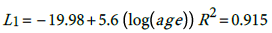 (1)
(1)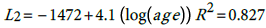 (2) The general relationship is thus:
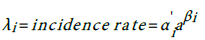 (3)
(3)
According, the postulated relationship between incidence and age is as given in (3) with where α i ' ≡ exp α i , This relationship is quite important since one can predict the burden of the disease for any particular age group based on the models (1) for males and (2) for females. The question is how good is this proposed model?
Models goodness of fit
We establish models goodness of fit by evaluating the level of agreement between the observed incidence (o) and the model-based predicted incidence (e). Graphically, we use Bland and Altman’s limits of agreement [49]. That is plotting the difference against their average (O+E)/2. We then use Lin’s [50] concordance correlation coefficient (CCC), to quantify the level of agreement between the observed incidence rates and the model based predicted incidence rates. The CCC is given by: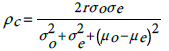
(4)Here, σ o is the observed incidence standard deviation, μ o is its mean value, and similarly  are respectively the standard deviation and the mean of the predicted incidence. From the analysis results
  and
and  . This shows that there is high agreement between the observed and the predicted incidence. Figures 4 and 5 show the limits of agreement as described in ref. [49].One important application of registry data is generation of relevant hypotheses. An important hypothesis of interest is verifying whether the data support the claim that HCC incidence rates for men exceed those for women at ages>35. This hypothesis can be formally stated in terms of ratio of incidence rates. To be specific we need to test the hypothesis that for a specific age
 versus the one sided alternative
 We can verify this hypothesis using the test statistic
  . The statistic D has variance
  , where
is the variance-covariance matrix of the estimates from model i and di is the vector of partial derivatives of D with respect to the components of The proposed test statistic is T=D/(var (D)1/2. The null hypothesis Ho is rejected for values of T exceeding the (1-α) 100% cut-off point of the standard normal distribution. For the midpoint of ages (40, 45, 50, 55, 60, 65, 70, and 75) we evaluated the p-values of the test statistic, and plotted them against the ages. The type I error rate is adjusted for multiplicity.

Figure 4: Goodness of fit of model (1) associating the incidence rate to age in males. The upper horizontal line represents the mean difference between observed and expected incidence plus standard deviation of difference. The middle line is the mean difference, and the lower horizontal line represents the mean difference minus the standard deviation. Goodness of fit is quite high when the majority of the differences fall between the upper and lower lines.

Figure 5: Goodness of fit of model (2) associating the incidence rate to age in females. The upper horizontal line represents the mean difference between observed and expected incidence plus standard deviation of difference. The middle line is the mean difference, and the lower horizontal line represents the mean difference minus the standard deviation. Goodness of fit is quite high when the majority of the differences fall between the upper and lower lines.
Figure 6 shows the plot of the p-values of the test against the specific age group. The reference line is the Bonferroni adjusted Type I error rate=0.0063. As can be seen, beyond age 40, the incidence rate is significantly higher for mean than the corresponding incidence rate for women.

Figure 6: P-values of the statistic T for testing the departure of the incidence ratio from unity. The horizontal lines represents the pvalue adjusted for multiplicity using Bonferroni’s correction (pvalue=0.005). The plot shows that beyond age 45 the incidence of HCC in males is significantly higher than that of females for all ages.
Predicting the HCC Incidence Counts Using Probability Models
In this section we shall construct regression models for count (number of cases) to predict the future burden of the disease, covering a span of 10 years. Figure 7 shows the increasing trend in the number of liver cancer cases over the years for both sexes. Again, we shall restrict our analysis to ages above 35 years. For predictions, we shall employ two commonly used regression models for count data. The first is the Poisson distribution which is characterized by the equality of its mean and variance. The other model is the negative binomial distribution and is often used to model count data with over dispersion; that is when the variance is larger than the mean. In Figure 7 we show the number of liver cancer cases for males and females over the period 1997-2010.

Figure 7: Number of Liver cancer cases over the years summed over all ages. The graph shows that the incidence of HCC among males is substantially higher that tha of the females across the study period.
The index of dispersion of HCC count (variance/mean) is 137 for males and 48 for females. We now describe how the models will be fitted to the data.
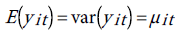
Since we have a time series data, we use the fixed-effects Poisson regression model for longitudinal data as described in details by Cameron et al. [44]. Let the dependent variable yit denote the TB count at time t for age . It is assumed that yit have a Poisson distribution with parameter µit which, in turn, depends on a vector of exogenous variables according to the log-linear link function [51]:
One way to estimate the parameter of this model is to do conventional Poisson regression by maximum likelihood. For the fixed-effects Poisson regression model we have the restriction that the mean of each count must equal its variance:
The probability distribution of yit is given by:
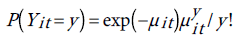 (5)
(5)
In many data sets, however there may be additional heterogeneity not accounted for by the Poisson model. This heterogeneity is evidenced by the large value of the index of dispersion. Substantial departures from the variance-mean ratio could indicate a problem with the model specification, and also suggest that the estimated standard errors of the Poisson regression model, when fitted to this data may be downwardly biased.
To deal with the problem of over-dispersion is to alternatively assume that yit has a negative binomial distribution (NBD), which can be regarded as a generalization of the Poisson distribution with an additional parameter (dispersion parameter) allowing the variance to exceed the mean [51]. The probability distribution of NBD is given by:
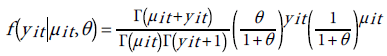 (16)
(16)
The parameter is assumed to be constant over time for each age µit depends on covariates through the transformation:
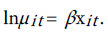
The mean and variance of yit are given by:
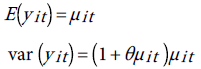
Therefore, when θ=0, the NB distribution reduces to the Poisson distribution. For the time series data graphed in Figure 7, we have two fixed effects, the year, and the age, and perhaps gender. Therefore the parameters vector β has three components. We shall use the scaled deviance as goodness of fit measure and to compare between the models [52]. If the scaled deviance is much larger than one (over dispersion), or much smaller than one (under dispersion), then the model is misspecified. The closer the scaled deviance to 1, the better the fit is. Clearly both models do not provide satisfactory fit to the data. As a matter of fact, the scale parameter θ of the NB was not properly estimated. However, as suggested in ref. [52] we can tackle the over dispersion situation by multiplying the standard errors of the estimated regression parameters obtained from the fitted the Poisson distribution to the data, by the square-root of the scaled deviance and adjust the p-values upwardly. Note that in Table 2 we inflated the standard errors after multiplication by square-root of the scaled deviance=3.84, and there was no change in the corresponding p-values. The results in Table 3 justify the use of the Poisson model instead of the negative binomial even in the presence of over dispersion.
| (1)Year | (2)Year Code | (3)HCC (x) | (4)Liver Transplants (y) |
|---|---|---|---|
| 1997 | 1 | 3534 | 26 |
| 1998 | 2 | 3902 | 21 |
| 1999 | 3 | 3563 | 25 |
| 2000 | 4 | 3337 | 26 |
| 2001 | 5 | 3779 | 30 |
| 2002 | 6 | 3416 | 29 |
| 2003 | 7 | 3822 | 34 |
| 2004 | 8 | 3938 | 70 |
| 2005 | 9 | 4282 | 60 |
| 2006 | 10 | 4248 | 86 |
| 2007 | 11 | 4743 | 93 |
| 2008 | 12 | 4416 | 97 |
| 2009 | 13 | 4993 | 108 |
| 2010 | 14 | 4823 | 102 |
| 2011 | 15 | 4918 | 164 |
| 2012 | 16 | 5032 | 146 |
Table 2: The liver cancer incidence counts Liver Transplants over the period 1997-2012. Data obtained from the SCR and STR. HCC for 2011 and 2012 are obtained from unpublished reports.
| Parameter | PoissonAdjusted SE | NB |
|---|---|---|
| Intercept | 2.081 ±0.02960.114 | 1.723 ±0.410 |
| (0.00001) | (.00001) | |
| Gender | -0.13 ±0.00870.033 | 0.067 ±0.1364 |
| (0.00001) | (0.622) | |
| Year Code | 0.032 ±0.00110.004 | 0.026 ±0.0164 |
| (0.00001) | (0.12) | |
| Age | 0.051 ±0.00040.002 | 0.056 ±0.0006 |
| (0.00001) | (0.00001) | |
| Scaled Deviance | 14.751 | 0.072 |
Table 3: Models Comparison. Over dispersion for Poisson and under dispersion for NBD
We now use the Poisson model as a predicting tool of the future burden of HCC, and estimating the total cost of liver transplant for the next 10 years. We do this in several steps:
Step 1: “Trend detection”. We establish a linear relationship between HCC, Total Liver Transplant (TLT), and the time period over which the counts were recorded. The data are shown in Table 2. The TLT data are obtained from the registry of the Saudi Organ Transplant Center (https://www.SCOT.org.sa).
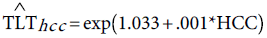
To estimate the trend, we fit Poisson model to the HCC, and (Total Liver Transplants) TLT data, with year-code as the only covariate. To improve on the model fits, the estimated standard errors of the regression coefficient are inflated by the factor =3.8 ,to account for over dispersion. The trend equation for HCC is:
  Similarly, the fitted Poisson model to the TLT data and the standard errors of the Poisson regression model are inflated by the factor
  , and the trend equation is:
The bracketed numbers are respectively the adjusted standard errors of the intercept and the slope estimates.
Step 2: “Prediction”. This step is quite simple. All we have to do is substitute the year code (17, 18,…., 30) in equations (5) and (6) to respectively get the predicted counts in the years (2013, 2014,…..2026). The predicted counts are given in Table 4 (columns 5, and 6).
| 1- Year |
2-Population size projections | 3-NAFLD: 10% of population | 4- NASH: 5% of NAFLD |
5- HCC projections |
6- TLT projections |
7- Predicted TLT from NASH |
8- Predicted TLT from HCC |
|---|---|---|---|---|---|---|---|
| 2013 | 20271058 | 2027106 | 101355 | 5198 | 188 | 199 | 202 |
| 2014 | 20706886 | 2070689 | 103534 | 5340 | 217 | 225 | 227 |
| 2015 | 21152084 | 2115208 | 105760 | 5486 | 250 | 254 | 256 |
| 2016 | 21606854 | 2160685 | 108034 | 5636 | 288 | 289 | 290 |
| 2017 | 22071401 | 2207140 | 110357 | 5791 | 333 | 329 | 329 |
| 2018 | 22545936 | 2254594 | 112730 | 5949 | 384 | 376 | 375 |
| 2019 | 23030674 | 2303067 | 115153 | 6112 | 443 | 430 | 428 |
| 2020 | 23525833 | 2352583 | 117629 | 6279 | 511 | 494 | 491 |
| 2021 | 24031639 | 2403164 | 120158 | 6451 | 589 | 570 | 566 |
| 2022 | 24548319 | 2454832 | 122742 | 6628 | 680 | 658 | 655 |
| 2023 | 25076108 | 2507611 | 125381 | 6809 | 684 | 763 | 760 |
| 2024 | 25615244 | 2561524 | 128076 | 6995 | 905 | 887 | 886 |
| 2025 | 26165972 | 2616597 | 130830 | 7187 | 1044 | 1035 | 1037 |
| 2026 | 26728540 | 2672854 | 133643 | 7383 | 1205 | 1211 | 1219 |
Table 4: Predictions of NAFLD, NASH, and the Saudi population.
Before implementing the next step, denote TLT counts predicted from NASH by  and TLT counts predicted from HCC by
  hcc.
hcc.
Step 3: “Correlating TLT to HCC”. We used the Poisson regression model to predict the number of liver transplants from the number of liver cancer cases. Over the period 1997-2011, the Pearson’s correlation between TLT and HCC is 0.916, indicating that the two variables are highly correlated. The fitted Poisson model is given by:
 (9)
(9)
The deviance of this model=1.123. The close value of the deviance to unity indicates that the future predictions of HCC can be used to predict the future needs for the liver transplant over the period 2013-2026. Column 8 of Table 4 is obtained upon substitution of the HCC values from column 5 in equation (9).
As an external validation for the future predictions of TLT, we will attempt to construct a model relating the TLT to the predicted NASH. To do that several assumptions should be made. The first assumption is that the Saudi population grows at an annual rate of 2.15%, a rate reported by the Central Department of Statistics and Information [53]. We assume this growth rate to be constant over the time period 2013-2026. The projected population size is given in column 2 of Table 4. We assumed that the information about the prevalence of NAFLD [37] and NASH [38] regarding the Saudi population to be constant over the same period 2013-2026. The figures are given respectively in columns 3 and 4 of Table 4. We used the values in column 4 and column 6 to fit a Poisson regression model. This leads to the prediction equation:
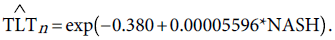 (10)
(10)
The deviance a measure of goodness of fit of the predictive Poisson model given in (10) is 1.032.
The predicted TLT values given in column 7 are obtained upon substitution of column 4 in the right hand side of equation (10), giving the predicted TLT values in column 7.
Now we have three sets of TLT predictions in columns 6, 7 and column 8. We examine the extent of agreement among the three sets of predictions using the intra-class correlation coefficient ρ as calculated from the one-way ANOVA [54]. We found that ρ=.997. This indicates that the TLT predicted counts whether obtained from equation (9) or equation (10) are highly correlated with each other and with the projected values given in column 6. This high agreement among the TLT predicted numbers, ensuring the robustness of the prediction models given by (9) and (10).
Discussion
The etiology of HCC is extremely complex, with many confounding factors affecting the disease outcome. HBC and HCV infections increase the risk and development of cirrhosis and subsequently HCC. The development of cirrhosis and progression to HCC is complex and may involve a combination of causally interrelated factors [55]. Attempting to establish causality between HCC and the interactive effect of a host of risk factors (diabetes, obesity, HBV, HCV, age, and gender) from the Saudi cancer registry data is an impossible task. To establish causality or at least a strong association an integrated system of surveillance should be in place.
Prevention of HCC and Surveillance recommendations in adults with chronic liver disease has been established. Surveillance consists of evaluation with liver ultrasound examination, and monitoring liver enzymes every 6 months in high risk patients. Several studies have examined the effects of surveillance for hepatocellular carcinoma (HCC) in patients with liver disease [56-60]. Whereas the role of surveillance is uncertain in patients with alcoholic liver cirrhosis, studies have shown the cost-effectiveness of surveillance in patients with high risk factors. As a general rule, surveillance appears to be cost-effective in patients with cirrhosis who have an expected annual incidence of HCC exceeding 1.5 percent per year. The incidence of HCC in various forms of cirrhotic liver disease ranges from 3 to 8 percent, making surveillance cost-effective for many patients with cirrhosis. For patients with hepatitis B, surveillance appears to be cost-effective, once the incidence of HCC exceeds 0.2 percent per year [61-63].
In our study no attempt was made to link HCC with its risk factors, since we have no record or registry of the incidence of HBV and HCV infection, nor the other risk factors. In Saudi Arabia, there is no surveillance program for patients with chronic liver disease, and the expatriates represent around 30% of the population. In an attempt to reduce the prevalence of infection and its potential sequelae including HCC, the health authorities established strict regulations for HBV and HCV screening for all expatriates applying for working visas. The regulations prohibit issuing work license or visas for infected persons or those with carrier status. The authorities also developed a national immunization programme for HBV. These undertaken measures were an important component of successful control of HBV and HCV infection. Also, there has been increased awareness of the HBV and HCV infection in the country, and increasingly effective prevention and treatment are becoming available to treat the infection and reduce the complications. The authorities have also launched awareness campaigns for healthy life style to reduce obesity and diabetes among the Saudi population.
In Saudi Arabia, there is no surveillance program for patients with chronic liver disease. In an attempt to reduce the prevalence of infection and its potential consequences authorities, developed a national immunization program for HBV. These undertaken measures were an important component of successful control of HBV and HCV infection. Also, there has been increased awareness of the HBV and HCV infection in the country, and increasingly effective prevention and treatment are becoming available to treat the infection and reduce the complications.
Recently, it has become evident that there is a significant association between obesity, and NAFLD, leading to NASH and possible liver transplant. Experts [64,65] argue that the sooner the body weight is reduced the healthier the liver will become. In summary, the growing body of research on NAFLD and NASH seems to suggest that obesity, diabetes, or may be all the components of metabolic syndrome may explain the increasing prevalence of NAFLD. Recent studies [63] showed that lifestyle interventions have substantial health benefits. The trend in BMI is on the rise in Saudi Arabia [39]. The interesting summary in [55] and the references therein it is recognized that the etiology of HCC is extremely complex, with multiple many confounding factors affecting disease course and patient prognosis. For example, most patients with HCC have cirrhosis, which develops following long periods of chronic liver disease. Moreover both HBV and HCV infection increase the likelihood of developing liver cancer, with an incidence of 54.4% and 31.1% of liver cancer cases globally, respectively [55]. Patients with NAFLD/NASH, also appears to further drive the hepato-carcinogenic process [55]. It is not clear how exactly role of each of these pathways and this is due in part to the lack of available data. Further research efforts are therefore needed to fully elucidate the diverse mechanisms involved in the pathogenesis of HCC.
Therefore fiscal prudence by policymakers, makes intervention to reduce obesity and hence the risk of developing NAFLD, a desirable strategy.
The fundamental aim of this paper is to establish a reliable statistical model through which projections for future HCC counts and the needed number of liver transplants are provided. We have used the well-known Poisson regression model, and estimated its predictive accuracy to achieve these objectives. Once this is done, an estimate of the total cost of transplants would be readily obtained.
The decision-making process in many aspects of the healthcare delivery system is often complicated and detailed, requiring many considerations before arriving at a course of action in patient care. Various modeling tools have been devised to assist with the decision-making process. Some are aimed at predicting a clinical outcome, whereas others focus on the cost of care.
For example several studies used and applied predictive modeling in health care [66]. They used logistic regression model, which is a member of the generalized linear models family to prospectively predict the total annual health costs (medical plus pharmacy) of health plan participants using Pharmacy Health Dimensions (PHD).
There is no doubt that our decisions would be infallible if we had reliable data that provided an absolute clear outcome for decision-making [67,68]. The important question that needs to answered; is whether predictive modeling is useful in the short term? Could the predictive model lead us to making decisions that benefit us in the short-term? Is our future success found somewhere in the success of yesterday? Before we answer these questions we should agree that, if we have very little data, then we should opt for a simple prediction model like the generalized linear regression (Poisson regression) model that we used in this paper. It was important to evaluate a possible competitor namely the negative binomial regression model. This letter was not as good as the former.
Many factors must be considered in the development of predictive models to ensure their validity. The model should be user-friendly, robust and flexible enough to handle the dynamic nature of the factors affecting the prediction of the outcome of interest.
With costs today heavily influencing benefit decisions of employers and other payers, the ability to predict outcomes becomes all the more important.
Predictive modeling has become a popular way to assess and manage costs associated with healthcare. The core “competency” of predictive modeling is its proactive nature; that is, not taking a reactive approach to disease management and cost containment but instead identifying trends and forecasting events that may have substantial implications for healthcare.
When using prediction modeling to Saudi population data, key principles should be considered. Firstly the dynamic nature of this emerging economy, secondly need for large disease data base and an integrated surveillance system, and finally a supportive decision making system. The decision-making process in many aspects of the healthcare delivery system is often complicated and detailed, requiring many considerations before arriving at a course of action in patient care. Various modeling tools have been devised to assist with the decision-making process. Some are aimed at predicting a clinical outcome, whereas others focus on the cost of care. As this research area progresses, it is important to not just show the academic value of these models for predictive accuracy but also to provide evidence of benefit to the many healthcare stakeholders.
In the USA the cost of a transplant, including preliminary testing, the surgery itself and post-operative recovery costs vary across the country and depend on the hospital and organ type. These costs start to add up, even prior to the transplant. In fact, patients commonly rely on several sources to help pay for their medical and non-medical costs of pre- and post-transplantation. It was reported in 2010 that the average cost of liver transplant in the USA can be as high as $577,100. The cost covers $25,400 for 30 days pre-transplant, $71,000 procurement, $316,000 hospital transplant admission, $46,600 physician during transplant, $93,900 180 days post-transplant admission, $23,300 for immuo-suppressants. The cost break down is the estimated US average 2011 charges per transplant [69].
In the Kingdom of Saudi Arabia, it was communicated to us from surgeons and transplant experts, that the over-all cost of liver transplant does not exceed $200,000 per transplant. For Saudi citizens, the government takes in charge the total cost of the transplant, including traveling to the transplant center, for patients and their relatives, and accommodation expenses
Knowing that not all HCC cases undergo liver transplant, the predicted number of liver transplant in the year (say) 2020 is about 511. Therefore, one would expect that 200,000 x 511 x 3.75=383,250,000 SR to be spent on liver transplants in that year.
To gauge the cost-effective of liver transplants, studies have shown that, about 70 percent of patients who undergo liver transplant live for at least five years, which goes up to 78 percent using organs from living donors, with less than 20 percent recurrence [70-72]. Given the high five year survival rate, it is clear then that liver transplant is cost effective and should be the treatment of choice for end of stage liver disease patients.
Concluding, we believe that the projected information in the current paper might play an important role in guiding health care officials and policy makers, for future decision making in liver disease patient management, financial budgeting and liver transplant policies.
The models we established in this study fall within the class of the so-called population-averaged models. Because of unavailability of individual-specific data, it is recommended that inference using our predictions be restricted to the average population, and not extended to the individual patient level. This might be one of the limitations of our modeling strategy. Cost predictions that utilize individual levels information such as those in [66,68], combined with population levels information are more reliable. This emphasizes the need for a more comprehensive subject-specific system of surveillance. As a final remark, a fast changing population such as the Saudi may utilize the predictions produced by our proposed models as base line information for short to medium range planning.
Acknowledgement
The authors acknowledge constructive comments made by two anonymous reviewers.
Citation: Shoukri MM, Elsiesy HA, Khafaga Y, Bazarbashi S, Al-Sebayel M, et al. (2015) Predictive Models for Incidence and Economic Burden of Liver Cancer in Saudi Arabia. Epidemiology (sunnyvale) 5:193. DOI: 10.4172/2161-1165.1000193
Copyright: © 2015 Shoukri M, et al. This is an open-access article distributed under the terms of the Creative Commons Attribution License, which permits unrestricted use, distribution and reproduction in any medium, provided the original author and source are credited.
Select your language of interest to view the total content in your interested language
Share This Article
Recommended Journals
Open Access Journals
Article Tools
Article Usage
- Total views: 16113
- [From(publication date): 7-2015 - Aug 29, 2025]
- Breakdown by view type
- HTML page views: 11400
- PDF downloads: 4713