Reconstructed Precipitation for the Eastern Tian Shan (China), based on Picea Shrenkiana Tree-Ring Width
Received: 12-Oct-2017 / Accepted Date: 12-Dec-2017 / Published Date: 16-Dec-2017 DOI: 10.4172/2157-7617.1000432
Abstract
Our recent study introduces the reconstruction of May-June precipitation based on Picea Shrenkiana tree-ring growth, spanned AD 1892-2015. We used three monthly climatic gridded data parameters of China which covers with a 0.25° spatial resolution over 1952-2012 (temperature mean (°C), total precipitation (kg m-2s-1) and total snow-water equivalent (kg m-2)) interpolated to our sampling site for highlight correlations coefficients. Snow-water equivalent with ring-width gives us a significant positive correlation (approximately in p<0.05 level) in April-May period (0.411) and September (0.263). With precipitation, correlation is higher in May-June period (0.468) which leads us that limiting factor in this area is water, which is felt during the initial growth of the tree. Results of negative correlation in March-October period (-0.478) with mean temperature, suggest that increase of temperature leads to increase of evaporation and water transpiration. Our reconstruction indicated 6 dry decades (1920, 1930, 1970, 1980, 2000, 2010) and five wet decades (1910, 1940, 1950, 1960, 1990). Our reconstruction confirms to global change, which suggest decreasing precipitation from 1991 until now. To represent our reconstruction geographical meaning, we conducted spatial correlation between our May-June precipitation reconstruction, instrumental gridded interpolated May-June precipitation and gridded CRU TS 4.0 May-June precipitation, which significant in Xinjiang Tian Shan Mountains and goes through Mongolia, Kazakhstan, Kyrgyzstan and Tajikistan. In addition, we are running Multi-taper spectral analysis and after getting results try to connect our study to ENSO variability, with highfrequency cycles 6.1-year (99%), 5.1-4.8-year (90%), 2.7-2.9-years (90%).
Keywords: Tree-ring; Picea shrenkiana; Reconstruction; Tian Shan
Introduction
Dendroclimatology in Tian Shan Mountains has been studied on the characterization of the growth and development of trees, reconstructions of the past millennia for that or region [1-6]. There are numerous papers has shown that the growth of trees is controlled by a set of climate conditions, for example [7] reconstructed spring precipitation in Western Nepal Himalaya since AD 1840. [8] reconstructed from maximum tree-ring latewood density a 382-year August mean minimum temperature for southeastern Tibetan Plateau (China). Growing season relative humidity variations and possible impacts on Hulunbuir grassland observed these authors [9,10] for central Inner Mongolia (China) reconstructed PDSI based on treering-width. Stream flow reconstruction of the upper Fenhe River basin in the North China, since 1799 made by sun [11]. Regeneration and protection desert Riparian Populus euphratica Forest in Arid Areas is represented by our colleagues [12]. Multi-millennial reconstruction of a 1436-year soil moisture and vegetation water use history based on tree-ring width from Qilian junipers in northeastern Qaidam Basin (China) has been shown in this work [13]. Another reconstruction from Western Himalaya (India) of heat index derived from Pinus roxburghii tree-ring growth presented by Ram and Borgaonkar [14]. To give clearly description of climate of past could be use a several parameters of tree-ring, include width, density, cell, radioactive, stable isotope ratios and others [15].
The Picea schrenkiana or Schrenk spruce (Fisch. et Mey) is a unique tree species in Tian Shan Mountains, which is very convenient for dendroclimatological analysis and gives very good results, which has already been confirm by [16-21], since this we choose Picea Shrenkiana to further investigation and developing tree-ring chronologies in Tacheng Prefecture, Shawan County, Xinjiang Autonomous Region, China. This study explains some driest and wettest period during 1892-2015, and also important because it confirms with other proxy records of other regions of Tian Shan Mountains, spatial correlation and spectral analysis.
Materials and Methods
Characteristics of the study area
The Tian Shan Mountains one of the largest mountain ranges in the world located in Central Asia. The eastern portion of Tian Shan Mountains in western China's Xinjiang Region was listed as a World Heritage Site where also situated our sampling site. Xinjiang Tianshan presents exceptional physical geographic highlights and grandly delightful ranges including fabulous snow and cold mountains ice sheet topped pinnacles, undisturbed woods and knolls, clear streams and lakes and red bed gorge. These scenes stand out from the tremendous adjoining desert scenes, making a striking visual difference amongst hot and icy conditions, dry and wet, devastate and rich. The landforms and environments of the site have been safeguarded since the Pliocene age and present a remarkable case of progressing organic and biological transformative procedures [22].
The east gate of the Tacheng Prefecture is Shawan County area of 13.900 km2, located in the middle of the northern foot of the Tian Shan Mountains in Xinjiang. Shawan County is a continental temperate arid climate with an average temperature of 6.3°C to 6.9°C. The total number of suns is 2800 h to 2870 h, ≥10°C accumulated temperature 3400°C to 3600°C, frost-free period 170 to 190 days. Annual precipitation of 140 mm to 350 mm, annual evaporation of 1500 mm to 2000 mm. The sampling site was >>50 km from Shawan County Figure 1, but from the human living area (e.g. Kalaba Sitaocun and Akeje Yekecun) closer to about 10 km and may be subject to human interference is relatively large, because this piece of forest grazing. Climate conditions in this area are almost completely different for example; a mean temperature is 1.4°C and annual precipitation 645 mm (Figure 2).

Figure 1: Location map of the sampled site, Shawan meteorological station and the gridded dataset.
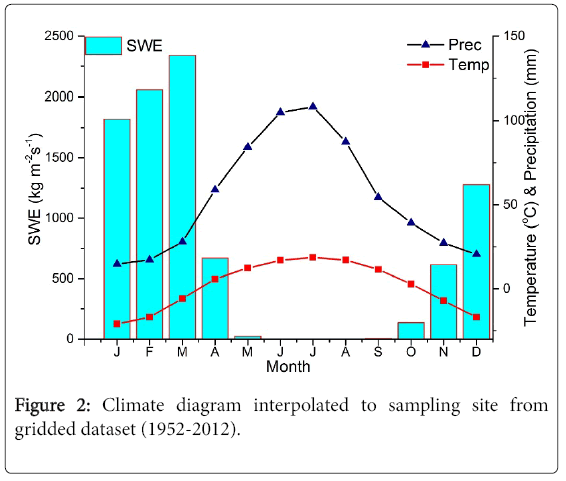
Figure 2: Climate diagram interpolated to sampling site from gridded dataset (1952-2012).
Picea schrenkiana is high trees growth up to 60 m tall, diameter of trunks can be reach up to 2 m has a dull-brown bark, which is densely flaky; its crown is cylindrical or narrowly pyramidal. Can be grown on N-facing slopes, cool ravines in the altitude 1200-3500m, could be find in Xinjiang, Kazakhstan and Kyrgyzstan. The timber is used for construction, aircraft, machines, poles, and wood pulp, and tannin is extracted from the bark. The species is also cultivated for afforestation and as an ornamental. In the towering depths of the Tian Shan Mountains, it is vigorous tall and straight, four seasons green, climbing, full of endless, like a green building along the mountains and built the Great Wall. The wind, snow, sound, waves are almost all kept by these majestic trees. Tian Shan Mountains Snow pines, is said to be more than 4000 years ago, migrated from the Qinghai-Tibet Plateau, evolved into the northwest unique and the most spectacular trees [23].
Collection samples and data from tree-ring width
In August 2015, from Shawan County from 4 points covered 43°56'-58'N, 85°20'-22'E, 1650-1800m a.s.l., of Tacheng Prefecture the samples from Snow Spruce (Picea schrenkiana), totally 64 from 32 trees was collected, since the distance between points was >>10 km we codded as SWC and merge into one place, (Figure 1). Shawan County collection sites, may be relatively large interference by human factors, because this piece of forest grazing. The diameter of Picea Shrenkiana tree ranged from 60 to 150 cm depending on site conditions. Generally sampling were at breast height (1.3 m) and 2-3 cores were extracted with advantageously borax age using 5 mm diameter increment borers, (Sweden) from various directions for further dendrochronological dating. To limit non-climatic impacts on tree growth, just trees with no damage and malady were inspected.
After arrived at the tree-ring laboratory, samples were clearly airdried, polished, mounted and cross-dated according to standard International Tree Ring Data Bank [24] procedures. To measure growth characteristics was applied a measurement system LINTAB VI (0.001 mm), and in order to identify outliers and false rings is very convenient program TSAP-Win Scientific 4.8 [25]. To assess a measurement accuracy and detect “outlier” ring we used COFECHA software [26]. To apply a robust estimation of the mean value function to remove effect of endogenous stand disturbances and produce residual chronology series we run ARSTAN program [27]. Reliable of estimation of the tree-ring chronology, were calculated such kind of parameters as inter-series correlation (RBAR), expressed population signal (EPS) and signal-to-noise ratio (SNR; [28]) over 50 years lagged by 25 years.
Statistical data
To measure the strength and direction of linear relationships, we are running the bivariate Pearson Correlation produces a sample correlation coefficient between the climatic data and the ring chronology, for this, we used the SPSS program. Meteorological data were monthly parameters such as temperature mean (°C), total precipitation (kgm-2s-1) and total snow-water equivalent (SWE) (kg m-2) data, were interpolated to our sampling site, by using MATLAB [29], from developing a consistent and comprehensive land surface dataset of China which covers with a 0.25° spatial resolution and a daily time step for 1952–2012 obtained from (Figure 1) [30]. We use such kind of data because our sampling site was far from nearest meteorological data and cannot provide good signals, so interpolated data gives more regional connections.
To analyses climate statistically data and find El Niño–Southern Oscillation (ENSO) tele-connections we run a spatial correlation in the KNMI Climate Explorer web application [31], between our reconstructed precipitation May-June and the grid-data precipitation CRU TS 4.0 [32] for the period 1952-2015 (over 30-60°N, 60-120°E). To analyze short, noisy time series and calculating spectral estimates and closely link with local and geographical representations, we used multi taper method (MTM) of spectral analysis [33] and produce it in 5×3π tapers and in a red noise background.
Results and Discussion
Ring chronology and climate response
Statistical cross-dating and residual chronology produced by COFECHA and ARSTAN has been shown in Table 1. Average Pearson’s correlation (within 99%) were high 0.689, the same as mean sensitivity (0.568), standard deviation (0.447) and variance of eigenvalue by 46%, which has significant reflect to the variation of climate [27]. Tree-ring width chronology spanned 1888-2015 AD (Figure 3) and show high EPS (0.927) and SNR (12.784), it is possible to characterize the close links with environmental information. Since our first-order autocorrelation (AC1) is negative (-0.113) which can implies that the following year have great effect on the growth by the conditions in prior year rings [34].
| Chronology | SWC |
|---|---|
| No of trees (tree/core) | 32/64 |
| Chronology period | 1888-2015 |
| Length (year) | 128 |
| AGR (cm) | 0.167 |
| R | 0.169 |
| MC | 0.689 |
| MS | 0.568 |
| SD | 0.447 |
| AC1 | -0.113 |
| SNR | 12.784 |
| VFE | 0.46 |
| EPS | 0.927 |
| Year (EPS>0.85, series>6) | 1940 |
| MSL | 71.8 |
| *AGR average growth rate; R is the all-series Rbar; MC mean correlation with master series; MS mean sensitivity; SD standard deviation; AC1 first autocorrelation; SNR signal-to-noise ratio; VFE Variance explained by the first principal component; EPS expressed population signal; MSL mean segment length; | |
Table 1: Statistical cross-dating for the residual chronology.
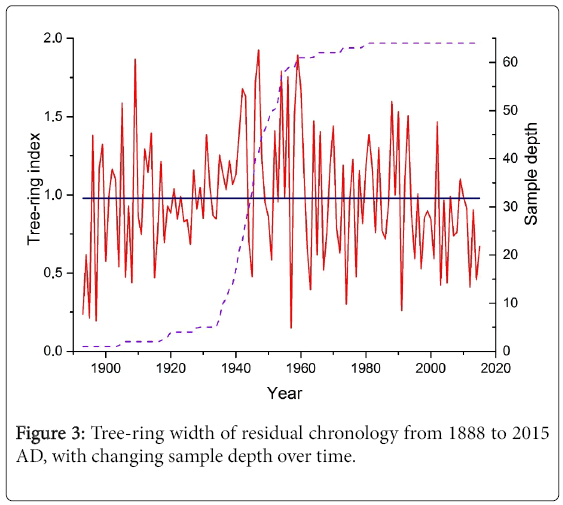
Figure 3: Tree-ring width of residual chronology from 1888 to 2015 AD, with changing sample depth over time.
Figure 4 depicts the simple correlation coefficients for the 1952-2012 period between residual chronology and gridded dataset. As it happens usually at such kind of regions and the same type of trees in this case with Picea Shrenkiana, the results of analysis related that growth of rings mainly response to summer precipitation May-June (0.468 at p<0.001). Negative correlation coefficient with mean temperature was significant with March (-0.307, at p<0.01), May-July (-0.454, at p<0.001) and October (-0.253, at p<0.05). In addition, we evaluated also positive correlations with SWE in April-May (0.411, at p<0.001) and September (0.263, at p<0.05).
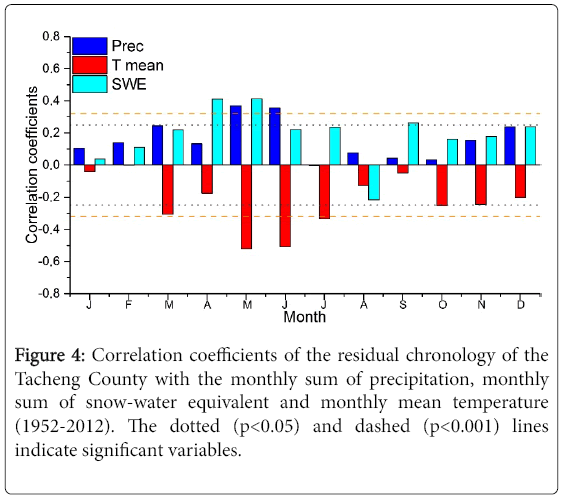
Figure 4: Correlation coefficients of the residual chronology of the Tacheng County with the monthly sum of precipitation, monthly sum of snow-water equivalent and monthly mean temperature (1952-2012). The dotted (p<0.05) and dashed (p<0.001) lines indicate significant variables.
Characteristics of summer precipitation reconstruction
Basing on the above climate responses, May-June precipitation was selected to reconstruct using the regression analysis [27]. A linear regression model for the 1952-2012 calibration period (Figure 5) was strong (F=16.51, p<0.05, r=0.468). We have presented reconstruction of May-June precipitation and 7-year simple smoother moving average for Tacheng Prefecture Shawan County (Figure 6).
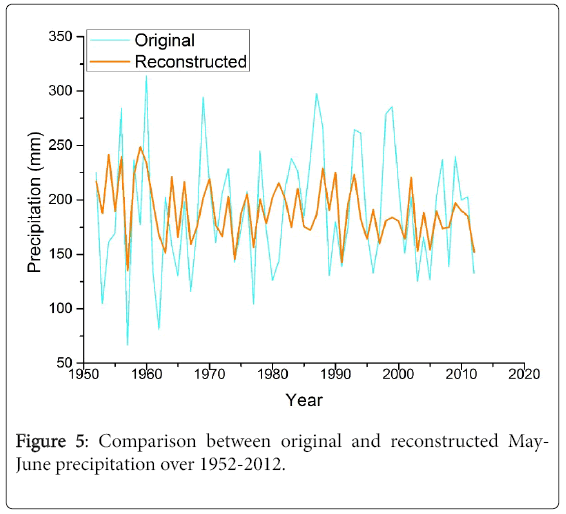
Figure 5: Comparison between original and reconstructed May-June precipitation over 1952-2012.
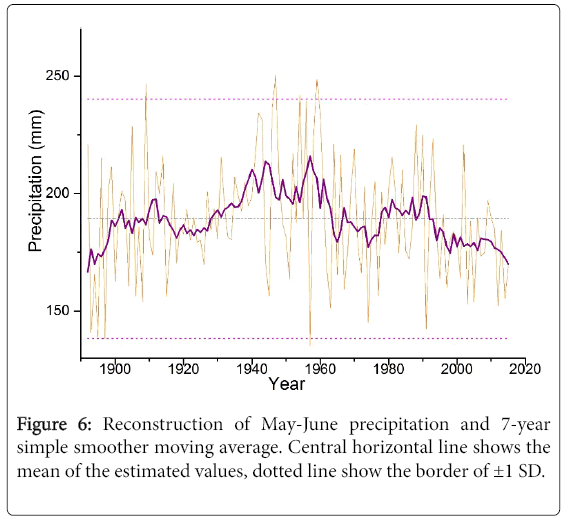
Figure 6: Reconstruction of May-June precipitation and 7-year simple smoother moving average. Central horizontal line shows the mean of the estimated values, dotted line show the border of ± 1 SD.
The model obtained was:
Y=64.849×X+125.695
where Y is total May-June precipitation and X is the residual chronology.
Statistical parameters (Table 2) such as the reduction of error (RE) and coefficient of efficiency (CE), the sign test (ST), the product mean test (PMT), regression Equation test (F) and the Pearson’s correlation coefficient was used for reliability of the reconstruction models [27,34].
| R | r2 | SD | RE/CE | PMT | ST | F | Durbin-Watson |
|---|---|---|---|---|---|---|---|
| 0.468 | 0.219 | 50.9 | 0.163/0.163 | 2.84 | 39+/21- | 16.51 | 1.682 |
Table 2: Results of regression model statistics.
The mean value of total May-June precipitation over the 1952-2012 period is around 189.3 mm and SD is 50.9. Based on Akkemik [35] the inner horizontal lines (±1 SD) indicate dry and wet years, dry periods with below average precipitation were found in AD 1892-1898, 1916-1927, 1964-1967, 1969-1977 and 1994-2015. These periods AD 1910-1913, 1929-1963, 1978-1991 are indicating most wet years. The 1947 (250.3 mm) and 1957 (135.1 mm) as the most extreme years. During the reconstruction, we found six dry decades (1920, 1930, 1970, 1980, 2000, and 2010) and five wet decades (1910, 1940, 1950, 1960, and 1990). Our reconstruction confirms to global change which suggest decreasing precipitation from 1991 until now. More detailed characteristics has been shown in Table 3.
| 5 Most extreme years | 5 Driest and wettest decades | Long-term means | |||||||
|---|---|---|---|---|---|---|---|---|---|
| Years | Driest (mm) | Years | Wettest (mm) | Years | Driest (mm) | Years | Wettest (mm) | Years | Values (mm) |
| 1957 | 135.1 | 1947 | 250.3 | 2000 | 180.3 | 1960 | 207.9 | 1950 | 192.9 |
| 1895 | 138.4 | 1959 | 248.4 | 2010 | 180.4 | 1950 | 207.1 | 2000 | 191.2 |
| 1897 | 138.4 | 1909 | 246.6 | 1980 | 182.1 | 1990 | 197.9 | 1892-1992 | 191.6 |
| 1893 | 140.8 | 1954 | 241.7 | 1930 | 185.1 | 1930 | 196.9 | 1892-2015 | 189.3 |
| 1991 | 142.3 | 1956 | 240.2 | 1920 | 187.3 | 1910 | 190.2 | ||
Table 3: Summary characteristics of unfiltered summer (May-June) precipitation reconstruction.
Tree-ring growth and climate trends
Positive correlation with April-May snow-water equivalent and May-June precipitation implied great influence to the growth rings of Picea Shrenkiana, and this may possibly be due only to hydrological control and water deficit at early stages of the growing season which leads to suppression of extensions of tracheids and division of cambium cells in trees [34]. Scarce water can lead to narrowing tracheids and the rings, which also affects the change in density, decrease the size of the lumen and increase the proportion of the cell wall in the annual ring [36]. Strong negative correlation with mean temperature from March-October, suggests a possible increase in temperature and an increase in evaporation in this region, so it confirm our hypothesis about water availability as the main factor limiting growth.
To find the connection between our reconstruction and the geographical representation (Figure 7). We used spatial correlation between instrumental data spanned 1952-2012 May-June precipitation and CRU TS 4.0, and May-June precipitation reconstruction spanned 1952-2015, suggest that reconstruction represents broad-scale regional climatic variations, which begins and embraces moving along the great mountain chain of the Tian Shan Mountains from Mongolia, Xinjiang, Kazakhstan, Kyrgyzstan and Tajikistan.
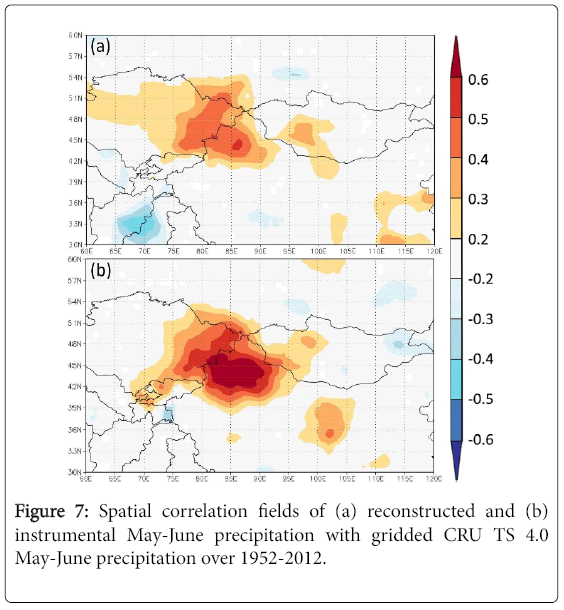
Figure 7: Spatial correlation fields of (a) reconstructed and (b) instrumental May-June precipitation with gridded CRU TS 4.0 May-June precipitation over 1952-2012.
As shown in Figure 8 significant high-frequency peaks from MTM spectral analysis were found 6.1-year (99%), 5.1-year (90%), 5-year (90%), 4.9-year (90%), 2.9-year (90%), which can link to variability of the ENSO [37]. In order to study in more detail, the influencing factors and how certain cyclones affect our research area, we need other meteorological parameters (sunshine, wind speed and direction, carbon composition, etc.), and we need other analyzes (radiocarbon determination of density and others).
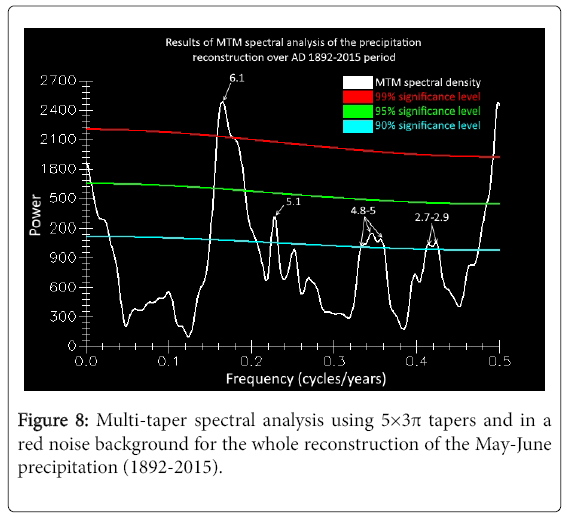
Figure 8: Multi-taper spectral analysis using 5×3π tapers and in a red noise background for the whole reconstruction of the May-June precipitation (1892-2015).
Conclusion
In this study, we have presented the summer May-June precipitation reconstruction from Snow Spruce (Picea Shrenkiana) chronologies. April-May snow-water equivalent and May-June precipitation shows significant positive correlation, suggest to water deficit at early stages of the growing season. Negative correlation was indicated from March- October mean temperature, which explains as increase in evaporation and water transpiration. Reconstruction was built over 1892-2015 period and explain driest and wettest periods over XIX – XXI century. In the course of the study, two extreme years with values 1947 (250.3 mm) and 1957 (135.1 mm) and also six dry decades (1920, 1930, 1970, 1980, 2000, 2010) and five wet decades (1910, 1940, 1950, 1960, 1990) were employed. From 1991 we observed decrease in precipitation which can be up to Global Climate Change Variability. Spatial correlation with gridded CRU TS 4.0 was significant suggest of possibility of our reconstruction. Strong linkages were found with Xinjiang Tian Shan Mountains and some parts of Mongolia, Kazakhstan, Kyrgyzstan and Tajikistan. MTM spectral analysis results connect our study area to ENSO variability with such high-frequency cycles 6.1-year (99%), 5.1-year (90%), 5-4.8-year (90%), 2.7-2.9-year (90%).
Acknowledgment
This study was supported by NSFC-UNEP, project (No. 41361140361) and Chinese Academy of Sciences (No. 134111KYSB20160010), High-level Talent Recruitment Program of Xinjiang Uygur Autonomous Region (Y642091) and CAS "Light of West China" Program (2015-XBQN-B-22). The kind help of Tao Hui, Zhang Yanjing, Shi Bingbing and Guo Yanfei during preliminary works was highly appreciated. We also thank Xue-Jun Zhang for his kindly replying for all our misunderstanding parts and for using his data [30]. Also, the author sincerely thanks to Chinese Academy of Science to get such kind of scholarship and chance to get knowledge in China. In addition, the author expresses deep gratitude to his family and all who at least somehow helped with the word or deed.
References
- Yujing Y, Jiangfeng L (1994) The response functions of tree-ring chronologies in the east end of Tianshan mountain. Arid Zone Research 1.
- Zhang Z, Wu X, Li J (1996) Utilizing tree ring chronologies to reconstruct 300-year drought days in eastern Tianshan mountains. Quarterly Journal of Applied Meteorology 7: 53-60.
- Esper J (2003) Temperature-sensitive Tien Shan tree ring chronologies show multi-centennial growth trends. Climate Dynamics 21: 699-706.
- Chen F (2015) A 225-year long drought reconstruction for east Xinjiang based on Siberia larch (Larixsibirica) tree-ring widths: Reveals the recent dry trend of the eastern end of Tien Shan. Quaternary International 358: 42-47.
- Yuan Y, Li J (1999) Reconstruction and analysis of 450 years winter temperature series in the Urumqi River source of Tianshan Mountains. Journal of Glaciology and Geocryology 21: 64-70.
- S Yu (2013) A 352-year record of summer temperature reconstruction in the western Tianshan Mountains, China, as deduced from tree-ring density. Quaternary Research 80: 158-166.
- Gaire NP (2017) Tree-ring based spring precipitation reconstruction in western Nepal Himalaya since AD 1840. Dendrochronologia 42: 21-30.
- Liang H, Lyu L, Wahab M (2016) A 382-year reconstruction of August mean minimum temperature from tree-ring maximum latewood density on the southeastern Tibetan Plateau, China. Dendrochronologia 37: 1-8.
- Sun B, Liu Y, Lei Y (2016) Growing season relative humidity variations and possible impacts on Hulunbuir grassland. Science Bulletin 61: 728-736.
- Liu Y (2016) Tree-ring-width-based PDSI reconstruction for central Inner Mongolia, China over the past 333 years. Climate Dynamics 1-13.
- Sun J (2013) Tree-ring based runoff reconstruction of the upper Fenhe River basin, North China, since 1799 AD. Quaternary International 283: 117-124.
- Ling H (2015) How to regenerate and protect desert riparian Populuseuphratica forest in arid areas. Scientific reports 5.
- Yin ZY (2008) Reconstruction of a 1436-year soil moisture and vegetation water use history based on tree-ring widths from Qilian junipers in northeastern Qaidam Basin, northwestern China. International Journal of Climatology 28: 37-53.
- Ram S, Borgaonkar H (2016) Reconstruction of heat index based on tree-ring width records of western Himalaya in India. Dendrochronologia 40: 64-71.
- Touchan R, Hughes MK (1999) Dendrochronology in Jordan. Journal of Arid Environments 42: 291-303.
- Zhang TW (2013) A tree-ring based temperature reconstruction for the Kaiduhe River watershed, northwestern China, since AD 1680: Linkages to the North Atlantic Oscillation. Quaternary International 311: 71-80.
- Zhang TW (2013) A tree-ring based precipitation reconstruction for the Baluntai region on the southern slope of the central Tien Shan Mountains, China, since AD 1464. Quaternary International 283: 55-62.
- Gou X (2005) Climatic response of thick leaf spruce (Piceacrassifolia) tree-ring width at different elevations over Qilian Mountains, northwestern China. Journal of Arid Environments 61: 513-524.
- Wang T, Ren H, Ma K (2005) Climatic signals in tree ring of Piceaschrenkiana along an altitudinal gradient in the central Tianshan Mountains, northwestern China. Trees. 19: 736-742.
- Chen F, Yuan Y, Wei W (2011) Climatic response of Piceacrassifolia tree-ring parameters and precipitation reconstruction in the western Qilian Mountains, China. Journal of Arid Environments 75: 1121-1128.
- Wu G (2013) Age-dependent tree-ring growth responses of Schrenk spruce (Piceaschrenkiana) to climate—a case study in the Tianshan Mountain, China. Dendrochronologia 31: 318-326.
- Blanchfield L, Browne MA (2013) The United Nations Educational, Scientific, and Cultural Organization (UNESCO). 2013: Congressional Research Service.
- Wu ZY, Al-Shehbaz IA (1999) Flora of China. 4. Cycadaceae through Fagaceae [Hauptbd.]. 1999: Science Press.
- Rinn F (2003) TSAP-Win: time series analysis and presentation for dendrochronology and related applications. Frank Rinn, Heidelberg, Germany.
- Holmes RL (1983) Computer-assisted quality control in tree-ring dating and measurement. Tree-Ring Bulletin 43: 69-78.
- Cook ER, Kairiukstis LA (1990) Methods of dendrochronology. 1990, Kluwer, Dordrecht.
- Wigley TM, Briffa KR, Jones PD (1984) On the average value of correlated time series, with applications in dendroclimatology and hydrometeorology. Journal of Climate and Applied Meteorology 23: 201-213.
- Palmer W (1965) Meteorological drought. Research Paper Number 45. US Department of Commerce. Weather Bureau, Washington, DC, USA.
- Zhang XJ (2014) A long-term land surface hydrologic fluxes and states dataset for China. Journal of Hydrometeorology 15: 2067-2084.
- KNMI: National knowledge institute for weather, climate and seismology.
- Mitchell TD, Jones PD (2005) An improved method of constructing a database of monthly climate observations and associated high-resolution grids. International Journal of Climatology 25: 693-712.
- Mann ME, Lees JM (1996) Robust estimation of background noise and signal detection in climatic time series. Climatic change 33: 409-445.
- Fritts H (1976) Tree rings and climate, Academic, London, New-York, San-Francisco, USA, 567.
- Akkemik Ü (2003) Tree rings of Cedruslibani at the northern boundary of its natural distribution. IAWA Journal 24: 63-73.
- Chen F (2012) Tree-ring-based reconstruction of precipitation in the Changling Mountains, China, since AD 1691. International Journal of Biometeorology 56: 765-774.
- Allan R, Lind esay J, Parker D (1996) El Niño southern oscillation and climatic variability. 1996: CSIRO publishing, USA.
Citation: Zulfiyor B, Ruide Y, Meilin Y, Akylai M, Javhar A (2017) Reconstructed Precipitation for the Eastern Tian Shan (China), based on Picea Shrenkiana Tree-Ring Width. J Earth Sci Clim Change 8: 432. DOI: 10.4172/2157-7617.1000432
Copyright: ©2017 Zulfiyor B, et al. This is an open-access article distributed under the terms of the Creative Commons Attribution License, which permits unrestricteduse, distribution, and reproduction in any medium, provided the original author and source are credited.
Select your language of interest to view the total content in your interested language
Share This Article
Recommended Journals
Open Access Journals
Article Tools
Article Usage
- Total views: 6338
- [From(publication date): 0-2017 - Nov 29, 2025]
- Breakdown by view type
- HTML page views: 5394
- PDF downloads: 944