Repeated Exposure to Ozone Produces Changes in Metabolic Disturbances Present in the TDP-43A315T Transgenic Model of Amyotrophic Lateral Sclerosis
Received: 19-Oct-2021 / Accepted Date: 02-Nov-2021 / Published Date: 09-Nov-2021
Abstract
Metabolic abnormalities play a key role in the pathogenesis of Amyotrophic Lateral Sclerosis (ALS). Different drugs have been used in the clinical practice; however, no current therapeutic disease-modifying intervention exists. The biological effect of ozone (O3) has gained much attention in neurodegenerative disorders, due to its strong capacity to induce controlled oxidative stress and inflammation. However, its effect on metabolism are very less studied, even though O3 is known for cause endocrine and metabolic changes, increasing food intake and body fat mass. Considering that body weight gain and mild obesity appears to improve survival in ALS patients, the aim of this study was to address the role of O3 on the metabolic disturbances present in ALS. To test this hypothesis,(4 hours/day). The effect of O3 exposure on ALS disease progression was addressed by monitoring body weight loss and motor performance until the disease end-stage in ALS mice. Furthermore, we investigated the action of O3 on plasma glucose content and biomarkers of metabolism by immunoassay. O3 exposure significantly improves motor performance and mitigates disease-associated weight loss in TDP-43A315T mice. As well, circulating levels of TDP-43TDP-43A315T mice and age-matched WT ittermates, were exposed to O3 (0.25 ppm) or filtered air (FA) for 15 days metabolic proteins and glucose in plasma were highest at disease end-stage after O exposure in TDP-43A315T mice. These findings provide the first insights into the mechanistic link between O3 exposure and the improvement of the metabolic disturbances present in ALS, based on experimental data.
Keywords: Metabolic disturbances; Pathogenesis; Biomarkers; Neurodegenerative disorders
Introduction
Amyotrophic Lateral Sclerosis (ALS) is a motor neuron disease characterized by the selective and progressive loss of upper and lower motor neurons of the cerebral cortex, brainstem and spinal cord [1]. The result of this loss is a rapidly progressive paralysis, which ultimately leads to death within three to five years of symptom onset. The majority of patients suffer from sporadic ALS (sALS; more than 90%), in which multiple risk factors from gene-environment interactions contribute to the disease pathogenesis. In contrast, only a small subset of patients suffers from familial ALS (fALS; less than 10%) due to their associated genetic dominant inheritance factor [2]. Although the cellular basis for neurodegeneration in ALS is not yet fully understood, numerous studies have shown that the underlying disease process involves multiple complex genetic and non-genetic factors, including metabolic alterations.
Ozone (O3), is a highly oxidative gas that is formed by the action of solar radiation from photochemical reactions of other pollutants (i.e. nitrogen oxides and volatile organic compounds) emitted by vehicles and manufacturing [3]. Extensive investigation about O3-related pathophysiological squeals clearly show that exposure to this pollutant causes and exacerbates respiratory and cardiovascular diseases [4-8]. O3 exposure could also increase the incidence of chronic metabolic disorders as obesity and diabetes type II [9,10]. More recently, a number of studies strongly suggest that certain neurological pathologies, Alzheimer’s disease and Parkinson’s disease might be associated with the O3 exposure or lead to a predisposition to these neurological alterations [11-15]. Some environmental and occupational risk factors, including air pollution, could be associated with the occurrence of ALS.
However, epidemiological evidence supporting this association is still limited. Further larger studies are needed to assess this relation in order to demonstrate associations between environmental factors, including exposure to O3, and negative health effects in ALS disease. Indeed, clear evidence on the possible link between air pollution and ALS, based on experimental data, is lacking. Although O3 has deleterious effects, many therapeutic effects have also been suggested. Paradoxically, being O3 a natural bioactive molecule which has been traditionally used as a powerful oxidant in medicine, O3 can trigger biochemical mechanisms involved in the reactivation of the antioxidant system [16]. Recently, the therapeutic potential of O3 has gained much attention through its strong capacity to induce controlled oxidative stress [17], through mechanism of action involving its interaction with the nuclear factor erythroid-derived 2–like 2 (Nrf2) a key regulator of inducible antioxidant responses [18,19]. A growing new body of clinical data indicates the effectiveness of O3 as a potential novel strategy to delay neurodegeneration, and also with potential effects on immune system and gut microbiota [20,21]. Clinical trials evidenced the effectiveness of O3 therapy in the treatment of degenerative disorders as Multiple Sclerosis (MS) [18,22,23]. However, no studies have been conducted, so far, to investigate the hypothesis exposure to O3 might mitigate metabolic disturbances present in ALS, even though O3 is known for cause endocrine and metabolic changes, and a growing body of evidence shows disturbances in energy metabolism in ALS disease [24-27].
To test this hypothesis, TDP-43A315T mice, a mice model of TDP-43 proteinopathy, and age-matched WT littermates, were exposed to O3 (0.25 ppm) or Filtered Air (FA) for 15 days (4 hours/day), providing the first insights into the mechanistic link between O3 exposure and the improvement of the metabolic disturbances present in ALS [28].
Materials and Methods
Animals
Transgenic (Tg) TDP43A315T mice (Strain No. 010700, Bar Harbor, ME, USA) and the genetic background–matched wild type (WT) Monitoring and behavioral assessments Page 2 of 7 littermate control mice were used in this study [28]. This mouse model of ALS expresses a mutant human TAR DNA binding protein TDP- 43 cDNA harboring an N-terminal flag tag and an TDP43A315T amino acid substitution associated with ALS mainly in the CNS [28]. To avoid ambiguity associated with reported sex-related differences in mean survival time of TDP-43A315T mice, only male mice were used [28, 29]. Animals expressing the hTDP-43 transgene were confirmed via PCR according to the distributor’s protocol. The ALS-like disease was divided into two stages: onset (defined as the last day of individual peak body weight before a gradual loss occurs) and the end-stage of disease (defined as when weight is 20% below the initial weight on three consecutive days), at which the mice were euthanized. The end- stage is typically reached 2–4 weeks after symptom onset. Animals were group-housed under standard housing conditions with a 12 h light–dark cycle, and food and water ad libitum. To monitor disease onset and progression, all mice were weighed and assessed three times per week until the disease onset-stage, after which they were checked daily in the morning until the disease end-stage. All experimental procedures were approved by the Animal Ethics Committee (AEC) of the National Hospital for Paraplegics (HNP) (Approval No 26/OH 2018) in accordance with the Spanish Guidelines for the Care and Use of Animals for Scientific Purposes. All analyses were conducted by personnel blinded to the animal genotype.
O3 exposure
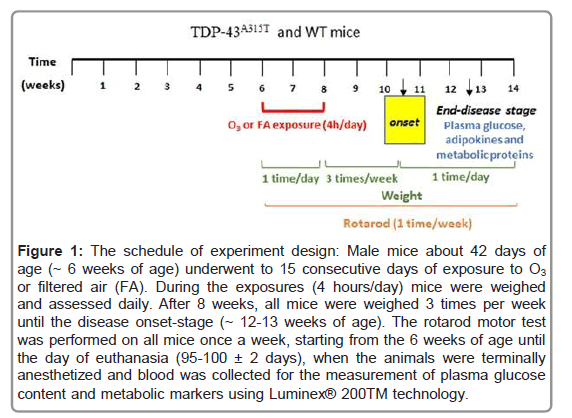
42 day old TDP-43A315T mice and WT littermate controls were divided in two groups, and exposed to O3 (9/group, n=3 TDP-43A315T mice vs. n=6 WT mice) or FA (9/group, n=3 TDP-43A315T mice vs. n=6 WT mice). In all cases, animals were exposed 15 consecutive days (4 hours/day) following the protocol described by Bel(Figure 1) [11]. O3 was generated from pure O2 with a BTM 802N generator and distributed in a Plexiglas chamber (50 × 35 × 35 cm) together with zero air at a total flow of 15 L min-1. The O3 concentration of the ambient air in the chamber was kept constant at 0.25 ppm and was continuously monitored by an Environment O3 42 M analyzer (Envea, France). FA was obtained by filtering regular air with activated charcoal to reduce O3 concentration to a minimum of (<0.02 ppm). During the exposures, animals had food and water ad libitum, and their general health was regularly checked.
rly checked.Monitoring and behavioral assessments
To monitor disease progression and onset determination, body weight lost was measured and motor performance was evaluated using rota rod test. All mice were weighed and assessed three times per week until the disease onset-stage. After that, mice were then checked daily in the morning until the disease end-stage.
The rota rod motor test was performed on all mice once a week, starting from the 6 weeks of age until the day of euthanasia [30] (Figure 1). Unlike SOD1 mouse models of ALS, the TDP-43A315T mice maintained locomotor functionality through to end-stage. Animals were previously trained for three consecutive days and three times a day to promote the learning of the task. The accelerated protocol was applied for this motor monitoring as described previously by Mandillo et al. [31]. In brief, mice were placed on a rota rod apparatus (Model 7650, Ugo Basile) at a speed of 4 rpm with acceleration up to 40 rpm over 300 s. Three tests were performed for each mouse with a minimal interval of 20 mins, and the average of the longest two performances was taken as the final result for analysis.
Figure 1: The schedule of experiment design: Male mice about 42 days of age (~ 6 weeks of age) underwent to 15 consecutive days of exposure to O3 or filtered air (FA). During the exposures (4 hours/day) mice were weighed and assessed daily. After 8 weeks, all mice were weighed 3 times per week until the disease onset-stage (~ 12-13 weeks of age). The rotarod motor test was performed on all mice once a week, starting from the 6 weeks of age until the day of euthanasia (95-100 ± 2 days), when the animals were terminally anesthetized and blood was collected for the measurement of plasma glucose content and metabolic markers using Luminex® 200TM technology.
Measurement of plasma glucose content
At disease end-stage (~95-100 ± 2 days), animals were terminally anesthetized with sodium pentobarbitone (140 mg kg-1) and transcardially perfused with room temperature 0.01 M phosphate buffered saline (PBS; pH 7.4), in the middle of the light cycle (between 11 AM and 1 PM). The whole blood was collected by cardiac puncture [32]. Immediately, glucose levels were measured using a glucometer (FreeStyle Optium™ Neo H glucometer, Abbott Diabetes Care Inc, USA), previously calibrated for plasma glucose levels. The samples remaining after the glucometer measurements were immediately centrifuged at 3380 g for 10 min at room temperature to separate plasma samples, which were immediately frozen on dry ice and stored at -80°C for later analysis [33].
Measurement of metabolic markers plasma
Total ghrelin, the adipokines resistin and leptin, and metabolic biomarkers of insulin resistance (GIP, GLP-1, glucagon, PAI-1 and insulin) from plasma samples were analyzed in duplicate by using the Bio-PlexPro mouse diabetes group from Bio-Rad (Ref. 171F7001M) and Luminex® 200TM technology as previously described [34]. Samples were processed following the manufacturer’s instructions. According to Bio-Rad’s information the intra and inter assay CV variability is <20%.
The final concentration value of each metabolic marker was the result of the mean from the duplicate measures.
Statistical analysis
All data are presented as Mean ± Standard Error of the Mean (SEM). Differences between means were assessed by two-way ANOVA followed by Tukey post hoc analysis. For multiplex assays, the median for each sample group was determined for all the analytes, and Kruskal–Wallis test was performed followed by Dunett’s post hoc test to compare all groups with WT controls in response to FA, while Bonferroni post hoc test were used for multiple comparisons between all groups. Spearman correlation was performed for the adipokines and metabolic proteins, respectively. For all statistical tests, a p value of <0.05 (CI 95%) was assumed to be significant. Statistical analysis was performed using Graph Pad Prism software (version 8.3.1).
Results
Evaluation of O3 exposure on disease progression
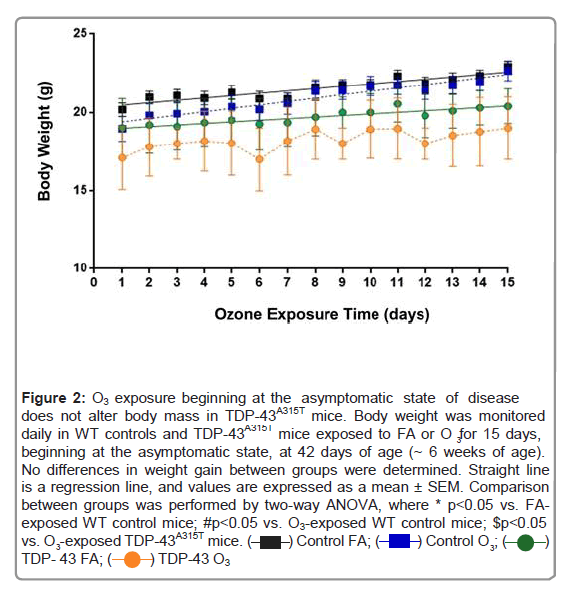
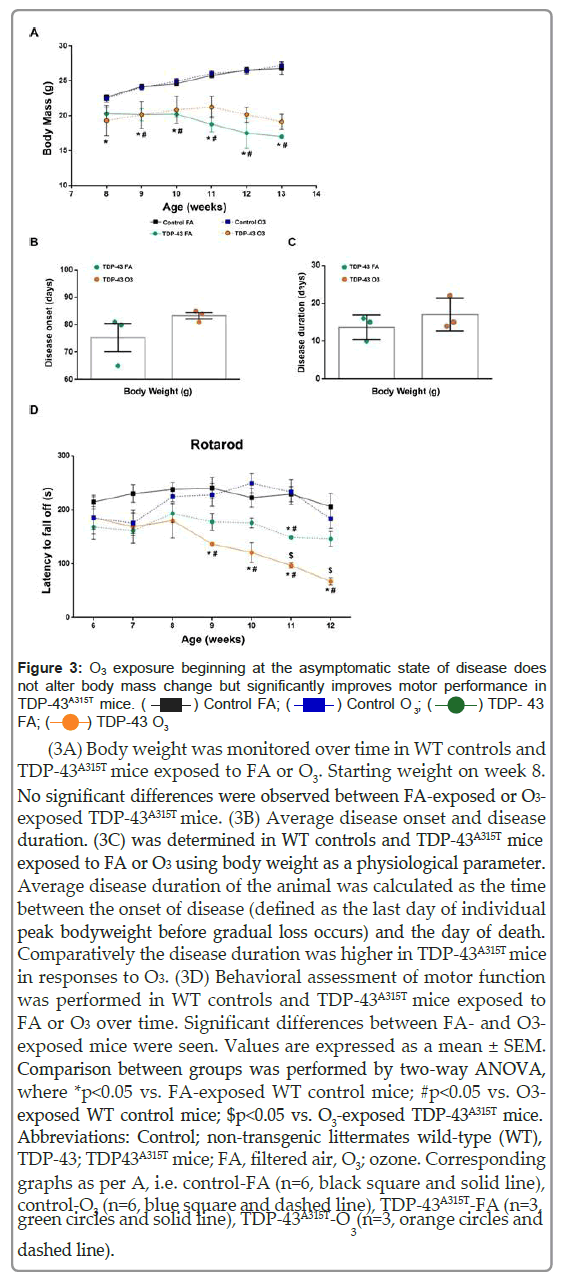
ALS causes loss of body weight and reduced fat mass [35,36]. Thus, as TDP-43A315T mice exhibit weight loss during disease progression [29,37-39], we assessed the capacity of O3 to modify weight changes over time. During the 15 days of exposures, no differences in weight gain between groups (O3 group vs. FA group) were displayed (Figure 2). A two-way ANOVA with repeated measures revealed a significant genotype interaction (Figure 3A; F (15, 81)=87.72, p<0.0001), indicating a sustained decline in body weight in TDP-43A315T mice compared to WT controls in responses to FA or O3 over time. Although there was a trend, no significant differences were observed between FA- exposed or O3-exposed TDP-43A315T mice, however, the calculation of the disease onset using this parameter indicated that TDP-43A315T O3- exposed develop symptoms later than FA-exposed TDP-43A315T mice. Using body weight measurements an average onset of 75 ± 5 days of age was determined for in TDP-43A315T mice in responses to FA, whereas in responses to O3, TDP-43A315T mice presented a phenotype at 83 ± 1 days of age (Figure 3B). To further assess changes in weight due to the effect of O3 exposure on disease progression based on the determined disease onset, we calculated disease duration (Figure 3C). Comparatively the disease duration was longer in TDP-43A315T mice in responses to O3 (Figure 3C), although O3-exposed TDP-43A315T mice did not live significantly longer compared with FA-treated TDP-43A315T mice.
Figure 2: O3 exposure beginning at the asymptomatic state of disease does not alter body mass in TDP-43A315T mice. Body weight was monitored daily in WT controls and TDP-43A315T mice exposed to FA or O3 for 15 days, beginning at the asymptomatic state, at 42 days of age (~ 6 weeks of age). No differences in weight gain between groups were determined. Straight line is a regression line, and values are expressed as a mean ± SEM. Comparison between groups was performed by two-way ANOVA, where * p<0.05 vs. FA- exposed WT control mice; #p<0.05 vs. O3-exposed WT control mice; $p<0.05 vs. O -exposed TDP-43A315T mice.

Figure 3: O3 exposure beginning at the asymptomatic state of disease does not alter body mass change but significantly improves motor performance in

(3A) Body weight was monitored over time in WT controls and TDP-43A315T mice exposed to FA or O3. Starting weight on week 8. No significant differences were observed between FA-exposed or O3- exposed TDP-43A315T mice. (3B) Average disease onset and disease duration. (3C) was determined in WT controls and TDP-43A315T mice exposed to FA or O3 using body weight as a physiological parameter. Average disease duration of the animal was calculated as the time between the onset of disease (defined as the last day of individual peak bodyweight before gradual loss occurs) and the day of death. Comparatively the disease duration was higher in TDP-43A315T mice in responses to O3. (3D) Behavioral assessment of motor function was performed in WT controls and TDP-43A315T mice exposed to FA or O3 over time. Significant differences between FA- and O3- exposed mice were seen. Values are expressed as a mean ± SEM. Comparison between groups was performed by two-way ANOVA, where *p<0.05 vs. FA-exposed WT control mice; #p<0.05 vs. O3- exposed WT control mice; $p<0.05 vs. O3-exposed TDP-43A315T mice.Abbreviations: Control; non-transgenic littermates wild-type (WT), TDP-43; TDP43A315T mice; FA, filtered air, O3; ozone. Corresponding graphs as per A, i.e. control-FA (n=6, black square and solid line), control-O3 (n=6, blue square and dashed line), TDP-43A315T-FA (n=3, green circles and solid line), TDP-43A315T-O (n=3, orange circles and dashed line).
We also tested motor behavior to determine if O3 exposure could alter disease phenotype. Our results indicate a progressive decline in motor coordination in TDP-43A315T mice, confirming the progressive motor deficits of the TDP-43A315T mouse model reported previously [40]. TDP-43A315T mice consistently scored lower than WT littermate controls at all time-points examined. A two-way ANOVA with repeated measures revealed a significant interaction of the group by week (Figure 3D) (F (6,97)=3.051 p<0.008), indicating differential change over time in rotarod performance. However, O3-exposed TDP-43A315T mice showed a significant improvement in motor performance at later time points, indicating the potential effect of O3 on motor function. Indeed, the rotarod test displayed that FA-exposed TDP-43A315T mice suffer a more significant drop in performance and progressive impairment in motor capacity over time.
Evaluation of O3 exposure in adipokines and metabolic proteins
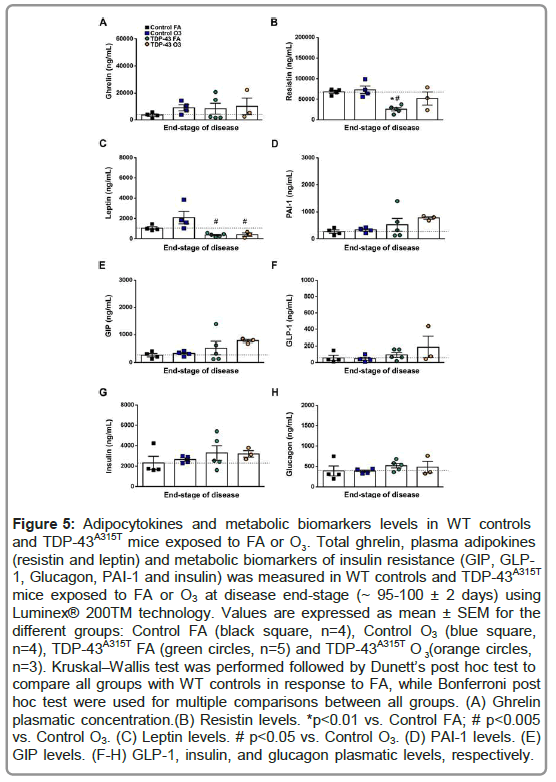
We next studied how adipokines and proteins involved in metabolism were affected in the plasma of TDP-43A315T mice at the end-stage of disease (Figure 4). We found altered circulating grelyn, resistin and leptin concentrations in the plasma of TDP-43A315T mice compared to age-matched controls (Figures 5A-5C). Dunett’s post hoc test demonstrated a significant reduction in the plasma levels of resistin in FA-exposed TDP-43A315T mice compared to FA-WT controls (Figure 5B). Bonferroni’s post hoc test demonstrated a significant reduction in the circulating levels of resistin in FA-exposed TDP-43A315T mice compared to O3-exposed WT controls (Figure 5B). Interestingly, although a significant reduction in the levels of leptin in TDP-43A315T mice exposed to either O3 or FA compared to O3-exposed WT mice, no significant differences were determined in the circulating levels of leptin in O3-exposed WT mice compared to FA-exposed WT controls (Figure 5C).
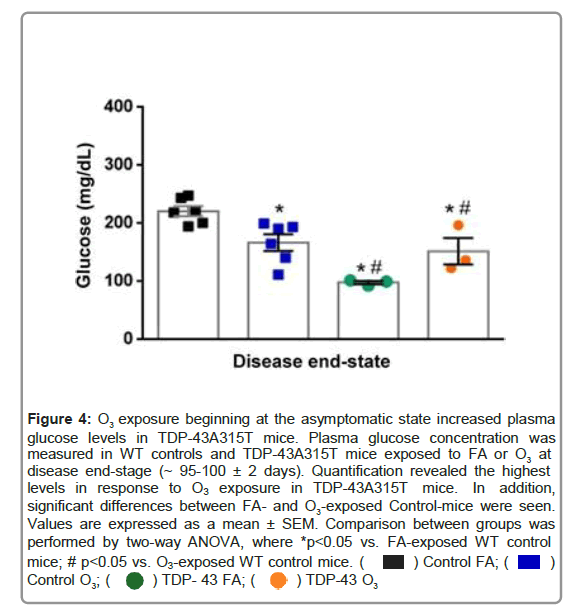
Figure 4: O3 exposure beginning at the asymptomatic state increased plasma glucose levels in TDP-43A315T mice. Plasma glucose concentration was measured in WT controls and TDP-43A315T mice exposed to FA or O3 at disease end-stage (~ 95-100 ± 2 days). Quantification revealed the highest levels in response to O3 exposure in TDP-43A315T mice. In addition, significant differences between FA- and O3-exposed Control-mice were seen. Values are expressed as a mean ± SEM. Comparison between groups was performed by two-way ANOVA, where *p<0.05 vs. FA-exposed WT control mice; # p<0.05 vs. O3-exposed WT control mice. 

Figure 5: Adipocytokines and metabolic biomarkers levels in WT controls 3 (resistin and leptin) and metabolic biomarkers of insulin resistance (GIP, GLP- 1, Glucagon, PAI-1 and insulin) was measured in WT controls and TDP-43A315T mice exposed to FA or O3 at disease end-stage (~ 95-100 ± 2 days) using Luminex® 200TM technology. Values are expressed as mean ± SEM for the different groups: Control FA (black square, n=4), Control O3 (blue square, and TDP-43A315T mice exposed to FA or O . Total ghrelin, plasma adipokines n=4), TDP-43A315T FA (green circles, n=5) and TDP-43A315T O (orange circles, 3 n=3). Kruskal–Wallis test was performed followed by Dunett’s post hoc test to compare all groups with WT controls in response to FA, while Bonferroni post hoc test were used for multiple comparisons between all groups. (A) Ghrelin plasmatic concentration.(B) Resistin levels. *p<0.01 vs. Control FA; # p<0.005 vs. Control O3. (C) Leptin levels. # p<0.05 vs. Control O3. (D) PAI-1 levels. (E) GIP levels. (F-H) GLP-1, insulin, and glucagon plasmatic levels, respectively.
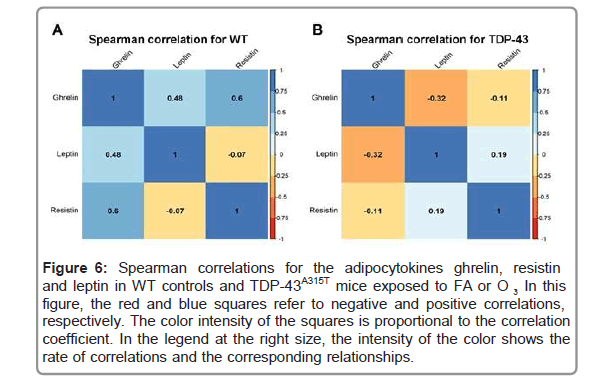
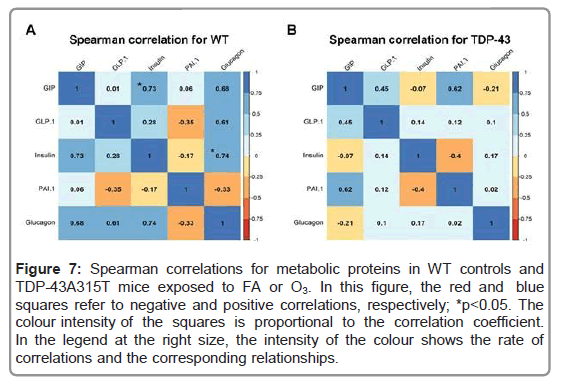
To further analyze metabolism, circulating levels of PAI-1, GIP, GLP-1, insulin and glucagon peptides were measured in TDP- 43A315T and age-matched WT littermates at the end-stage of disease (Figures 5D-5H) [41]. Circulating plasma levels of PAI-1, GIP, GLP- 1, and insulin are higher in O3-exposed TDP-43A315T mice relative to WT controls (Figures 5D-5G), while no statistical difference were determined compared to either O3 or FA WT mice. Finally, no linear correlation was found using Spearman’s test among the among the plasmatic levels of total ghrelin, and the adipokines resistin and leptin, in WT controls (Figure 6A) or TDP-43A315T mice (Figure 6B) exposed to FA or O3, respectively. Nevertheless, it is worth noting that a positive linear correlation was found using Spearman’s test among the plasmatic levels of GIP and insulin (95% CI [0.027, 0.950], p=0.039) as well as insulin and glucagon (95% CI [0.043, 0.951], p=0.036) concentrations in WT controls (Figure 7A), although no linear correlation was found compared to TDP-43 mice (Figure 7B).
Figure 6: Spearman correlations for the adipocytokines ghrelin, resistin and leptin in WT controls and TDP-43A315T mice exposed to FA or O . In this figure, the red and blue squares refer to negative and positive correlations, respectively. The color intensity of the squares is proportional to the correlation coefficient. In the legend at the right size, the intensity of the color shows the rate of correlations and the corresponding relationships.
Figure 7: Spearman correlations for metabolic proteins in WT controls and TDP-43A315T mice exposed to FA or O3. In this figure, the red and blue squares refer to negative and positive correlations, respectively; *p<0.05. The colour intensity of the squares is proportional to the correlation coefficient. In the legend at the right size, the intensity of the colour shows the rate of correlations and the corresponding relationships.
Discussion
A growing body of evidence indicates disturbances in energy metabolism in ALS, suggesting that targeting metabolism could represent a rational strategy to treat this disease [24-27]. Metabolic abnormalities have been reported in both ALS patients and mouse models of ALS [42-45]. A new body of clinical data indicates the effectiveness of O3 therapy in the treatment of degenerative disorders; however, no studies have been conducted, so far, to investigate the direct influence of O3 in altering energy metabolism and disease progression in ALS [18, 22, 23]. Here, we present evidence of the effect of O3 on motor behavior and disease-associated weight loss in the TDP43A315T transgenic ALS mouse model, providing novel insights about the mechanistic link between O3 exposure and the improvement of the metabolic disturbances present in ALS disease.
Here we report that O3 exposure has an impact on the regulation of the expression of certain metabolic proteins that are linked to metabolic disease (i.e. obesity and diabetes type II). This is concordant with previous mouse studies that saw that acute O3 exposure causes endocrine and metabolic changes, increasing food intake and body fat mass [46]. We have identified specific alterations in circulating levels of GIP, PAI-1, and insulin in response to O3 exposure in TDP-43A315T mice. This observation is of interest because it has been shown that PAI-1 and insulin are metabolic proteins associated with an increase in adiposity and Body Mass Index (BMI), and GIP stimulates insulin secretion in response to food intake [47-49]. These data might indicate that O3, cause endocrine and metabolic changes in TDP-43A315T mice which would help reduce disturbances in energy metabolism associated with the progression of ALS. Indeed, O3 exposure mitigates the sustained decline in body weight in TDP-43A315T mice over time. This observation is of interest because patients with ALS are unable to maintain their body weight and rapid weight loss in ALS disease is associated with worse disease outcomes [50-52]. In this context, it would be plausible that this effect of O3 on body weight gain in TDP-43A315T mice could partly be due to modifications in food intake and ultimately the loss of body weight in TDP-43A315T mice [29,37-39]. Indeed, a positive correlation was found among the plasmatic levels of GIP and glucagon relative to insulin concentrations in WT controls, which strongly associated exposure to O3 with the development of obesity [53]. However, future experiments should try to corroborate this hypothesis.
Furthermore, although a progressive motor impairment has been described in TDP-43A315T mice [40], our results confirm that O3 significantly improved motor function in TDP-43A315T mice over time, and resulted in higher plasma glucose levels at end-stage of ALS disease. The observation in glucose content in plasma is of particular interest as ALS patients have glucose metabolism defects which could partly be due because of higher levels of circulating glucagon [54]. Indeed, we found lower levels of circulating glucagon in O3-exposed TDP-43A315T mice compared to FA-treated TDP-43A315T mice, and a positive correlation was determined among the plasmatic levels of GIP and glucagon compared to insulin concentrations in WT mice. Thus, since it has been suggested that an increase in disease severity in ALS patients is correlated with increased circulating glucagon levels our data are congruent with the observations that insulin resistance is related to disease severity and outcome in ALS [55].
Conclusion
In summary, our study provides the first experimental evidence suggesting for a potential beneficial effect of O3 in motor function and some metabolic disturbances present in TDP-43A315T mice. However, the precise pathways that could link O3 effects to the TDP-43 proteinopathy model of ALS remain unclear. Further mechanistic studies analyzing how O3 contributes to disease progression may require at the inclusion of additional defined time-points, as well as larger sample sizes. Determining the mechanistic actions of O3 may provide a new avenue for therapeutic development for this fatal condition.
Acknowledgement
The authors would like to gratefully acknowledge Marta Cabrera- Pinto and Surgery Unit of the UDI-HNP for their excellent technical support.
Conflicts of Interest
The authors declare no conflict of interest.
References
- Tapia R (2014) Cellular and molecular mechanisms of motor neuron death in amyotrophic lateral sclerosis: a perspective. Front Cell Neurosci 8:241.
- Zarei S, Carr K, Reiley L, Diaz K, Guerra O, et al. (2015) A comprehensive review of amyotrophic lateral sclerosis. Surg Neurol Int 6:171.
- (2016) Humans IWGotEoCRt. Outdoor Air Pollution. IARC Monogr Eval Carcinog Risks Hum.109:9-444.
- D'Amato G, Annesi-Maesano I, Cecchi L, D'Amato M (2019) Latest news on relationship between thunderstorms and respiratory allergy, severe asthma, and deaths for asthma. Allergy 74:9-11.
- Manisalidis I, Stavropoulou E, Stavropoulos A, Bezirtzoglou E (2020) Environmental and health impacts of air pollution: A Review. Front Public Health 8:14.
- Sokolowska M, Quesniaux VFJ, Akdis CA, Chung KF, Ryffel B, et al., (2019) Acute respiratory barrier disruption by ozone exposure in mice. Front Immunol 10:2169.
- Bourdrel T, Bind MA, Bejot Y, Morel O, Argacha JF (2017) Cardiovascular effects of air pollution. Arch Cardiovasc Dis 110:634-42.
- Song J, Zhu J, Tian G, Li H, An Z, et al., (2020) Short time exposure to ambient ozone and associated cardiovascular effects: A panel study of healthy young adults. Environ Int 137:105579.
- Shore SA (2019) The Metabolic Response to Ozone. Front Immunol 10:2890.
- Thomson EM, Pilon S, Guenette J, Williams A, Holloway AC (2018) Ozone modifies the metabolic and endocrine response to glucose: Reproduction of effects with the stress hormone corticosterone. Toxicol Appl Pharmacol 342:31-8.
- Bello-Medina PC, Prado-Alcala RA, Rivas-Arancibia S (2019) Effect of ozone exposure on dendritic spines of CA1 pyramidal neurons of the dorsal Hippocampus and on object-place recognition memory in rats. Neuroscience 402:1-10.
- Rivas-Arancibia S, Guevara-Guzman R, Lopez-Vidal Y, Rodriguez-Martinez E, Zanardo-Gomes M, et al. (2010) Oxidative stress caused by ozone exposure induces loss of brain repair in the hippocampus of adult rats. Toxicol Sci 113:187-97.
- Kremens D, Hauser RA, Dorsey ER (2014) An update on Parkinson's disease: Improving patient outcomes. Am J Med 127:S3.
- Ritz B, Lee PC, Hansen J, Lassen CF, Ketzel M, et al., (2016) Traffic-related air pollution and parkinson's disease in Denmark: A case-control study. Environ Health Perspect 124:351-6.
- Genc S, Zadeoglulari Z, Fuss SH, Genc K (2012) The adverse effects of air pollution on the nervous system. J Toxicol 2012:782462.
- Bocci V, Borrelli E, Travagli V, Zanardi I (2009) The ozone paradox: ozone is a strong oxidant as well as a medical drug. Med Res Rev 29:646-82.
- Braidy N, Izadi M, Sureda A, Jonaidi-Jafari N, Banki A, et al., (2018) Therapeutic relevance of ozone therapy in degenerative diseases: Focus on diabetes and spinal pain. J Cell Physiol 233:2705-14.
- Scassellati C, Galoforo AC, Bonvicini C, Esposito C, Ricevuti GÂ (2020) Ozone: A natural bioactive molecule with antioxidant property as potential new strategy in aging and in neurodegenerative disorders. Ageing Res Rev 63:101138.
- Gupte AA, Lyon CJ, Hsueh WA (2013) Nuclear factor (erythroid-derived 2)-like-2 factor (Nrf2), a key regulator of the antioxidant response to protect against atherosclerosis and nonalcoholic steatohepatitis. Curr Diab Rep 13:362-71.
- Jakab GJ, Spannhake EW, Canning BJ, Kleeberger SR, Gilmour MI (1995) The effects of ozone on immune function. Environ Health Perspect 103 Suppl 2:77-89.
- Tashiro H, Shore SA (2021) The gut microbiome and ozone-induced airway hyperresponsiveness: Mechanisms and therapeutic prospects. Am J Respir Cell Mol Biol 64:283-91.
- Izadi M, Tahmasebi S, Pustokhina I, Yumashev AV, Lakzaei T, et al. (2020) Changes in Th17 cells frequency and function after ozone therapy used to treat multiple sclerosis patients. Mult Scler Relat Disord 46:102466.
- Delgado-Roche L, Riera-Romo M, Mesta F, Hernandez-Matos Y, Barrios JM, et al. (2017) Medical ozone promotes Nrf2 phosphorylation reducing oxidative stress and pro-inflammatory cytokines in multiple sclerosis patients. Eur J Pharmacol 811:148-54.
- Tefera TW, Borges K (2016) Metabolic dysfunctions in amyotrophic lateral sclerosis pathogenesis and potential metabolic treatments. Front Neurosci 10:611.
- Tefera TW, Steyn FJ, Ngo ST, Borges K (2021) CNS glucose metabolism in Amyotrophic Lateral Sclerosis: a therapeutic target? Cell Biosci 11:14.
- Vandoorne T, De Bock K, Van Den Bosch L (2018) Energy metabolism in ALS: an underappreciated opportunity? Acta Neuropathol 135:489-509.
- Blasco H, Lanznaster D, Veyrat-Durebex C, Hergesheimer R, Vourch P, et al. (2020) Understanding and managing metabolic dysfunction in Amyotrophic Lateral Sclerosis. Expert Rev Neurother 20:907-19.
- Wegorzewska I, Bell S, Cairns NJ, Miller TM, Baloh RH (2009) TDP-43 mutant transgenic mice develop features of ALS and front temporal lobar degeneration. Proc Natl Acad Sci U S A 106:18809-14.
- Hatzipetros T, Bogdanik LP, Tassinari VR, Kidd JD, Moreno AJ et al. (2014) C57BL/6J congenic Prp-TDP43A315T mice develop progressive neurodegeneration in the myenteric plexus of the colon without exhibiting key features of ALS. Brain Res 1584:59-72.
- Dang TN, Lim NK, Grubman A, Li QX, Volitakis I, et al. (2014) Increased metal content in the TDP-43(A315T) transgenic mouse model of frontotemporal lobar degeneration and amyotrophic lateral sclerosis. Front Aging Neurosci 6:15.
- Mandillo S, Tucci V, Holter SM, Meziane H, Banchaabouchi MA, et al. (2008) Reliability, robustness, and reproducibility in mouse behavioral phenotyping: A cross-laboratory study. Physiol Genomics 34:243-55.
- Bewick GA, Kent A, Campbell D, Patterson M, Ghatei MA, et al. (2009)Â Mice with hyperghrelinemia are hyperphagic and glucose intolerant and have reduced leptin sensitivity. Diabetes 58:840-6.
- Togashi Y, Shirakawa J, Okuyama T, Yamazaki S, Kyohara M, et al. (2016) Evaluation of the appropriateness of using glucometers for measuring the blood glucose levels in mice. Sci Rep 6:25465.
- Ortega Moreno L, Sanz-Garcia A, Fernandez de la Fuente MJ, Arroyo Solera R, et al. (2020) Serum adipokines as non-invasive biomarkers in Crohn's disease. Sci Rep 10:18027.
- Lopez-Gomez JJ, Ballesteros-Pomar MD, Torres-Torres B, De la Maza BP, Penacho-Lazaro MA, et al. (2021) Malnutrition at diagnosis in amyotrophic lateral sclerosis (als) and its influence on survival: Using glim criteria. Clin Nutr 40:237-44.
- Ludolph AC, Dorst J, Dreyhaupt J, Weishaupt JH, Kassubek J, et al., (2020) Effect of high-caloric nutrition on survival in amyotrophic lateral sclerosis. Ann Neurol 87:206-16.
- Esmaeili MA, Panahi M, Yadav S, Hennings L, Kiaei M (2013) Premature death of TDP-43 (A315T) transgenic mice due to gastrointestinal complications prior to development of full neurological symptoms of amyotrophic lateral sclerosis. Int J Exp Pathol 94:56-64.
- Guo Y, Wang Q, Zhang K, An T, Shi P, et al. (2012) HO-1 induction in motor cortex and intestinal dysfunction in TDP-43 A315T transgenic mice. Brain Res 1460:88-95.
- Medina DX, Orr ME, Oddo S (2014) Accumulation of C-terminal fragments of transactive response DNA-binding protein 43 leads to synaptic loss and cognitive deficits in human TDP-43 transgenic mice. Neurobiol Aging 35:79-87.
- Stallings NR, Puttaparthi K, Luther CM, Burns DK, Elliott JL (2010) Progressive motor weakness in transgenic mice expressing human TDP-43. Neurobiol Dis 40:404-14.
- Kim SM, Kim H, Kim JE, Park KS, Sung JJ, et al. (2011) Amyotrophic lateral sclerosis is associated with hypolipidemia at the presymptomatic stage in mice. PLoS One.6:e17985.
- Dupuis L, Oudart H, Rene F, Gonzalez de Aguilar JL, et al. (2004). Evidence for defective energy homeostasis in amyotrophic lateral sclerosis: benefit of a high-energy diet in a transgenic mouse model. Proc Natl Acad Sci U S A 101:11159-64.
- Lim MA, Bence KK, Sandesara I, Andreux P, Auwerx J, et al. (2014) Genetically altering organismal metabolism by leptin-deficiency benefits a mouse model of amyotrophic lateral sclerosis. Hum Mol Genet 23:4995-5008.
- Shan X, Chiang PM, Price DL, Wong PC (2010) Altered distributions of Gemini of coiled bodies and mitochondria in motor neurons of TDP-43 transgenic mice. Proc Natl Acad Sci U S A 107:16325-30.
- Wang W, Li L, Lin WL, Dickson DW, Petrucelli L, et al., (2013) The ALS disease-associated mutant TDP-43 impairs mitochondrial dynamics and function in motor neurons. Hum Mol Genet 22:4706-19.
- Nappi F, Barrea L, Di Somma C, Savanelli MC, Muscogiuri G, et al. (2016) Endocrine aspects of environmental "obesogen" pollutants. Int J Environ Res Public Health 13.
- Kahn SE, Zinman B, Haffner SM, O'Neill MC, Kravitz BG, et al. (2006) Obesity is a major determinant of the association of C-reactive protein levels and the metabolic syndrome in type 2 diabetes. Diabetes 55:2357-64.
- Ngo ST, Steyn FJ, Huang L, Mantovani S, Pfluger CM, et al. (2015) Altered expression of metabolic proteins and adipokines in patients with amyotrophic lateral sclerosis. J Neurol Sci 357:22-7.
- Elliott RM, Morgan LM, Tredger JA, Deacon S, Wright J, et al. (1993) Glucagon-like peptide-1 (7-36)amide and glucose-dependent insulinotropic polypeptide secretion in response to nutrient ingestion in man: acute post-prandial and 24-h secretion patterns. J Endocrinol 138:159-66.
- Bouteloup C, Desport JC, Clavelou P, Guy N, Derumeaux-Burel H, et al. (2009) Hypermetabolism in ALS patients: an early and persistent phenomenon. J Neurol 256:1236-42.
- Desport JC, Preux PM, Magy L, Boirie Y, Vallat JM, et al. (2001) Factors correlated with hypermetabolism in patients with amyotrophic lateral sclerosis. Am J Clin Nutr 74:328-34.
- Ahmed RM, Phan K, Highton-Williamson E, Strikwerda-Brown C, Caga J, et al. (2019) Eating peptides: biomarkers of neurodegeneration in amyotrophic lateral sclerosis and frontotemporal dementia. Ann Clin Transl Neurol 6:486-95.
- Campolim CM, Weissmann L, Ferreira CKO, Zordao OP, Dornellas APS, et al., (2020) Short-term exposure to air pollution (PM2.5) induces hypothalamic inflammation, and long-term leads to leptin resistance and obesity via Tlr4/Ikbke in mice. Sci Rep 10:10160.
- Hubbard RW, Will AD, Peterson GW, Sanchez A, Gillan WW, et al. (1992) Elevated plasma glucagon in amyotrophic lateral sclerosis. Neurology 42:1532-4.
- Muddapu VR, Dharshini SAP, Chakravarthy VS, Gromiha MM (2020) Neurodegenerative Diseases - Is Metabolic Deficiency the Root Cause? Front Neurosci 14:213.
Citation: Rodriguez A , Donato AF, Seseña S, Fernández P, Aranda A, et al. (2021) Repeated Exposure to Ozone Produces Changes in Metabolic Disturbances Present in the TDP-43A315T Transgenic Model of Amyotrophic Lateral Sclerosis. Diagnos Pathol Open S8 :031.
Copyright: © 2021 Rodriguez A, et al. This is an open-access article distributed under the terms of the Creative Commons Attribution License, which permits unrestricted use, distribution, and reproduction in any medium, provided the original author and source are credited.
Select your language of interest to view the total content in your interested language
Share This Article
Open Access Journals
Article Usage
- Total views: 2900
- [From(publication date): 0-2021 - Dec 22, 2025]
- Breakdown by view type
- HTML page views: 2177
- PDF downloads: 723

