Research Article Open Access
Short-Term Variations of Aerosol Optical Depth during the Severe Dust Storm in 2015 over the Middle East and Long-term Variations of Aerosol Optical Properties
Foroozan Arkian*Meteorology Department, Marine Science and Technology Faculty, North Tehran Branch, Islamic Azad University, Tehran, Iran
- *Corresponding Author:
- Foroozan Arkian
Meteorology Department, Marine
Science and Technology Faculty
North Tehran Branch, Islamic Azad University
Tehran, Iran
Tel: +989125805886
E-mail: f.arkian@gmail.com
Received date: May 04, 2017; Accepted date: May 29, 2017; Published date: June 05, 2017
Citation: Arkian F (2017) Short-Term Variations of Aerosol Optical Depth during the Severe Dust Storm in 2015 over the Middle East and Long-term Variations of Aerosol Optical Properties. Environ Pollut Climate Change 1:127.
Copyright: © 2017 Arkian F. This is an open-access article distributed under the terms of the Creative Commons Attribution License, which permits unrestricted use, distribution, and reproduction in any medium, provided the original author and source are credited.
Visit for more related articles at Environment Pollution and Climate Change
Abstract
Severe dust storm, with winds reaching 100 km/h, caused widespread disruption across the Middle East and northeastern part of Africa in February 2015. Residents of the regions experienced extraordinary increases in air pollution from 1 to 13 February 2015. We have analyzed changes in aerosol optical depth (AOD) during this event to identify the effect and the sources of such dust storms in the Middle East using the Moderate Resolution Imaging Spectroradiometer, the Multi-angle Imaging Spectrometer and the Cloud-Aerosol Lidar and Infrared Pathfinder Satellite Observation. Maximum AOD values occurred on 11 of February in some dust sources including Baghdad, Damascus, Cairo, and Solar Village (Saudi Arabia), where values 0.8, 1, 1.3 and 0.7 were recorded, respectively. In Iran, maximum AOD were recorded on the 11th of February over the southwestern regions including Ahvaz and Ilam cities, reaching 1.3 and 1, respectively. The study of MISRAOD showed an increasing trend in AOD over Ahvaz and Solar Village during 2000-2015. Aerosol optical properties such as Aerosol Volume Size Distribution (AVSD) Asymmetry parameter (ASY) and Single Scattering Albedo (SSA) have been analyzed for Zanjan (AERONET site) during 2010-2013. Monthly variation of AVSD indicated that the AVSD’s peaks occur in warm months. The mean value of ASY was found to be Σ0.7 in the cloud-free atmosphere for summer that shows high pollution level in Zanjan. The Aerosol Radiative Forcing (ARF) ranged from -79 Wm-2 to -10 Wm-2 at the surface and from -25 Wm-2 to 6 wm-2 at the top of the atmosphere.
Keywords
Middle east; Dust storm
Abbreviations
MODIS: Moderate Resolution Imaging Spectroradiometer; MISR: Multi-angle Imaging SpectroRadiometer; CALIPSO: Cloud-Aerosol Lidar and Infrared Pathfinder Satellite Observation; ARF: Areosol Radiative Folding; AOD: Aerosol Optical Depth
Introduction
Dust storms can occur in any area where dry, loose soil can easily be mobilized. Sand entrained into the air by the wind remains aloft only a few hours. Smaller particles can remain airborne for a week or more and can be transported thousands of miles from the source region. Some 75% of global dust released into the atmosphere appears to be natural in origin, while roughly 25% results from human activity, such as agriculture [1]. Agriculture influences dust events because of disturbed soil, reduced vegetation cover, grazing and so on make it easier for the wind to transport dust. Dust storms form in a desert and arid areas such as the Sahara Desert in Africa and some part of Middle East, like Iraq, Syria and Saudi Arabia. Dust aerosols often travel from these areas to the west part of Iran and thus loading large amounts of aerosol over the region. In the other hand, a large part of Hoor-al-azim, one of the most important marine ecosystems and nature in southwestern Iran, was destroyed during the Iran-Iraq war (1980-1988). The remaining part of Hoor Al-Azim was totally dried out by the oil companies, and consequently, this area releases massive amounts of aerosol to the atmosphere by wind. In recent years, dust particles from the external and the internal dust sources have endangered the health of people in southwestern and western Iran as the level of dust aerosols ultimately reached 10,000 μg/m3 in February 2015. Dust aerosols reduce the solar flux and outgoing long wave radiation. Therefore, they have an important influence on the earth’s radiation budget [2]. Dust aerosols influence on biological and chemical ecosystems via reflecting sunlight back into space [3]. They also influence on cloud formation, precipitation and environmental air quality [4-6].
A few studies have been done on optical properties of aerosols over Iran using AERONET observation [7,8]. Masoumi et al. [7] used groundbased aerosol monitoring network to study optical properties of aerosols such as AOD, AVSD, AE, SSA and refractive index over Zanjan during 2006–2008. Analysis showed SSA and the polarized phase function of atmospheric aerosols over Zanjan during 2010–2012. Masoumi et al. [7] studied optical properties of aerosols like AOD, AE, SSA, AVSD and refractive index over Zanjan during 2006–2008. Khoshsima et al. [8] investigated AOD, AE and Angstrom turbidity coefficient during 2009– 2010 over Zanjan. Another study has been conducted to determine optical properties and radiative effect of aerosol during two dust events in 2013 over Zanjan [9].
In recent years, the increase in the frequency of dust outbreaks in Africa and the Middle East due to land degradation and desertification affected aerosols concentration [10,11]. Since the Middle East is the world’s second largest source of dust [12], changes in aerosol concentration there have a significant impact not only on the local climate but also on remote regions by altering the incoming solar radiation and outgoing infrared radiation. Thus, we analyzed aerosol optical depth over the Middle East and northeastern part of Africa during severe dust storm in February 2015 using Moderate Resolution Imaging (MODIS) data. We have used the NOAA Hybrid Single Particle Lagrangian Integrated Trajectory (HYSPLIT) model for identifying the origin and track of dust over the study area, and we also have used CALIPSO (Cloud-Aerosol Lidar and Infrared Pathfinder Satellite Observation) measurement to identify the type aerosols near the study regions. In addition, we have investigated long- term trends of aerosol optical depth over Ahvaz (Iran) and some dust sources in the Middle East during 2000-2015 using Multi-angle Imaging Spectrometer (MISR) data. We have used AERONET data to analyze some aerosol optical properties such as Aerosol Volume Size Distribution, Single Scattering Albedo and Asymmetry Parameter over Zanjan during 2010-2013. We have analyzed aerosol radiative forcing (ARF) at the earth surface and the top of the atmosphere and we also calculated the correlation of ARF and aerosol optical thickness (AOT) over Zanjan during 2010-2013.
Data
Aerosol optical depth is an integral measure of the total amount of aerosol contained within a vertical column of air. Thus, it collectively assesses such aerosols as haze, desert dust, sea salt and smoke particles. The sun photometer measure AOD by a voltage (V) that is related to the irradiance (I). The irradiance and sun photometer voltage at the top of the atmosphere are Io and Vo, respectively. The Beer-Lambert-Bouguer law is used to determine total optical depth (τTOT):

Where V is voltage (at wavelength λ), τTOT is the total optical depth and d is the actual average of Earth-Sun distance and m is the optical air mass [13]. In this study, variations in AOD during the severe dust storm events over Africa and the Middle East were analyzed using MODIS and MISR data. Table 1 shows satellite and AERONET datasets used in this study.
Aerosol robotic network (AERONET)
This study uses aerosol optical depth (AOD) data from AERONET (Aerosol Robotic NETwork). AERONET is a network of surface monitoring stations, each of which uses the identical automatic Sunsky scanning spectral radiometer [13]. AERONET provides and archives two kinds of measurements that are useful in assessing aerosols characteristics. One is direct sun radiation extinction across the spectrum and the second is the angular distribution of sky radiance. From this, it is possible to compute in near-real-time aerosol spectral optical depths, aerosol size distributions, etc. There is only one AERONET monitoring station in Iran, in Zanjan city (IASBS) and we have used its AOD, AVSD, AE, SSA, ASY and ARF data in this research.
Moderate resolution imaging spectroradiometer
The MODIS instrument mounted on the Terra and the Aqua satellites have the spectral bands ranging from 250 m to 1.0 km at the nadir and various spatial resolutions. MODIS monitors the AOD with an error of 0.03 ± 0.05AOD over the ocean and ± 0.05+0.15 AOD over land. In this study is based on Deep Blue AOD at 550 nm (MYD08_ D3) for MODIS with spectral resolution bands 0.415 to 14.235 micron (http://giovanni.gsfc.nasa.gov/).
Multi-angle imaging spectroradiometer
The MISR instrument installed on the Terra satellite collects observations at nine different viewing angles. MISR enables to identify different types of atmospheric particles [14], cloud forms, and land surface covers in a sun-synchronous orbit. Diner et al. mentioned that 70% of MISR AOD data are within 0.05 (or 20% × AOD) of sunphotometer- measured AOD values [14].
We have used the MISR Level 3 Component Global Aerosol Product (MIL3MAE_v4 AOD) covering a day and month of column aerosol 555 nanometer optical depth. This data product is a global summary of the Level 2 aerosol parameters of interest averaged over a month, with a resolution of 0.5 degree by 0.5 degree (http://giovanni.gsfc.nasa.gov/). Aerosol Robotic Network (AERONET) data for the Zanjan station is also considered to verify MISRAOD data.
Cloud-aerosol Lidar and infrared pathfinder satellite observation (CALIPSO)
CALIPSO is operated from 28 April 2006. The Cloud-Aerosol Lidar and two wavelengths polarization Lidar (532 and 1064 nm) are carried by CALIPSO to identify effects of clouds and aerosols on climate. The detail about CALIPSO instruments and its data is provided by Hunt et al. [15] and Winker et al. [16].
Results and Discussion
Meteorological situation and formation of dust
The areas of the Middle East where dust storms occur most frequently include Iraq, Saudi Arabia, southeastern Iran and North Sudan. In most of the region dust storms most commonly occur in summer. Figure 1, shows the studied area that included the eastern part of North Africa and the Middle East.

Figure 1: The studied area.
Severe dust storm occurred over the Middle East and northeastern Africa in February 2015. Residents of the regions experienced extraordinary increases in air pollution from 1 to 13 February 2015. A sandstorm hit Egypt, Palestine, Syria and Lebanon on 9-13 February. One of the sources of the storm was the Sahara Desert in North Africa. A blanket of yellow dust storm covered Lebanon and Syria, and hundreds of people went to hospitals with breathing difficulties. The dust also passed through southwestern Iran, an area that had just experienced a severe dust storm. During the storm, particulate matter was reported to exceed 10,000 μg-3 in Ahvaz (Capital of Khuzestan province in Iran), which is 66 times greater than the standard level. The visibility reaches to less than 100 m. The instruments could not measure contamination because of the high concentration of particles in the air. This high concentration of dust normally indicates that Khuzestan highly affected by the local dust sources. In the last days, the dust concentration reached to 35 times greater than the standard level, and the visibility was less than 300 m.
| Sensor | Data used | Product | Special resolution | Spectral bond (nm) |
|---|---|---|---|---|
| MODIS Terra | February 2015 | Daily level-2 | 10 ˟10 km | 550 |
| MISR Terra | 2000-2015 | Daily level-3 | 0.5 ˟ 0.5° | 555 |
| CALIPSO | February 2015 | Daily level-2 | 1˟1 km | 532 and 1064 |
| AERONET (Ground base data) |
2010-2013 | Daily level-2 | 500 |
Table 1: Satellite and AERONET datasets used in this study.
The geopotential map at 1000 mb pressure level (Figure 2a) shows a Mediterranean low (winter Shamal) passed over the north part of the Middle East, producing severe dust storm and air pollution in this area. The winter Shamal is northwest wind which produced by passage a low pressure from eastern Mediterranean Sea into northern Arabia [17]. Severe winds around the southern side of the low-pressure system over the Eastern Mediterranean raised large amounts of dust from the Sahara, Syrian and Libyan Deserts (Figure 2B) for the high wind around the surface low over the Mediterranean Sea). Simultaneously, high wind speeds (about 100 km/h) around the Mediterranean low created two other dust sources in the North of Iraq and Saudi Arabia (Figure 2B). Nevertheless, the wind direction is totally different over the Persian Gulf and Khuzestan province. Draining of marshes in Hor al-Azim in the southwest of Iran due to strong southerly wind (>10 ms-1) probably caused high dust levels. The low surface system was accompanied by a cut-off low at 500 mb pressure level and a polar jet at the 300 mb pressure level with a positive tilt over Iraq (Figures 2C and 2D). This cut-off low is a blocking pattern because remain nearly stationary for several days in the area. The Meteosat-10 Dust RGB image, 11 February 00:00 UTC, showed that the dust was picked up from the North African coast (Egypt) and then propagated over the Middle East together with emissions from other dust sources including Iraq, Syria and northern Saudi Arabia (pink dust areas in Figure 2E).

Figure 2: Synoptic condition in 11th February 2015, (a) Geopotential height (Black solid lines) and temperature (Red dash lines) at the 1000 mb pressure level, (b) Wind direction at the 1000 mb pressure level, (c) Geopotential height (Black solid lines) and temperature (Red dash lines) at the 500 mb pressure level and (d) Wind speed at the 300 mb pressure level (Black line is the core of jet stream). (e) The evidence of dust storms (pink area) over and Iraq, Syria, Egypt and Saudi Arabia can be seen on the Meteosat-10 Dust RGB, 11 February 12:00 UTC (http://www.eumetsat.int).
Temporal variation of AOD during the dust storm event
We studied AOD variation during the February 2015 dust storm using MODIS data at a wavelength of 550 nm for different locations of the Middle East including Iraq (Baghdad), Syria (Damascus), Egypt (Cairo), Saudi Arabia (Solar Village) and Cairo in Africa as well. We also studied AOD variation in some cities of Iran including Ahvaz, Ilam, Sanandaj and Urmia during the February 2015. The maximum AODs in Baghdad, Damascus, Cairo and Solar Village were calculated on the 11th of February during the dust storm and reached values of 0.8, 1, 1.3 and 0.7, respectively (Figures 3A-3D). The maximum AODs were recorded in Iran over the southwestern regions such as Ahvaz and Ilam on the 11th of February but in western and northwestern regions such as Sanandaj and Urmia on 14th February. Because the dominant wind direction in southwestern Iran was from the south during the dust storm, dust from the southern regions was then transported into northern regions of Iran (Figures 3E-3H).

Figure 3: Variability of MODISAOD during February 2015 over (a) Damascus, (b) Baghdad, (c) Cairo, (d) Solar Village; and over some western stations of Iran (e) Ahvaz,(f) Ilam, (g) Sanandaj, (h) Urmia.
The NOAA Hybrid Single Particle Lagrangian Integrated Trajectory (HYSPLIT) model has been used for identify dust storm sources and the track the dust followed before reaching Iran. Three-day back trajectories have been derived for 0000 UTC 01 Feb 2015 (Figure 4A) and 0000 UTC 14 Feb 2015 (Figure 4B). Iran’s only AERONET station at Zanjan (IASBS) is used in this analysis. The HYSPLIT back trajectory analysis showed that the air masses came from Egypt and Mediterranean Sea and then passed through the south of Turkey and the north of Iraq and ultimately reached to Iran on 01 February 2015. But in the middle February 2015, the air masses reached Iran from Libya, Egypt and then Saudi Arabia and Iraq. CALIPSO satellite data (https://www-calipso. larc.nasa.gov) is used to study the type of aerosol over North Africa and the Middle East during dust storm event. Figures 4C-4E shows aerosol classification over northeastern Africa, Saudi Arabia and Iran during dusty days on February 2015, respectively. The dust and polluted dust [18] rise from surface to middle of troposphere (~5 km), and the thick and dense layer of dust indicated that a well-mixed dust layer occurred over the area.

Figure 4: Back trajectory of the air parcel for 72 h ending at 0000 UTC 1th (a) and 14th (b) February 2015 using NOAA HYSPLIT MODEL; Aerosol classification by CALIPSO (c) over northeastern Africa on 10th February (d) over Saudi Arabia on 1th February (e) over Iran on 3th February.
Long-term variation of AOD
We used long-term MISRAOD data to find the variation of AOD in some areas in the Middle East and North Africa where have more frequency of dust event. The MISR views the whole Earth’s surface every nine days. Depending on latitude, repeat coverage occurs between 2 and 9 days. MISR has a ~400 km swath (MISR Technical Document). Based on this fact, MISR is not designed to provide daily data, so we used annual average data for the study of the variability of AOD during 2001- 2015 (Figures 5A-5D). The dotted blue is the trend line. An increasing trend is seen in AOD in Ahvaz (Iran) and Solar Village (Saudi Arabia) with maximum AOD values in 2008, 2012 and 2015. Variability in AOD in Solar Village is more similar in trend and magnitude to Ahvaz in 2000-2015 (Figures 5A-5D). Dust storms are rare during the winter in the Middle East, but one occurred in February 2008, like February 2015 (current research). During this event, dust plumes blew over Iran, the Persian Gulf, Afghanistan, and Pakistan as a result of unusually dry conditions and very high winds [10]. Also, super dust storms reduced the air quality over the Middle East and Southwest Asia on March 2012 [19]. What these three years have in common are dust events in winter and early spring.

Figure 5: Variability of MISRAOD (555 nm) annual average over (a) Ahvaz, (b) Mosul, (c) Cairo, (d) Solar village.

Figure 6: Comparison between MISRAOD and AERONETAOD in four spectral bands (Blue=440 nm, Red=675 nm, NIR=870 nm, NIR=1020 nm) over IASBS. The linear regression line is shown in dotted line and the solid line represents the 1:1 line in each subplot.
There is no significant change in AOD in Cairo. At Mosul (Iraq) there are two separate trends (Red dashed line, Figure 5B); such that AOD variations show an increasing trend during 2000-2008 and a decreasing trend during 2008-2014.
We extracted the AOD data of the sun photometer site (IASBS) in Iran for 2010 from the AERONET level 2 data archive and then we used it for assessing the accuracy of MIRAOD data. This sun photometer site is located in Zanjan city in Northwest Iran. The AOD Data recorded every 15 min in four spectral bands (440,675,870 and 1020 nm). Since, the MISR observation repeat time is only 3 or 4 visits per month for the IASBS site, we compare AERONETAOD and MISRAOD daily data when MISR swept this site [20].
Figure 6 shows a comparison of MISRAOD data and AERONETAOD at four bands [Red (675), NIR (870 nm) and NIR (1020 nm)] for 2010. The scatterplots of MISRAOD and AERONETAOD show a high correlation of Σ0.8 in the four bands. The comparison showed that MISRAOD values are overestimated when AOD values are small, in the three bands including Red (675), NIR (870 nm) and NIR (1020 nm). Lack of suitable aerosol models or the temporal and spatial variability of aerosols can cause this difference [21]. Figure 6 also shows that when AOD values are large, especially larger than 0.3, differences between MISRAOD and AERONETAOD grow rapidly. Christopher et al. [22] found similar results at the Sede Boqer site.
Aerosol volume size distribution
Aerosol Volume Size Distribution (AVSD) is a parameter that is retrieved in size range of 0.05-15 μm using 22 radius size bins and it is very important in climate change. AVSD can express by following equation:
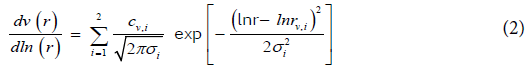
Where σ is the standard deviation and cv,i and rv,i are total volume concentration of fine to coarse size and volume median radius, respectively. Figure 7 shows AERONET retrieved AVSD in different radiuses during 2010-2013 over Zanjan. The AVSD variations display two modes, fine and coarse. The radius in the fine mode ranged from 0.05 μm to 0.33 μm, and the radius in the coarse mode ranged from 0.33 μm to 15 μm for each year. Significant variations are observed in the coarse mode, while, low variations can be found in the fine mode. Sumit et al. [23] showed that the coarse mode particles were also dominant over Ahmedabad. The highest values of AVSD in the fine and the coarse modes observed in 0.11 μm and 2.24 μm radius, respectively. The both modes have their maximum value of AVSD in 2011. Maximum values of AVSD in the coarse mode are lower in 2013 and 2014 and they are shifted to higher radiuses. Fine particles are produced from all types of combustion such as power plants, motor vehicles, forest fires, agricultural burning, residential wood burning and some industrial processes. Coarse particles are including crushing or grinding processes, dust storm and dust moved up by vehicles on roads (U.S Environment Protection Agency, https:// www.epa.gov/air-trends).

Figure 7: (a) AERONET retrieved AVSD in different radius; (b) AERONET retrieved AVSD for 0.11 µm and 0.24 µm radiuses over Zanjan during 2010-2013 period.
Figures show monthly variations of AVSD for particles with radiuses of 0.11μm and 2.24 μm over Zanjan during the 2010-2013 periods. The Monthly variation of AVSD for particles with radiuses of 0.11μm and 2.24 μm indicated that the AVSD’s peaks occur in warm months over Zanjan. A radius of 0.24 μm has its maximum value in May 2011, while a radius of 0.11 μm has a maximum value in July 2011.
Single scattering albedo and asymmetry parameters
We also analyzed asymmetry paramter (ASY) and single scattering albedo (SSA) of aerosols. ASY is used in calculations of radiative transfer and indicate useful information about aerosol absorption and it depends on the size of aerosol and the composition. ASY is calculated by following equation:
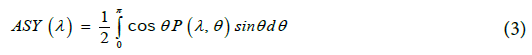
Where P(λ,θ) is the phase function and θ is the angle between the incident and scattered radiation. If the scattering is symmetric, ASY becomes zero, for completely forward scattering it is +1 and it is taken to be -1 for completely backward scattering. Figure 8A shows ASY (solid lines) and AOT (dash lines) over Zanjan during 2010-2013. The decreasing trend in ASY can be seen with increasing wavelengths. ASY and AOT have the same variation in low wavelengths (440 and 676 nm) and inverse variation in high wavelengths (871 and 1020 nm). The ASY variations were found from Σ0.64 to Σ0.75 during studied period. Zege et al. [24] and Ali [25] reported that ASY varies from ~0.1 to ~0.75 for very clean conditions to polluted atmospheres in the cloud-free atmosphere. The value of ASY was found to be Σ0.7 for summer (not shown) in the cloud-free atmosphere over Zanjan which indicate it has the polluted atmosphere. The increment of ASY suggests that coarse particles are abundant, whereas the decrease can be caused by the abundance of absorbing aerosol [26].

Figure 8: Spectral variations of a) ASY and AOT; b) SSA and AOT over Zanjan during 2010-2013 for different wavelengths.
The Single-scattering albedo (SSA) values show the abundant of the scattering type of aerosols as compared to the absorbing type of aerosols. Several studies were conducted in aerosols scattering and absorption properties and their impact on climate in recent years [7,27]. The composition of aerosol can largely control the spectral behavior of SSA [28]. For example, for sulfate that is a non-absorptive aerosol, the direct aerosol forcing at the surface and top of the atmosphere is almost the same, but for black carbon that is an absorptive aerosol it reduces the surface insolation. Figure 8b shows SSA and AOT variations during 2010-1013 over Zanjan for different wavelength. SSA increases with increasing wavelength. SSA values are found to be ranging from 0.90 to 0.93 for different wavelength over Zanjan and it has the same values that derived in Paris and Beijing at 440 nm; while, it is less than that derived in Maryland (about 0.96 at 440 nm). This different indicated that urban aerosol models should be created in different urban regions [29]. AOT and SSA have the same variation in high wavelengths (871 and 1020 nm) and the inverse variation in low wavelengths (440 and 676 nm).
Aerosol radiative forcing
Understanding aerosol radiative forcing of climate is important for various reasons, most notably for its crucial role in climate change. Climate forcing is a combination of increasing greenhouse gas concentrations, solar variability, stratospheric volcanic aerosol, and tropospheric aerosol, both natural and anthropogenic. Aerosol forcing cannot be measured directly, there has been an intensive effort to determine what the direct aerosol forcing might be using both observations and models. Alam et al. [30] defined Aerosol Radiative forcing (ARF, in wm-2) as the net imbalance in irradiance (Solar plus long wave) and can be shown as following equation:

Where ΔF is irradiance, the first and second sentences in the right of the equation are the net irradiance with and without aerosol, respectively. Indirectly, these changes effect on specific ARF changes. Figure 9 shows the variation of ARF at earth’s surface (BOA), top of atmosphere (TOA) and AOT at Zanjan during the 2010-2013 periods. The ARF at surface and TOA were found to be ranging from -79 Wm-2 to -10 Wm-2 (average: -33.45 Wm-2) and -25 wm-2 to 6 wm-2 (average: -12.80 Wm-2) at Zanjan, respectively. The difference between ARF at surface and TOA is higher in Jun than other months. Radiative forcing at the BOA is much larger (3 times) than that at the TOA. The deep cooling effect has been occurred on May 2011 due to mineral dust’s effect of reflecting and cooling at the visible wavelengths. However, Dust’s warming counters half of its cooling effect due to absorbing and warming at the longer infrared wavelengths [27]. An increase in AOT would lead to the decrease in radiative forcing (more negative value) at the surface and top of the atmosphere. The negative values of ARF indicate solar radiative cooling effect and positive values of ARF indicate radiative warming effect [31]. Strong correlation between ARF and AOT was calculated -0.92 at 0.05 significant level.

Figure 9: Monthly variation of ARF at earth’s surface (BOA) and the top of atmosphere (TOA) during 2010-2013, over Zanjan.
Conclusion
Aerosol optical depth has been analyzed during the infrequent severe dust storm in February 2015 over the Middle East, using MODIS measurements. The AOD variations show a sharp peak on 11 February 2015 in four dust source regions of Iraq, Syria, Egypt and Saudi Arabia and the maximum AOD values found were 0.8, 1, 1.3 and 0.7, respectively. In Iran, maximum AOD were recorded on the 11th of February over the southwestern regions including Ahvaz and Ilam cities, reaching 1.3 and 1, respectively. The HYSPLIT back trajectory analysis showed that the air masses come from Egypt and Mediterranean Sea and then passed over the south of Turkey and the north of Iraq and ultimately reached to Iran on 01 February 2015. But in the middle February 2015, the air masses reached Iran from Libya, Egyp, Saudi Arabia and Iraq. CALIPSO retrieved aerosol classification showed dust and pollutant dust rise from surface to middle of the troposphere (~5 km) over the studied area.
The long-term temporal variation of AOD in 2000-2015 using MISR data represent an increasing trend in AOD over Ahvaz and Solar Village with maximum values in 2008, 2012 and 2015. Since the dust storms events are more frequent in the summer in Ahvaz and Solar Village regions, what these three years have in common is dust events in winter and early spring.
Aerosol optical properties such as Aerosol Volume Size Distribution (AVSD) ASYmmetry parameter (ASY) and Single Scattering Albedo (SSA) have been analyzed for Zanjan during 2010-2013. The AVSD variations displayed two modes, fine (0.05 μm-0.33 μm in radius) and coarse (0.33 μm-15 μm in radius), over Zanjan during 2010-2013. Significant variations are observed in the coarse mode. The highest values of AVSD in the fine and the coarse modes observed in 0.11 μm and 2.24 μm radius, respectively. Monthly variation of AVSD for particles with radiuses of 0.11 μm and 2.24 μm indicated that the AVSD’s peaks occur in warm months over Zanjan. Decreasing trend in ASY over Zanjan can be seen with increasing wavelengths. ASY and AOT have the same variation in low wavelengths (440 and 676 nm) and inverse variation in high wavelengths (871 and 1020 nm). The value of ASY was found to be Σ0.7 for summer in cloud-free atmosphere over Zanjan which indicate this city has the polluted atmosphere.
Variation of the ASY showed a decreasing trend in the ASY with an increase in the wavelengths. SSA values are found to be ranging from 0.90 to 0.93 for different wavelength over Zanjan and it has the same values that derived in Paris and Beijing at 440 nm; while it is less than that derived in Maryland (about 0.96 at 440 nm). AOT and SSA have the same variation in high wavelengths (871 and 1020 nm) and the inverse variation in low wavelengths (440 and 676 nm).
The ARF at the surface and top of the atmosphere were found to be ranging from -79 wm-2 to -10 Wm-2(average: -33.45 Wm-2) and -25 wm-2 to 6 wm-2 (average: -12.80 Wm-2) over Zanjan, respectively. The difference between ARF at surface and TOA is higher in Jun than other months. Radiative forcing at the BOA is much larger (3 times) than that at the TOA. Strong correlation between ARF and AOT was calculated -0.92 at 0.05 significant level.
Acknowledgement
Analyses and visualizations used in this study were produced with the Giovanni online data system, developed and maintained by the NASA GES DISC.
References
- Ginoux P, Prospero JM, Gill TE, Hsu NC, Zhao M (2012) Global-scale attribution of anthropogenic and natural dust sources and their emission rates based on MODIS Deep Blue aerosol products. Rev Geophys 50: RG3005.
- Alpert P, Kishcha, P, Shtivelman A, Krichak SO, Joseph JH (2004) Vertical distribution of Saharan dust based on 2.5 year model predictions. Atmos Res 70: 109-130.
- Singh RP, Prasad AK, Kayetha VK, Kafatos M (2008) Enhancement of oceanic parameters associated with dust storms using satellite data. J Geophys Res, p: 113.
- Kaufman YJ, Tanre D, Remer LA, Vermote EF, Chu A, et al. (1997) Operational remote sensing of tropospheric aerosol over land from EOS moderate resolution imaging spectroradiometer. J Geophys Res 102: 17051-17067.
- Prospero JM, Ginoux P, Torres O, Nicholson SE, Gill TE (2002) Environmental characterization global sources of atmospheric soil dust identified with the Nimbus 7 total ozone mapping spectrometer (TOMS) absorbing aerosol product. Rev Geophys 40: 1002.
- Miller RL, Tegen I, Perlwitz J (2004) Surface radiative forcing by soil dust aerosols and the hydrologic cycle. J Geophys Res 109: D04203.
- Masoumi A, Khalesifard HR, Bayat A, Moradhaseli R (2013) Retrieval of aerosol optical and physical properties from ground-based measurements for Zanjan, a city in Northwest Iran. Atmos Res 120-121: 343-355.
- Khoshsima M, Bidokhti AA, Ahmadi-Givi F (2014) Variations of aerosol optical depth and Angstrom parameters at a suburban location in Iran during 2009–2010. J Earth Syst Sci 123: 187-199.
- Gharibzadeh M, Alam Kh, Bidokhti AA, Abedini Y, Masoumi A (2016) Radiative effects and optical properties of aerosol during two dust events in 2013 over Zanjan, Iran. Aerosol Air Qual Res 17.
- Hamidi M, Kavianpour MR, Shao Y (2013) Synoptic analysis of dust storms in the Middle East, Asia-Pacific. J Atmos Sci 49: 279-286.
- Notaro M, Yu Y, Kalashnikova OV (2015) Regime shift in Arabian dust activity, triggered by persistent Fertile Crescent drought. J Geophys Res Atmos 120: 10229-10249.
- Huneeus N (2011) Global dust model intercomparison in AeroCom phase I. Atmos Chem Phys 11: 7781-7816.
- Holben BN, Eck TF, Slutsker I, Tanre D, Buis JP, et al. (1998) AERONET – A federated instrument network and data archive for aerosol characterization. Remote Sensing Environ 66: 1-16.
- Diner DJ, Beckert JC, Reilly TH, Bruegge CJ, Conel JE, et al. (1998) Multi-angle imaging spectroradiometer (MISR) instrument description and experiment overview, IEEE. Trans Geosci Remote Sens 36: 1072-108.
- Hunt WH, Winker DM, Vaughan MA, Powell KA, Lucker P L, et al. (2009) CALIPSO lidar description and performance assessment. J Atmos Oceanic Technol 26: 1214-1228.
- Winker D M, Pelon J, McCormick M P (2003) The CALIPSO mission: Space borne Lidar for observation of aerosols and clouds. Proceedings of SPIE 4893: 1-11.
- El-Baz F, Makharita R M (1994) The gulf war and the environment. Gordon and Breach Scientific Publishers, SA, Lausanne, Switzerland, p: 206.
- Omar AH, Winker D, Kittaka C, Vaughan M, Liu Z, et al. (2009) The CALIPSO automated aerosol classification and Lidar ratio selection algorithm. J Atmos Oceanic Technol 26: 1994-2014.
- Alam K, Trautmann T, Blaschke T, Subhan F (2014) Changes in aerosol optical properties due to dust storms in the Middle East and Southwest Asia. Remote Sens Environ 143: 216-227.
- Kahn RA, Gaitley B J, Garay M J, Diner D J, Eck T, et al. (2010). Multi-angle Imaging spectroradiometer global aerosol product assessment by comparison with the aerosol robotic network. J Geophys Res 115: D23209.
- Jiang X, Liu Y, Yu B, Jiang M (2007) Comparison of MISR aerosol optical thickness with AERONET measurements in Beijing metropolitan area. Remote Sens Environ 107: 45–53.
- Christopher SA, Wang J (2004) Intercomparison between MISR and sunphotometer AOT in dust source regions over china: Implication for satellite retrievals and radiative forcing calculations. Tellus 56: 451-456.
- Sumit K, Devara PCS, Manoj MG (2012) Multisite characterization of tropical aerosols: Implications for regional radiative forcing. Atmos Res 106: 71-85.
- Zege EP, Ivanov AP, Katzev IL (1991) Image transfer through a scattering medium. Springer Berlin, New York, p: 349.
- Ali M, Tariq S, Mahmood K, Daud A, Batool A, et al. (2014) A study of aerosol properties over Lahore (Pakistan) by using AERONET data. Asia Pac J Atmos Sci 50: 153-162.
- Alam K, Trautmann T, Blaschke T (2012) Aerosol optical and radiative properties during summer and winter seasons over Lahore and Karachi. Atmos Environ 50: 234-245.
- Hansen J, Sato M, Ruedy R (1997) Radiative forcing and climate response. J Geophys Res 102: 6831-6864.
- Srivastava AK, Soni VK, Singh S, Kanawade VP, Singh N, et al. (2014) An early South Asian dust storm during March (2012) and its impacts on Indian Himalayan foothills: A case study. Sci Total Environ 493: 526-534.
- Xia XA, Chen HB, Wang PC, Zhang WX, Goloub P, et al. (2006) Variation of column-integrated aerosol properties in a Chinese urban region. J Geophys Res, p: 111.
- Alam K, Sahar N, Yaseen I (2013) Aerosol characteristics and radiative forcing during pre-monsoon and post-monsoon seasons in an urban environment. AAQR.
- Hatzianastassiou N, Matsoukas C, Drakakis E, Stackhouse Jr PW, Koepke P, et al. (2007) The direct effect of aerosols on solar radiation based on satellite observations, reanalysis datasets and spectral aerosol optical properties from Global Aerosol Data Set (GADS). Atmos Chem Phys 7.
Relevant Topics
Recommended Journals
Article Tools
Article Usage
- Total views: 3275
- [From(publication date):
July-2017 - Sep 02, 2025] - Breakdown by view type
- HTML page views : 2342
- PDF downloads : 933