Solar Cycle Variability and Global Climate Change
Received: 25-Mar-2019 / Accepted Date: 24-Apr-2019 / Published Date: 29-Apr-2019
Abstract
The correlation between solar cycle variability and the global climate change has become an interesting area of scientific research. Speculations on the role of changes in the sun and their influence on global climate have been ongoing for centuries. Over the past few hundred years, there has been an increase in the number of sun spots and during that period the earth has been getting warmer. Past studies show a strong correlation between solar variability and surface-air temperature of the earth. Data suggest that solar variability affects the terrestrial climate on time- scales of minutes to millions of years. In this paper, an attempt has been made to identify the role of sunspot numbers on the possible solar-influence on global climate.
Keywords: Solar cycle variability; Sun-spots; Terrestrial-climate; Time-scale; Global climate; Total Solar Irradiance (TSI)
Introduction
Global climate is changing. Empirical evidences show that the last decade of the 20th century and the beginning of the 21st century have been the warmest period in the entire instrumental temperature record, starting in the mid- 19th century. The warming is consistent with the global retreat of mountain glaciers, reduction in snow- cover extent and thinning of Artic sea-ice [1]. It has long been speculated that long term solar output variations over the 11- year cycle associated with the sunspots influence terrestrial climate. Many theories of climate change have been advanced, involving forces from volcanic to solar variations. It has been reported that there probably are some connections between changes on the sun and their influence on terrestrial climate. Cromie [2], a noted supporter of the solar variation theory, pointed out that the sun could account for major climate changes on the earth for the past 300 years, including part of the recent surge of global warming. There is a growing substantial evidence for the sun's role in climate change on multiple time scales including the 11-year cycle [3-6]. Climate studies have led to the opinion that the sun spot cycle variation of 01% has a small but detectable effect on the terrestrial climate [4]. Solanki et al. [5] argued that solar effects might have contributed to the rise in surface temperature in the 1st half of the 20th century but there is no evidence for significant warming in the 2nd half of the 20th century. Analysing the correlation between solar trends and global warming, Schmidt et al. [6] proposed that contribution from solar forcing is negligible for climate change since 1980. So, we have conflicting points of view and studies on whether solar variability can generate climate change? In recent times, investigators have claimed that the variability of the sun has had a significant impact on global climate. In fact, climate community, in general has been viewing the relation between the sun and the climate change with suspicion. It is only after 1980s that with the advancement of knowledge, this problem of causal link between the activity of the sun and its irradiance has become quite interesting. In this paper, we have attempted to present a review of climate change with 11- year solar cycle variability.
Climate change
Climate change is a normal part of the earth’s natural variability which is related to the interactions among the atmosphere, ocean, and land, as well as changes in the amount of solar radiation reaching the earth. So, any factor that alters the earth's radiation balance, can affect the global climate. It is to be noted that climate change is a significant and lasting change in the statistical distribution of weather patterns over the periods ranging from decades to millions of years [7]. Therefore, the study of climate change is of fundamental importance not only in the field of paleoclimatology, but also for predicting the earth's climate. In the following sections, we have limited our discussion on the possible influence of solar variability on the global climate.
Solar variability
Solar variability refers to the changes in the levels of solar radiation as well as in the number and size of sunspots with 11- year cyclic variation. So, it is likely to affect climate on time scales of minutes to millions of years. It is often believed that only slow variations can affect the climate. This view can be accepted with cautious because the rate of occurrence of fast transients such as solar flares get modulated in time [8]. Therefore, it is imperative to take into account the long-term solar variations while dealing with this problem of solar- climate connection, because all time scales eventually matter.
Let us first elaborate some key parameters associated with solar variability which play important roles in modulating global temperature. These are namely: total solar irradiance, sun spot number, radio flux at 10.7 cm and intensity of magnetic field in the solar wind etc.
Total Solar Irradiance (TSI): It represents the total radiated power measured at 1AU above the atmosphere. This quantity summarizes the total radiative energy input to the earth.
ISN: The international sunspot number, one of the most ancient gauges of solar activity.
Radio flux at 10.7 cm: The radio flux radiated at 10.7 cm has no direct impact on climate, but it is widely used in global Circulation Models as a proxy for solar activity. It is measured daily since 1947.
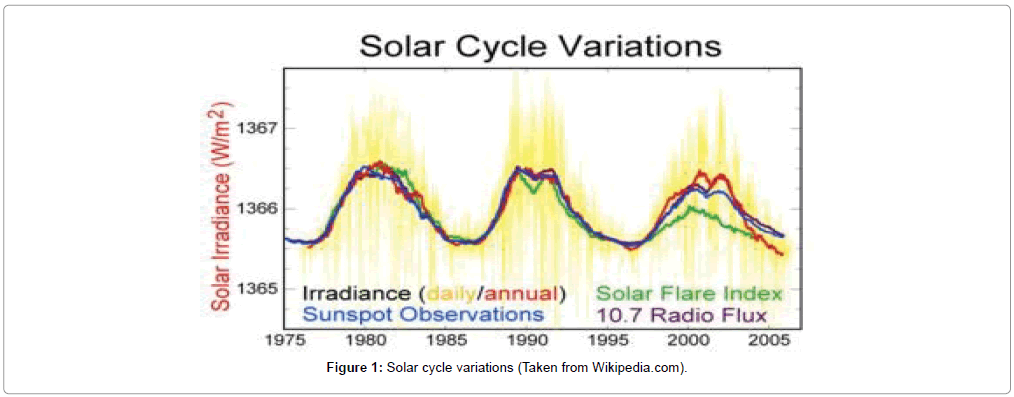
From the patterns of irradiance variation with sunspots as depicted in the Figure 1, it can be deduced that solar cycle variations can generate climate change.
Overview of Connection Between Solar Variability and Global Climate Change
Solar cycle is probably the best documented manifestation of solar activity on our terrestrial environment. A large variety of atmospheric records have testified the significant role of solar cycle in influencing the terrestrial climate.
To start with, from 1610 onwards, astronomers were turning their instruments towards the sun and were describing and counting sunspots. Herschel [9], an important pioneer in the field of solar- terrestrial physics, attempted to correlate the presence of sunspots with the price of wheat in England which was ultimately linked to climate variability.
By the end of the 19th century there was a long enough record of sun- spot numbers to infer periodic cycles in the sun’s activity. The solar cycle’s physical basis was elucidated by Hale and collaborators, who in 1908 showed that sun-spots were strongly magnetized. Because the solar cycle reflects magnetic activity, various magnetically solar phenomena follow. These are namely:
(i) Sun-spots;
(ii) Coronel mass ejection and,
(iii) The patterns. But, the appearance of sun- spots and how they alter terrestrial-climate, is quite interesting for academic point of view.
Charles G. Abbot [10] observed that TSI variations are connected with sun-spots passing across the face of the sun. It was generally believed that sun-spot variations might have been the main cause of climate change. It was supported by Eddy [11] who hypothesized that an apparent relationship between long- term variations in solar activity and global climate change might be due to changes in the solar irradiance.
With the launching of Nimbus-7 satellite in 1978, data collections and its scientific analysis got accelerated. Hickey et al. [12] investigated further in this direction and provided evidence of variations in total solar irradiance. Observations made by an Active Cavity Radiometer further provided evidence that the passage of sun- spots and faculae across the sun’s disk influence total solar irradiance. There is increasing reliable evidence of its influence on atmospheric temperature and circulations, particularly in the higher atmosphere [13]. Satellite data have been used in combination with the recorded sunspot number to estimate the solar radiation. It has been suggested that changes in solar radiation could cause surface temperature change of 0.1°C [14].
It is to be noted that solar activity has varied on recent time scales. Evidence for these fluctuations is provided by the variation in the number of sunspots which is following an 11-year cycle. At the maximum of 11- year solar activity cycle, the TSI is larger by about 0.1% than at the minimum. Paradoxically, the irradiance increases with the number of sunspots. This is due to the fact that while the spots darken the sun's surface, its effect is overcompensated by the faculae [15].
Telescopic observations of sun- spots suggest that in addition to the roughly 11- year solar cycle, the number of sun- spots fluctuate on longer time-scales. Lassen et al. [16] pointed out that the sunspot number during 1861-1889 shows a remarkable parallelism with the simultaneous variation in northern hemisphere mean temperature.
It has been proposed that part of the global warming of about 0.8°C since mid-19th century can be related to a slow increase in solar irradiation from 1750°C to the present day. According to Wilson [17], solar irradiance also appears to have increased over the past two decades. However, this trend is currently weakly constrained and subject to debate. The three-dimensional modeling studies further supported the connection between solar cycle variability and the change in surface- air temperature of the earth. Underestimation of solar effects on climate has been due to inclusion of Ozone and exclusion of the Ocean UV heating in the modeling studies [18]. It has been reported that irradiance variations are not spectrally homogenous and the amlitude of the UV variability is, in relative terms, an order of magnitude larger than the variability of the total solar irradiance [19]. Modeling studies indicate that heating of the stratosphere through absorption of the excess UV radiation by ozone amplifies the global average warming due to the increase in irradiance by about 15% to 20% [20]. At times of high solar activity, the appearance of more sun- spots delivers more energy to the atmosphere so that global temperature should increase. It is supposed that intense solar radiations which get transferred to the lower atmosphere through dynamical processes, may modulate the troposphere temperature leading to climate change.
Solar Modulation of Global Climate during the Period 1880-2010
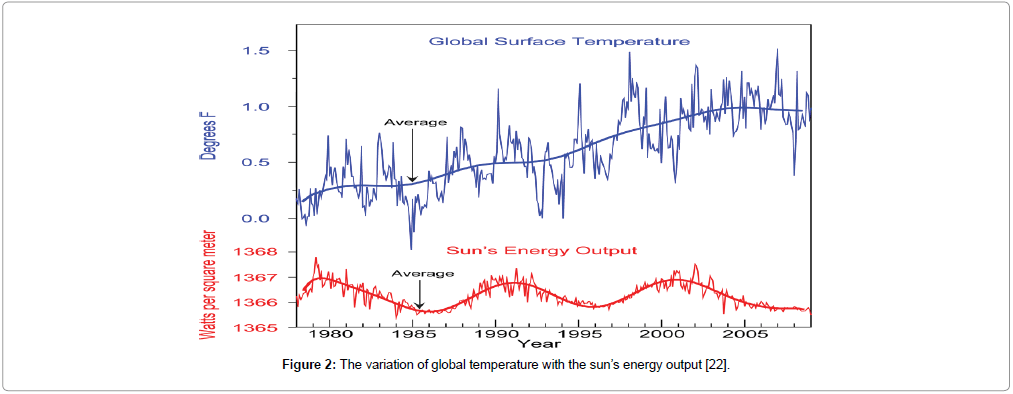
The sun is the ultimate source of energy which drives the terrestrial climate. It is an established fact that the sun exhibits variability in its output. The solar cycle variation in irradiance corresponds to an 11- year cycle in radiative forcing which varies by about 0.2 W/m2. In the Figure 2, red curve shows irradiance variation of 0.2 W/m2 while green curve indicates global surface temperature. We observe that after 2000, there is an inverse relationship between solar energy output and change in global temperature. We can argue for some other factors playing the hidden role of warming the earth.
Figure 2: The variation of global temperature with the sun’s energy output [22].
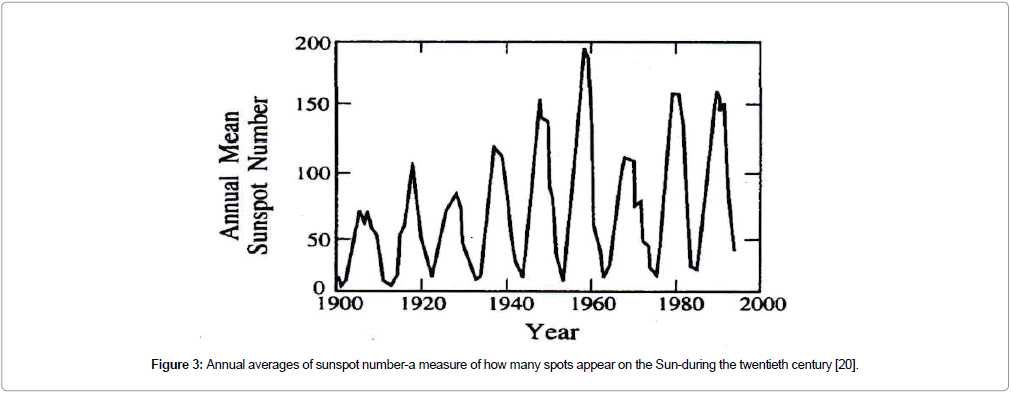
It is important to mention here that changes in sun's energy output occur primarily as a result of two phenomena that alter the surface brightness and modulate the outward flow of energy. These are the dark spots (sun spots) and the faculae. The number of sunspots at the peak of the sunspot cycles has been increasing over the last 100 years [21]. It is noticed that the sun spot number increases from 1920 to 1960, then decreases from 1960 to 1980 and followed by a rise in its number between 1980 to 1990 as depicted in Figure 3.
Figure 3: Annual averages of sunspot number-a measure of how many spots appear on the Sun-during the twentieth century [20].
Sun spot number
Extensive research has been done and still is being done to correlate solar variability to global climate change and to determine the extent to which climate change is occurring. In this section, we provide a brief account on the role of sun spot numbers for the identification of a possible solar influence on global climate [22].
Varying solar activity from cycle to cycle has significant impact on the evolution of the earth's climate. The sun spot number is the oldest solar index measuring the solar activity. It is important to note here that the long- term behavior of solar activity has attracted the attention of the climate researchers to address the problem in proper perspective. For a long time, it was the only index representative of the solar cycle. Many studies on the cyclic behavior of the sun have made use of the sun spot number [23] (Table 1). We infer that short as well as long term solar variations do play an important role in modulating terrestrial climate.
| Decade | 1880s | 1890s | 1900s | 1910s | 1920s | 1930s | 1940s | 1950s | 1960s | 1970s | 1980s | 1990s | 2000s |
|---|---|---|---|---|---|---|---|---|---|---|---|---|---|
| Average SunSpot Number |
59.67 | 65.74 | 42.30 | 49.09 | 75.04 | 65.62 | 99.55 | 109.58 | 132.25 | 96.49 | 116.11 | 105.7 | 98.34 |
Table 1: Mean annual sun spot number average per decade [24].
Global mean temperature
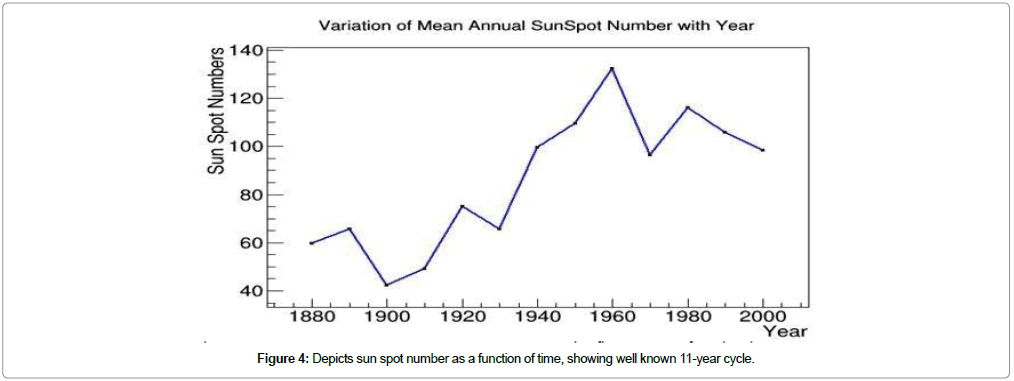
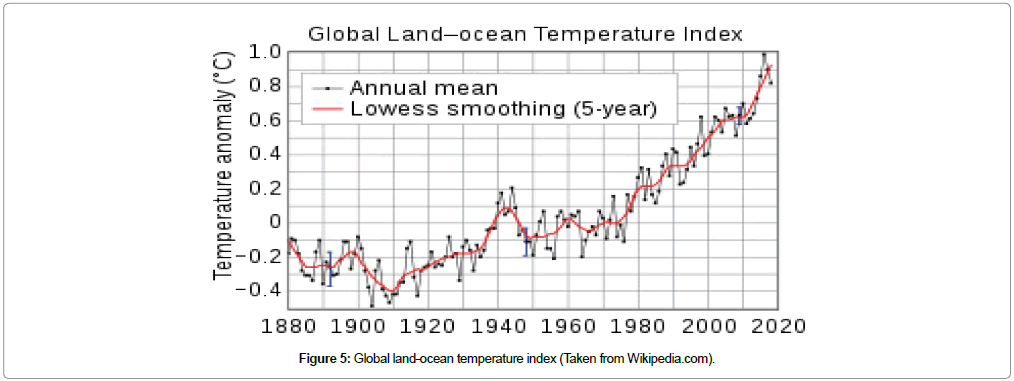
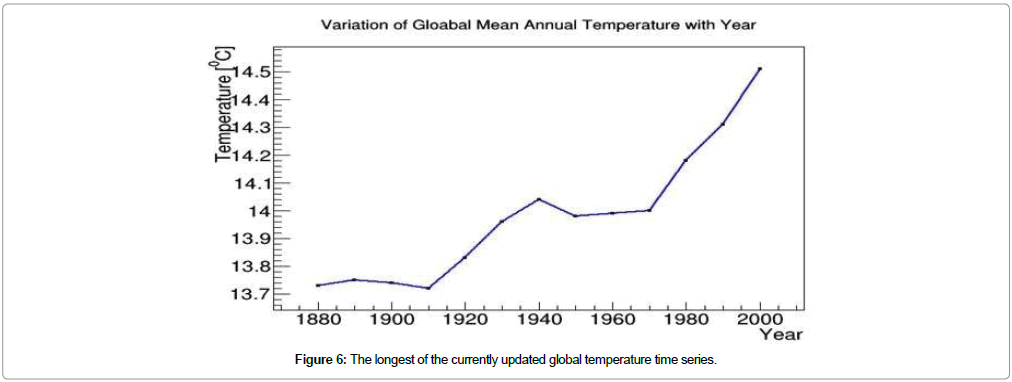
An important feature of the surface temperature record of the last century is that the temperature has risen by about 0.8°C. We can see the change in the mean global temperature that has been calculated for each year since 1880 as shown in the Figures 4 and 5. The records clearly show that the first decade of the 21st century was the warmest since 1880s. From my plot (6) it is apparent that in the first decade of 21st century, the earth's annual temperature has risen above 14.5°C. We observe an increase of temperature by 1°C which is in agreement with plot shown in the Figure 5 and Table 2.
| Decade | 1880s | 1890s | 1900s | 1910s | 1920s | 1930s | 1940s | 1950s | 1960s | 1970s | 1980s | 1990s | 2000s |
|---|---|---|---|---|---|---|---|---|---|---|---|---|---|
| Temperature (°C) |
13.73 | 13.75 | 13.74 | 13.72 | 13.83 | 13.96 | 14.04 | 13.98 | 13.99 | 14.00 | 14.18 | 14.31 | 14.51 |
Table 2: Global mean annual temperature average per decade. The temperature data are provided by the NASA's Goddard Institute for Space Studies (GISS) [25].
Discussion
We have attempted to correlate the sun spot variation to the climate change. We observe that sun spot variation matches the change in temperature during the period 1910 to 1940, Figures 4 and 6. But there is a mismatch between the two factors after 1980 onwards. Temperature increases sharply but sun spot number decreases. This anamoly has to be addressed carefully.
We contemplate that besides the solar variations, there might be some other factors which can account for the said discrepancy. It is supposed that an indirect effect of solar activity might be responsible for warming of the last few decades. In fact, Svensmark and colleagues have hinted on the possible influence of cosmic radiation on cloud formation [24-26]. A wide range of finger prints studies conducted over the past 100 years is that observed changes in temperature cannot be explained by the natural factors alone. There is evidence to suggest that human- induced changes in the atmospheric composition play a significant role in modulating the climate change.
Conclusion
From the perusal of the facts elaborated in this manuscript, we have the observation that global warming is overtaking solar role. Nevertheless, there is always a room for individual discussion of solar role on global climate. More research to investigate the effects of solar behavior on climate is needed. Only then one can state the magnitude of solar effects on climate with certainty. It would be unrealistic to infer on the basis of limited data that sunspot variation significantly affects global climate. We require more and better data to substantiate the hypothesis that solar changes contribute to the significant climatic change. Thus, we see that the impact of solar variation on global climate is highly complex. This study needs further review.
References
- Boer GJ, Yu B (2003) Climate sensitivity and response. Climate Dyn 20: 415- 429.
- William CJ (1997) Brightening sun is warming earth- May account for major part of the global warming. Harvard University Gazette.
- Lean JL, Wang YM, Shelley NR (2002) The effects of increasing solar activity on magnetic flux during multiplecycles: Implications for solar forcing of climate. Geophys Res Lett 29: 77-84
- Labitzke K, Matthews K (2003) Eleven-year solar cycle variations in the atmosphere, mechanisms and models. Holocene 13: 11-17.
- Solanki SK, Usoskin IG, Kromer B, Schussler M, Beer J (2004) Unusual activity of the sun during recent decades compared to the previous 11,000 years. Nature 431: 1084-1087.
- Benestad RE, Schmidt GA (2009) Solar trends and global warming. J Geophys Res Atmos 114: 1-18.
- Seinfeld JH, Pandis SN (1998) Atmospheric chemistry and physics: From air-pollution to climate change, (2nd edn) pp: 88-90.
- Â De Wit TD, Watermann J (2010) Solar forcing of the terrestrial atmosphere. Comptes Rendus Geoscience. 342: 259-272.
- Herschel FW (1801) observations tending to investigate the nature of the sun, in order to find the causes or symptoms of it's variable emission of light and heat, with remarks on the use that may possibly be drawn from solar observations, Philosophy. Trans R Soc Lond 91: 265-318.
- Abbot CG (1910) The Solar Constant of radiation. Proceedings of the American Philosophical Society. 50: 235-245.
- Eddy JA (1976) The Maunder Minimum, real anomaly in the behaviour of the sun. Science 192: 1189- 1206.
- Hickey JR, Stowe LL, Jacobowitz H, Pellegrino P, Maschhoff RH, et al (1980) Initial solar irradiance determination from Nimbus-7 cavity radiometer measurements. Science. 208: 281-283.
- Balachandran NK, Rind D (1995) Modeling the effects of UV variability and the QBO on the troposphere- stratosphere system. J Clim.8: 2058 - 2079.
- Cubasch U, Voss R (2000) The influence of total solar irradiance on climate Space Science. Research. 94: 185-198.
- Lassen K, Friis CE (1995) Variability of the solar cycle length during the past five centuries and the apparent association with terrestrial climate. J Atmos Terr Phys 57: 835-845.
- Wilson RC (1997) solar irradiance trend during solar cycles 21 and 22. Science 277: 1963-1965.
- Wilson RC, Mordvinov AV (2003) secular total irradiance trend during solar cycles 21- 23. Geophys Res Lett 30: 1-4.
- Lean J (2005) Living with a variable sun, Physics Today 6, The solar cycle variation in irradiance corresponds to an 11-year cycle in radiative forcing which varies by about 0.2 W/m2. There is increasing reliable evidence of its influence on atmospheric temperature and circulations, particularly in the higher atmosphere (12). Satellite data have been used in combination with the recorded Sunspot number to estimate the solar radiation. It has been suggested that changes in solar radiation could cause surface temperature change of 0.1-degree celcius 13: 32-38.
- Palmer MA, Garry LJ, Allen MR, Norton WA (2006) Solar forcing of the climate model results. Adv Space Res 34: 343-348.
- Haigh D (2012) The Sun and the Earth’s climate. Living review in Solar Physics.
- Berghmans D, Clette F, Cugnon P, Gabryl JR, Hochedez JF, et al. (2002) The solar influences data analysis centre. J Atmos Sol Terr Phys 64: 757-761.
- https://www.currentresults.com/Environment-Facts/changes-in-earth-temperature.php
- Svensmark HE, Friis C (1997) Variation of cosmic ray flux and global cloud coverage-A missing link in solar- climate relationships. J Atmos Sol Terr Phys 59: 1225-1232.
Citation: Kumar P, Singh DP (2019) Solar Cycle Variability and Global Climate Change. J Earth Sci Clim Change 10:514.
Copyright: © 2019 Kumar P, et al. This is an open-access article distributed under the terms of the Creative Commons Attribution License, which permits unrestricted use, distribution, and reproduction in any medium, provided the original author and source are credited.
Select your language of interest to view the total content in your interested language
Share This Article
Recommended Journals
Open Access Journals
Article Usage
- Total views: 17420
- [From(publication date): 0-2019 - Dec 02, 2025]
- Breakdown by view type
- HTML page views: 16201
- PDF downloads: 1219

