Spatial Variability of Malnutrition and Predictions Based on Climate Change and Other Causal Factors: A Case Study of North Rift ASAL Counties of Kenya
Received: 18-Sep-2017 / Accepted Date: 18-Oct-2017 / Published Date: 24-Oct-2017 DOI: 10.4172/2157-7617.1000416
Abstract
Malnutrition refers to deficiencies, excesses or imbalances in a person’s intake of energy and/or nutrients. The burden of childhood malnutrition in developing countries continues to rise posing significant obstacle to achievement of better child health interventions. Several factors are involved in causation of malnutrition with Arid and Semi-Arid lands greatly affected as a result of erratic weather patterns, droughts, conflicts, poor access to health services and food among others. This study aims at investigating the risk factors for child malnutrition in North Rift Arid and semi-Arid lands (ASAL) counties of Kenya based on the 2014 Demographic and Health survey (DHS) data.
The main objective of the study was to determine and model various causal factors of malnutrition in ASAL areas of North Rift Kenya. Specifically (i) to determine the predictors of child malnutrition in the North Rift arid and semi-arid lands (ASAL) counties of Kenya (ii) to determine the level of influence of risk factors and (iii) Assess vulnerability to malnutrition using the DHS data and other causal Factors.
Secondary analysis of 2014 Kenya Demographic and health survey data was conducted for the study area comprising of 2,278 children living in 151 clusters. The percentage of malnourished children in each cluster was computed based on the anthropometric z scores. Independent variables were various household level and environmental factors extracted at cluster level. Predictors of malnutrition were analysed using spatial lag model taking into account the spatial dependence in the datasets.
Results obtained show significant predictors to be temperature, place of delivery, Enhanced Vegetation Index (EVI), poverty index, Illiteracy and drinking sources of water with strongest association observed between malnutrition and Temperature. A 1-unit increase in temperature was associated with 31% increase in malnutrition. Most constituencies in Turkana County are highly vulnerable to malnutrition based on factors significantly associated with malnutrition in ASAL Areas with Turkana North, central & South Constituencies most vulnerable. Areas of Samburu North bordering Turkana East constituency are also vulnerable and Eastern parts of Samburu East constituency. Most parts of Baringo, West pokot, Western parts of Turkana County and Laikipia counties recorded low to medium vulnerability.
Temperature variation, EVI were observed to be likely drivers of malnutrition in ASAL areas. Spatial modelling of these factors better informs on specific areas to be targeted in nutrition based programmes.
Keywords: Malnutrition; Vulnerability; Spatial modelling; EVI; ASAL
Introduction
Maternal and child undernutrition is the cause of 3.5 million deaths annually [1]. Malnutrition remains one of the most common causes of morbidity and mortality among children throughout the world. Worldwide, over 10 million children under the age of 5 years die every year from preventable and treatable illnesses despite effective health interventions. At least half of these deaths are caused by malnutrition. Malnourished children have lowered resistance to infection; therefore, they are more likely to die from common childhood ailments such as diarrheal diseases and respiratory infections [2].
In addition, malnourished children that survive are likely to suffer from frequent illness, which adversely affects their nutritional status and locks them into a vicious cycle of recurring sickness, faltering growth and diminished learning ability. In developing countries, malnutrition is a major health problem [3].
Children are most vulnerable to malnutrition in developing countries because of low dietary intakes, disease and inequitable distribution of food within the household [4]. Low dietary intakes stem from food insecurity, poor maternal and child care practices, poor sanitation or poor access to health care services [5].
About 88% of total land area of Kenya comprise of the Arid and semi-arid lands [6]. Efforts in curbing malnutrition has enabled undernutrition to improve in the rest of the country, but trends in ASAL areas remain negative [7]. ASAL population consists of a range of agricultural and pastoral types. Most agro-pastoralists depend on rainfed agriculture which has been tended to be limited due to erratic rains and poor soils as well as socio-economic considerations including poor transport facilities and limited capital. Production and access to food in these areas therefore has been difficult [8].
Stumpy human development and high levels of poverty, which increase vulnerability in the Kenya’s ASALs, mean climate shocks and stresses, especially drought, normally have greater consequences in these areas such as acute food shortages. This study aims at investigating both household level factors and climatic factors and their contribution to malnutrition in ASAL areas. Various scientific studies carried out have ignored the local spatial variability of climatic factors in assessing malnutrition.
Climate change affects various dimensions of malnutrition ranging from incidences of disease occurrence. A study carried out by Alexander et al. [9] observed that changes in climate leading to temperature increase and decrease in precipitation led to increase in diarrhea disease incidence in Botswana.
Changes in climate impact the overall productivity and environmental services detrimental to food security [10]. Changes in climate also affect environmental health and environmental resources decreasing the accessibility to health care and food services. Most ASAL areas of kenya practice pastoralism associated to frequent migration in search of food and shelter for livestock futher complicating the accessibility to food and health services [11]. These areas are characterized by limited resources, low income among the inhabitants, drought, low level of social and human capital, conflicts among others. Those who suffer most in efforts to address undernutrition women who are regarded as the primary care givers and children [12].
Materials and Methods
Kenya is classified into Arid, Semi-arid and Non- arid/semi- Arid lands. The ASAL accommodates nearly 30 per cent of the entire country’s population. The major economic activity carried out in these areas includes pastoralism and small-scale farming [13]. This study focuses on 5 counties located in the Northern part of the Rift valley of Kenya. These counties are estimated to have a population of 2,546,824 and cover a geographic area of approximately 6,462 km2 [14].
These counties recorded high prevalence of malnutrition. Percentage of underweight and stunted children was high in all the counties [15]. Percentage of malnourished children was computed for each cluster. Cluster was used as a unit of analysis as the geographical locations of the clusters were recorded during the survey process. Emergency nutrition assessment program application was used to convert nutritional data into Z score indices based on the NCHS reference population standard of WHO in 2011.
A spatial regression model was adopted in determining factors that are significantly associated to malnutrition in the study area. This was to enable accurate modelling and assessment of vulnerability to malnutrition considering social, economic and environmental variables [16]. Spatial lag model was used to analyse the predictors of malnutrition among children under the age of 5 years and was implemented in R statistical software. Spatial regression models assume that the spatial dependence can be described by known Weights [17].
Geographical phenomena, for example disease prevalence and demographic distribution exhibit variations across space with close objects experiencing similarity compared to distant ones [18]. Analysis must account for these variations. Spatial regression model involves; choosing a neighborhood criterion, creating spatial weight matrix, examining spatial autocorrelation, applying weights matrix and predicting using the spatial regression model. Spatial lag model was used in this study as it yielded a low Akaike information criterion value of 1318.2 as compared to spatial error model which yielded Akaike information criterion value of 1320.2.
Processing framework
Research methodology involved three steps. The first step was Extraction of the independent variables at cluster level. This includes the socioeconomic variables, environmental variables, and child and mother variables. The input variables include sex of the child, marital Status of the mother, preceding Birth Interval in the household, place of delivery of the child, polio vaccination status, measles vaccination status, whether the child experienced diarrhea recently, whether the child was given vitamin A in the last 6 months, age of the child in months, Mother’s education level, number of children under 5 in the household, mother occupation, source of drinking water, time to get to water source, type of toilet facility in the household, number of household members, wealth index of the household, whether the family has bednet, rainfall, temperature, EVI and place of residence.
The predictors used for the study was based on previous studies on malnutrition. In analyzing effect of climate change and crop production on child under nutrition, Hagos et al. [19] concluded climatic factors as playing a role of partly predicting variation in stunting and underweight in Ethiopia. Inclusion of indicators for reproductive maternal and child health interventions is prerequisite in assessing malnutrition rates [20].
Several studies have shown that child malnutrition is closely linked to economic factors in the household. Household characteristics including family size, poverty levels, and sources of drinking water have been explored in analysis and found to be significant predictors for child malnutrition [21]. Other studies have highlighted the importance of household sanitary facilities and pre-natal maternal nutritional status as increasing the prevalence of malnutrition [22].
The second step involved extraction of variables at a cluster level. The datasets were prepared and derived into a csv spreadsheet format for analysis in R statistical package. The final step carried out was the selection of factors associated with malnutrition among those extracted from KDHS data and climatic variables derived from Fews Net and Land processes distributed archive center (Figures 1-4).
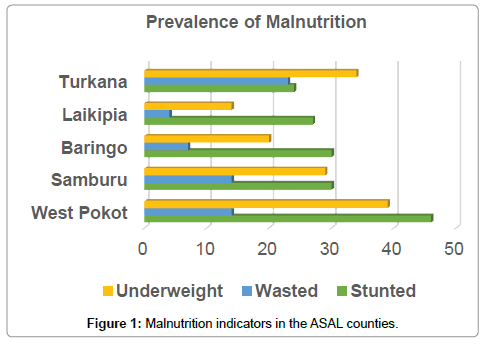
Figure 1: Malnutrition indicators in the ASAL counties.
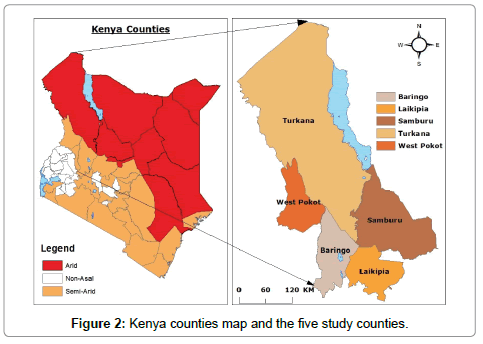
Figure 2: Kenya counties map and the five study counties.
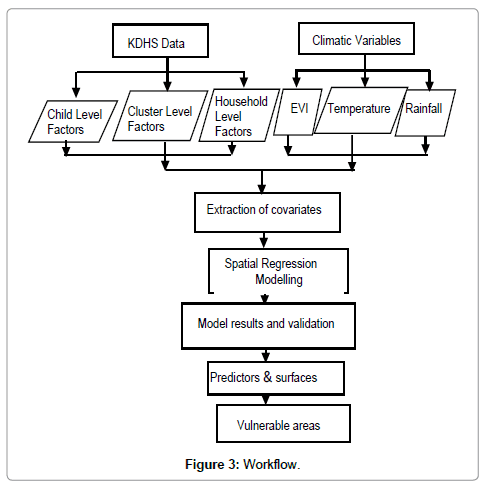
Figure 3: Workflow.
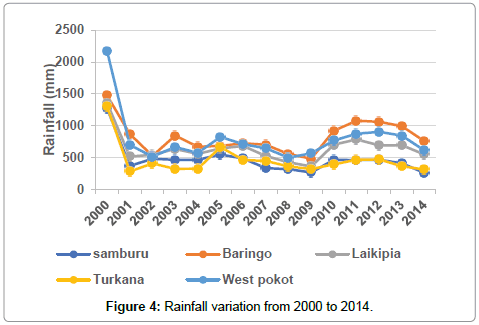
Figure 4: Rainfall variation from 2000 to 2014.
A spatial regression model was implemented in R using “spdep” package [23]. Spatial lag model incorporates spatial effects by including a spatially lagged dependent variable as an additional predictor.
Model validation
The spatial lag model yielded an Akaike criterion value of 1382.2 and R square at 72%. The adjusted coefficient of determination was 72%. The predictive R squared was 71.8%. The coefficient parameter (Rho) had a positive effect and was highly significant reflecting spatial dependence in the datasets.
Results
This part presents the findings of this research. First the trends in the environmental factor, spatial regression model results and areas vulnerability to malnutrition.
Rainfall
The rainfall patterns in the area depict increased rainfall amounts between 2000 and 2002. However, the total rainfall remained relatively low from 2001 to 2008 followed by gradual increase in 2009 upto 2012 where rainfall began to decrease again.
Temperature
Figure 5 shows the temporal changes of the mean annual temperature in each of the counties under study. Turkana County had the highest average temperature while Laikipia and Westpokot had low temperatures throughout the period. However uniform increase in temperature of up to 1°C is experienced between 2004-2005 and 2007- 2009. Year 2009 was the hottest in all the counties under study.
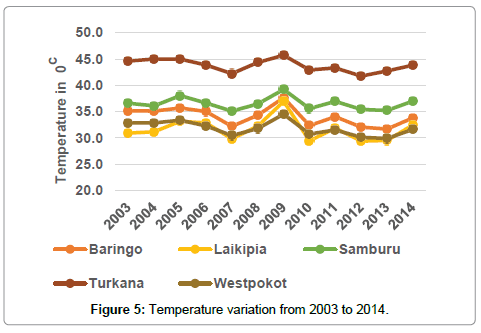
Figure 5: Temperature variation from 2003 to 2014.
Enhanced vegetation index
High average EVI values were recorded in all counties in 2007 and 2010 with lowest values recorded in 2009, the trend in EVI across all the counties were similar for the entire period. Vegetation indices are important tools in the monitoring, mapping, and resource management of the Earth's terrestrial vegetation. They are radiometric measures of the amount, structure, and condition of vegetation which serve as useful indicators of seasonal and inter-annual variations in vegetation [24].
Spatial regression model results
The Table 1 below gives summary of the factors found to be significantly associated with malnutrition. P-value for each term tests the null hypothesis and provides a basis for rejection or acceptance of the null hypothesis [25]. A certain threshold should be achieved to ascertain the association between the dependent and independent variable in regression analysis [26]. It was found that EVI, poverty index, source of drinking water, literacy, place of delivery and temperature were found to be strongly associated with malnutrition.
| Variables | Estimates | P-value |
|---|---|---|
| Intercept | 23.25 | 0.02 |
| EVI | -14.88 | 0.02 |
| Poverty Index | 0.14 | 0.01 |
| Drinking water | -0.11 | 0.01 |
| Literacy | 0.12 | 0.01 |
| Place of delivery Ref Home | 0.31 | 0.01 |
| Temperature | 0.34 | 0.05 |
Table 1: Spatial regression model estimates among children of age at least 5 years preceding the survey in North Rift Asal counties.
Strong observation was observed between temperature and place of delivery. Ill health being one of the factors causing child malnutrition, it is believed that the disease carrying vectors thrive is a range of temperatures and this could be a possible reason for the observed association [27].
It was also found that children delivered at a health facility have lower probability of being malnourished while those delivered at home have increased risk to malnutrition. This can be attributed to the fact that mothers visiting health facility before, during or after birth are believed to be educated on convenient ways on proper child caring practices. This is not limited to health monitoring of the child but also on the proper diet to administer to the child, family planning practices among others. Geographical disparities in health care distribution have been observed to be part of increased malnutrition rates in other countries [28].
From the surfaces generated of all the significant factors as interpreted from the p-values, a vulnerability index map for the five ASAL counties was generated. All the surfaces were combined in a prediction model to generate a continuous surface showing variation in vulnerability across the study area. Vulnerability to malnutrition varies between 37.45% and 62.81%. It was found that vulnerability varies across counties with Turkana County having more constituencies vulnerable to malnutrition. Turkana North, East, Central and south constituencies recorded high vulnerability while Turkana west and Loima recorded low to medium vulnerability. Counties of West pokot, Baringo and Laikipia had most constituencies recording low to medium vulnerability.
This can be attributed to reduced effects of food insecurity in these areas. Most parts of these counties are agriculturally favorable and residence of these areas practice mixed farming. It was noted also, that these counties have many health facilities fairly distributed and therefore, access to health care might be efficient as indicated in Figures 6 and 7.
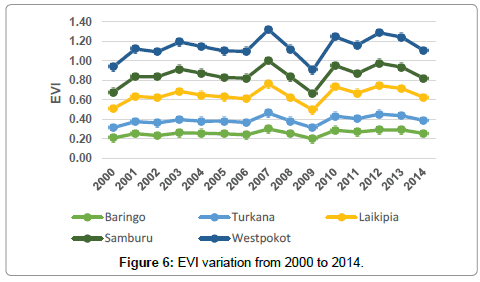
Figure 6: EVI variation from 2000 to 2014.
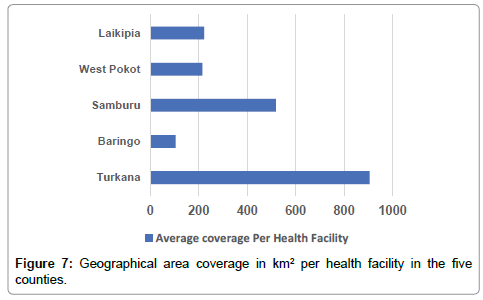
Figure 7: Geographical area coverage in km2 per health facility in the five counties.
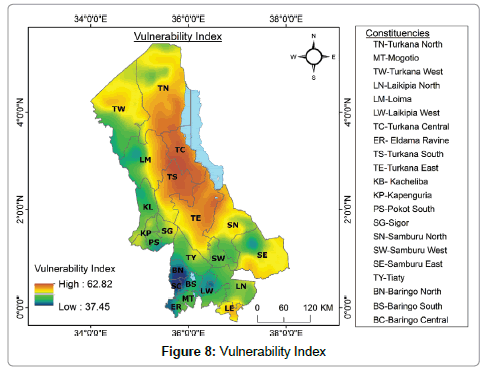
Figure 8: Vulnerability Index
Discussion
A spatial modelling approach of factors contributing to child malnutrition was developed. The prevalence for malnutrition was quantified by using combination of factors significantly associated with malnutrition. Overall prevalence of malnutrition per county has always been numerically quantified but the model provides how the factors combined together show spatial variation in malnutrition. Prevalence of malnutrition in Kenya has been documented in earlier research. A research by Ngare and Muttunga [29] observed regional disparities of malnutrition at district levels (Figures 2 and 3).
A survey conducted in fourteen Kenyan districts making up the current counties found Kiambu county to be having Studies carried out to determine prevalence of malnutrition in Kenya for example Bloss et al. [30] have placed emphasis on disease and nutritional deficient related factors without inclusion factors affecting the environment the child lives in. Inclusion of risk factors that are climate sensitive in modeling malnutrition improves the accuracy in assessing malnutrition vulnerability. Malnutrition rate is at 22.6% and kwale having highest malnutrition rate at 56.5%. The results were documented at a larger spatial unit level i.e., county level but local spatial variation of malnutrition could not be established.
Malnutrition prevalence has always been interpreted to mean the percentage of the malnourished population in a certain region. Previous studies employ basic statistical analysis in establishing the prevalence of malnutrition. The studies also consider a limited range of contributory factors i.e., child and household factors. However, in this study, other determinants believed to have direct or indirect cause of malnutrition have been taken into account in establishing the prevalence of malnutrition. These factors include those that have direct impact on household food insecurity for example Rainfall, temperature and EVI.
Conclusion
Results from the research indicate that most constituencies in Turkana County are highly vulnerable to malnutrition based on factors significantly associated with malnutrition in ASAL Areas with Turkana North, central and South Constituencies most vulnerable. Areas of Samburu North bordering Turkana County are County and Laikipia Counties recorded Low to Medium Vulnerability.
The research recommends future study to incorporate additional sources of socio economic data/information e.g. MICS. DHS data was exclusively used for this study. It further recommends Spatial modelling to be incorporated in analyzing risk factors for childhood malnutrition. This provides more insight on specific areas to be targeted in intervention strategies and finally factors that exacerbate malnutrition rates such as child feeding practices, conflict situations, cultural practices and others linked by various researches to be incorporated in future research work.
References
- Black RE, Allen LH, Bhutta ZA, Caulfield LE, De Onis M, et al. (2008) Maternal and child undernutrition: Global and regional exposures and health consequences. The Lancet 371: 243-260
- Kassahun KM (2013) Prevalence of malnutrition and associated factors among children aged 6-59 Months at Hidabu Abote District. J. Nutr. Disord. Ther 1-114.
- Caulfield LE, De Onis M, Blössner M, Black RE (2004) Undernutrition as an underlying cause of child deaths associated with diarrhea, pneumonia, malaria, and measles. Am J Clin Nutr 80: 193-198.
- Yalew BM (2013) Prevalence of malnutrition and associated factors among children aged 6-59 months at Lalibela town. J. Nutr. Disord. Ther. 4: 114.
- Wong HJ, Moy FM, Nair S (2014) Risk factors of malnutrition among preschool children in Terengganu, Malaysia: A case control study. BMC Public Health 14: 785.
- De Leeuw PN, Grandin BE, Bekure S (1991) Chapter 2: Introduction to the Kenyan rangelands and Kajiado district, in Maasai herding - An analysis of the livestock production system of Maasai pastoralists in eastern Kajiado District, Kenya 172
- Signorelli S, Azzarri C, Roberts C (2016) Malnutrition and climate patterns in the ASALs of Kenya: A resilience analysis based on a pseudo-panel dataset. Feed Futur. Tech. Rep. Ser 2.
- Speranza CI, Kiteme B, Ambenje P, Wiesmann U, Makali S, et al. (2010) Indigenous knowledge related to climate variability and change: Insights from droughts in semi-arid areas of former Makueni District, Kenya, Clim. Change 100: 295-315.
- Alexander KA, Carzolio M, Goodin D, Vance E (2013) Climate change is likely to worsen the public health threat of diarrheal disease in Botswana. Int. J. Environ. Res. Public Health 10: 1202-1230
- Rowhani P, Degomme O, Guha-Sapir D, Lambin EF (2011) Malnutrition and conflict in East Africa: The impacts of resource variability on human security. Clim Change 105: 207-222.
- Schilling J, Opiyo FE, Scheffran J (2012) Raiding pastoral livelihoods: motives and effects of violent conflict in north-western Kenya. Pastor Res Policy Pract 2: 25
- Â Walingo MK (2012) Socio-economic, food and nutrient intake and nutritional status indicators associated with successful livestock development programmes in Western Kenya. African J Agric Research 7: 153-163
- Odhiambo MO (2013) The ASAL Policy of Kenya: Releasing the full potential of arid and semi-arid lands - An analytical review. White Horse Press 17: 158-165.
- KNBS (2010) The 2009 Kenya Population and Housing Census. Home Health Nurse 371-372.
- KNBS (2014) Kenya National Bureau of Statistics ICF Macro, Kenya Demographic and Health Survey 2014. Heal 1-314.
- Jankowska MM, Lopez-Carr D, Funk C, Husak GJ, Chafe ZA (2012) Climate change and human health: Spatial modeling of water availability, malnutrition, and livelihoods in Mali, Africa. Appl Geogr 33: 4-15.
- Miller J, Franklin J, Aspinall R (2007) Incorporating spatial dependence in predictive vegetation models. Ecological Modelling 202: 225-242
- Kerry R, Oliver MA, Haining RP (2010) Geostatistical methods in geography: Applications in physical geography. Geographical Analysis 42: 119-120.
- Hagos S, Lunde T, Mariam DH, Woldehanna T, Lindtjørn B (2014) Climate change, crop production and child under nutrition in Ethiopia: A longitudinal panel study. BMC Public Health 14: 884
- Huicho L, Huayanay-Espinoza CA, Herrera-Perez E, Segura ER, Niño de Guzman J, et al. (2017) Factors behind the success story of under-five stunting in Peru: a district ecological multilevel analysis. BMC Pediatr.17: 29
- Oddo VM, Rah JH, Semba RD, Sun K, Akhter N, et al. (2012) Predictors of maternal and child double burden of malnutrition in rural Indonesia and Bangladesh. Am J Clin Nutr 95: 951-958
- Medhin G, Hanlon C, Dewey M, Alem A, Tesfaye F, et al. (2010) Prevalence and predictors of undernutrition among infants aged six and twelve months in Butajira, Ethiopia: The P-MaMiE Birth Cohort. BMC Public Health 10: 27
- Anselin L (2005) Spatial regression analysis in RA Workbook. Urbana p. 90
- Weier J, Herring D (2000) Measuring vegetation (NDVI & EVI). Feature Articles
- Du Prel JB, Hommel G, Röhrig B, Blettner M (2009) Confidence interval or p-value? Dtsch. Arztebl. Int 106: 335-339
- Wood J, Freemantle N, King M, Nazareth I (2014) Trap of trends to statistical significance: likelihood of near significant P value becoming more significant with extra data. BMJ 348: 2215-2215
- Ehrhardt S, Burchard GD, Mantel C, Cramer JP, Kaiser S (2006) Malaria, Anemia, and Malnutrition in African Children-Defining Intervention Priorities. J. Infect. Dis 194: 108-114.
- Stratton RJ (2007) Malnutrition: Another health inequality? Proc Nutr Soc 66: 522-529
- Ngare DK, Muttunga JN (1999) Prevalence of malnutrition in Kenya. East Afr Med 76: 376-380
- Bloss E, Wainaina F, Bailey RC (2004) Prevalence and predictors of underweight, stunting, and wasting among children aged 5 and under in Western Kenya. J Trop Pediatr 50: 260-270
Citation: Harison K, Mark B, Imwati A (2017) Spatial Variability of Malnutrition and Predictions Based on Climate Change and Other Causal Factors: A Case Study of North Rift ASAL Counties of Kenya. J Earth Sci Clim Change 8: 416. DOI: 10.4172/2157-7617.1000416
Copyright: © 2017 Harison K, et al. This is an open-access article distributed under the terms of the Creative Commons Attribution License, which permits unrestricted use, distribution, and reproduction in any medium, provided the original author and source are credited.
Select your language of interest to view the total content in your interested language
Share This Article
Recommended Journals
Open Access Journals
Article Tools
Article Usage
- Total views: 6139
- [From(publication date): 0-2017 - Nov 20, 2025]
- Breakdown by view type
- HTML page views: 5068
- PDF downloads: 1071