Research Article Open Access
Specific Architectural and Structural Design of an Earthquake Disaster Management Multi-Purpose Complex
Mahmood Hosseini1, Vahid Ghobadian2 and Reza Alizadeh3*1Structural Engineering, Department of Civil Engineering, Graduate School, South Tehran Branch of the Islamic Azad University (IAU), Dubai, UAE
2Architecture Engineering, Department of Architecture, Central Tehran Branch, Islamic Azad University, Dubai, UAE
3Civil Engineering, Department of Civil Engineering & Architecture, UAE Branch, Islamic Azad University, Dubai, UAE
- *Corresponding Author:
- Reza Alizadeh
Master Student of Civil Engineering
Department of Civil Engineering and Architecture
UAE Branch, Islamic Azad University, Dubai, UAE
Tel: + 98 21 22 56 51 49
E-mail: E.r.alizadeh2016@gmail.com
Received Date: August 08, 2016; Accepted Date: November 11, 2016; Published Date: March 20, 2017
Citation: Hosseini M, Ghobadian V, Alizadeh R (2017) Specific Architectural and Structural Design of an Earthquake Disaster Management Multi-Purpose Complex. J Archit Eng Tech 6: 185. doi: 10.4172/2168-9717.1000185
Copyright: © 2017 Hosseini M, et al. This is an open-access article distributed under the terms of the Creative Commons Attribution License, which permits unrestricted use, distribution, and reproduction in any medium, provided the original author and source are credited.
Visit for more related articles at Journal of Architectural Engineering Technology
Abstract
Iran is one of the most seismic countries in the world, a lot of earthquakes occur in Iran every year. Some actions and researches have been done about Earthquake Disaster Risk Management field since 1990 after large earthquake of Manjil-Rudbar in Iran. One of the main subjects of Earthquake Disaster Risk Management is Community base Disaster risk Management (CBDRM). This paper presents the idea of Earthquake Disaster Management Multipurpose Complex (EDMMC) with self-help neighborhood approach that has been proposed for making CBDRM feasible in each neighborhood of a large city like Tehran, The case study is Youssef Abad-region6-Tehran. Furthermore, in structural Design, the seismic behavior of Earthquake Disaster Management Multipurpose Complex (EDMMC) was evaluated using dynamic nonlinear analysis. In total, three different structures (the building of a training complex with a typical foundation (M1 ), the steel building of the training complex with a LRB base-isolator (M2 ), and the steel building of the training complex with rocking structural systems (M3 )) were studied applying three earthquakes of Northridge, Kobe, and Chi-Chi. Several seismic parameters were also evaluated including time history of displacement (displacementtime), time history of base shear (force-time), and the hysteresis diagram (force-displacement). The results indicate the appropriate function of the selected M2 and M3 model in controlling and decreasing the seismic responses of the structure.
Keywords
Earthquake disaster management multipurpose complex; Base isolation; Rocking structure; Time history; Nonlinear analysis
Introduction
Earthquakes are one of the most devastating natural hazards that cause great loss of life and livelihood. On average, 10,000 people die each year due to earthquakes, while annual economic losses are in the billions of dollars and often constitute a large percentage of the gross national product of the country affected. Additionally, the damage caused by earthquakes is almost entirely associated with manmade structures. As in the cases of landslides, earthquakes also cause death by the damage they induce in structures such as buildings, dams, bridges and other works of man. Unfortunately many of earthquakes give very little or no warning before occurring and this is one of the reasons why earthquake engineering is complex [1,2].
Also buildings, which are tall in comparison to their plan area, will generate high overturning moments while buildings with large plan areas may not act as expected due to differences in ground behavior, which are not always predictable. This causes different parts of the building to be shaken differently creating obvious problems. Torsion from ground motion could be of great concern due to eccentricity in the building layout. For instance if the center of mass (gravity) is not in the same position as the center of resistance; a torsional moment about a vertical axis will be created which will have to be designed for. In order to achieve satisfactory earthquake response of a structure, three methods can be identified as being practical and efficient: isolation, energy absorption at plastic hinges, and use of mechanical devices to provide structural control [3].
Vibration control is a fairly new category in different methods of improving the seismic behavior of structures and designing seismic resistant buildings. Based on this concept, response of structures under dynamic loads is controlled using embedded appropriate devices and equipment’s by which displacements are reduced and dynamic response is improved. In the last two decades considerable progress has been achieved in control of structures. These control systems are classified into three categories which include: active control, semiactive control and passive control.
Using energy dissipation devices or dampers is one of the control methods for structures subjected to seismic loads. These devices are used in the design of new buildings and retrofitting of existing buildings. Instead of increasing ductility of structural elements, dampers reduce the level of seismic energy imposed on these elements [3,4].
Since the motion of earthquakes is vibrational in nature, the principle of vibration isolation can be utilized to protect a building (i.e., it is decoupled from the horizontal components of the earthquake ground motion by mounting rubber bearings between the building and its foundation). Such a system not only provides protection to the building but also to its contents and occupants. Base isolation is a passive structural control technique where a collection of structural elements is used to substantially decouple a building from its foundations resting on shaking ground, thus protecting the building's structural integrity [5].
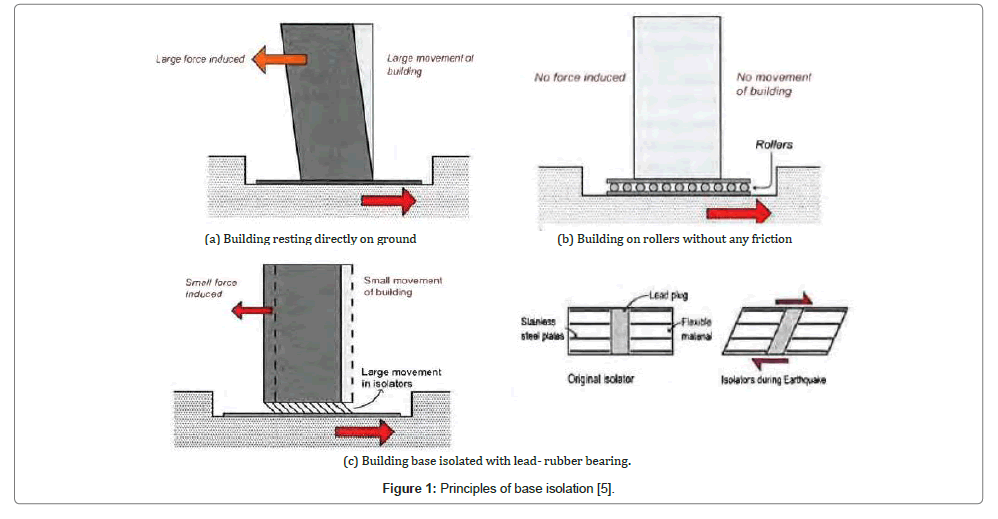
Base isolation can be used both for new structural design and seismic retrofit. Some prominent buildings in California (e.g., Pasadena City Hall, San Francisco City Hall, LA City Hall) have been seismically retrofitted using Base Isolation Systems. In New Zealand, Te Papa in Wellington and Christchurch Women Hospital are examples of base isolated new buildings, and Parliament buildings in Wellington have been seismically retrofitted. Christchurch Women's Hospital is the only base isolated building in the South Island and expectedly did not suffer any damage in the recent Canterbury earthquakes. The concept of base isolation is explained through an example building resting on frictionless rollers; as shown in Figure 1b. When the ground shakes, the rollers freely roll, but the building above does not move. Thus, no force is transferred to the building due to the horizontal shaking of the ground; simply, the building does not experience the earthquake.
Now, if the same building is located on flexible pads that offer resistance against lateral movements (Figure lc), then some effect of the ground shaking will be transferred to the building above. If the flexible pads are properly chosen, the forces induced by ground shaking can be much less than that experienced by a fixed base building built directly on the ground (Figure 1a). The flexible pads shown in Figure 1c are called base-isolators, whereas the structures protected by means of these devices are called base-isolated buildings [5] (Figure 1).
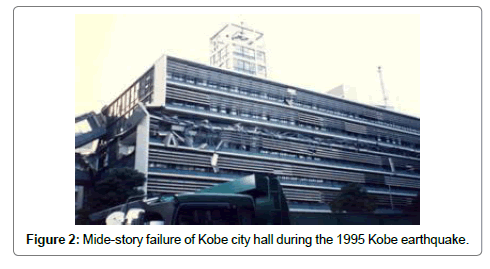
On the other hand, Rocking structures avoid structural damage by shifting the burden of energy dissipation to non-critical, replaceable structural elements, and by preventing weak story failure (Figure 2). Damage that would result in severe injury, and also damage that would prevent future serviceability of the structure, can be addressed by allowing structures to move, relative to their foundations. By enabling structures to be serviceable after a seismic event, rocking systems are a highly sustainable approach to structural design in earthquake-prone regions.
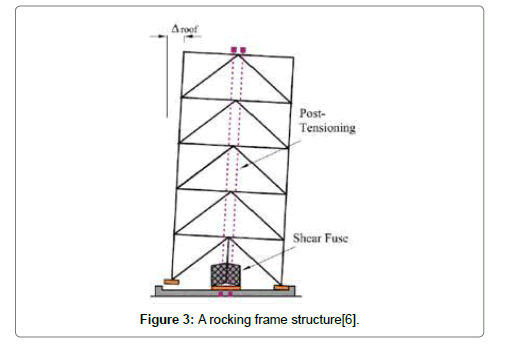
For newly constructed buildings, there are many ways to prevent seismic damage. For example the entire frame can be allowed to rock, with energy dissipation being performed by replaceable fuses (Figure 3). However clearly for existing structures, this is not possible, and we must find other ways to apply the benefits of rocking structures [6] (Figures 2 and 3).
Scope of the Study
Use of passive energy dissipation devices has become very popular in the recent years. However, the vast majority of applications was realized within frame structures, while investigations on the use of multi damping devices is still very limited. For this reason the aim of this research is to discussed about the idea of Earthquake Disaster Management Multipurpose Complex (EDMMC) with self-help neighborhood approach that has been proposed for making CBDRM feasible in each neighborhood of a large city like Tehran, The case study is Youssef Abad-region6-Tehran and then is designed one EDMMC with high performance of architectural and structural earthquake resistance design, that has different function before and after earthquake. According to this structure retrofitted by base isolation (LRB base-isolator) and Rocking structures.
Literature review
In recent years, both researchers and practicing engineers have recognized that energy dissipation isolation can provide an efficient means for controlling the structure response induced by strong motion earthquakes. Most structures can be designed to withstand severe earthquake forces by providing ductility and energy absorption capacity to the structural elements, but at the expense of substantial damage in the structural elements, and also for nonstructural elements and services. On the other hand, by dissipating the vibratory energy in structural isolations, the risk of the structure experiencing excessive deformations or accelerations can be reduced. As a result, less ductility or inelastic energy demand is required in the structural frame. In particular, structural isolation systems can be designed essentially to limit the nonlinear behavior to the isolation devices, thereby imposing very small or no ductility demand on the structure itself. Passive and active damping of vibration in structures can be very important for several reasons. In terms of performance, higher damping can reduce the steady-state vibration time, and it can also reduce the time needed for transient vibration to settle. Generally, passive damping can reduce the complexity of the active control needed. However, it couples vibration modes (natural frequencies) which have been calculated for an un-damped system [2-4].
Subramani et al. presented an overview of the present state of base isolation techniques with special emphasis and a brief on other techniques developed world over for mitigating earthquake forces on the structures. The effects of base isolation on structures located on soft soils and near active faults are given in brief. Simple case study on natural base isolation using naturally available soils is presented. Also, the future areas of research are indicated. The application of the base isolation techniques to protect structures against damage from earthquake attacks has been considered as one of the most effective approaches and has gained increasing acceptance during the last two decades. This is because base isolation limits the effects of the earthquake attack, a flexible base largely decoupling the structure from the ground motion, and the structural response accelerations are usually less than the ground acceleration. In general, the increase of additional viscous damping in the structure may reduce displacement and acceleration responses of the structure. This study also seeks to evaluate the effects of additional damping on the seismic response when compared with structures without additional damping for the different ground motions [7].
Patil et al. presented an overview of the present state of base isolation techniques with special emphasis and a brief on other techniques developed world over for mitigating earthquake forces on the structures. The dynamic analysis procedure for isolated structures is briefly explained. The provisions of FEMA 450 for base isolated structures are highlighted. The effects of base isolation on structures located on soft soils and near active faults are given in brief. Simple case study on natural base isolation using naturally available soils is presented. Also, the future areas of research are indicated [8].
Kelly in investigated of entative design procedure intended to substitute for the special study required by the code. The resistance function of rocking walls was developed from the principles of engineering mechanics. The results from a series of time history analyses were used to develop a procedure to estimate maximum seismic displacements and empirical equations were derived to estimate the dynamic amplification of inertia forces. A substitute structure approach, using spectral displacements at an effective period calculated from the ductility factor, provided accurate predictions of the displacements from more sophisticated nonlinear analyses [9].
Ma et al. studied on a new technique for modelling the dynamic response of uplifting rigid structures subjected to base excitation. The proposed technique exploits the use of a two-spring foundation, and subsequently an equivalent single-degree-of-freedom procedure is established to model the dynamics of the system. This paper presents two additional numerical examples to demonstrate the use of the proposed technique to simulate the displacement time-histories of a prototype structure under free-vibration-decay or when subjected to earthquake excitations [10].
Makris et al. investigated of the planar rocking response and stability analysis of an array of free-standing columns capped with a freely supported rigid beam. Most importantly, the study shows that the heavier the freely supported cap-beam is (epistyles with frieze atop), the more stable is the rocking frame, regardless of the rise of the center of gravity of the cap-beam; concluding that top-heavy rocking frames are more stable than when they are top-light. This counter intuitive finding renders rocking isolation a most attractive alternative for the seismic protection of bridges with tall piers [11].
Architectural Design
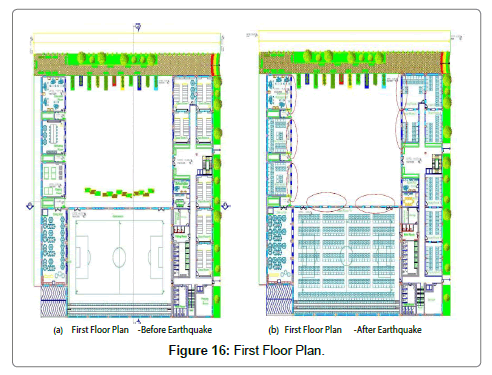
Main aim of this section is architectural design of Earthquake Disaster Management Multi-Purpose Complex. Before earthquake EDMMC is an elementary school and after earthquake EDMMC allows neighborhood to help homeless and wounded people before coming of rescue and relief team and reduces the casualty in the earthquake disaster.
The EDMMC have several functions before, during and after the earthquake which includes:
• Before earthquakes: Educational Base, Class Rooms, Workshops, Workshops about Earthquake, Gymnasium, Conference Hall, Court Yard, Storage.
• After earthquake: Temporary Accommodation, Emergency hospital, Food and drug, storage place, Psychological consultancy (for whom have lost their family or faced financial damages).
• Permanent: Information and communication technology Center (ICT), Disaster management meeting center, Emergency tools storage.
The site is in region 6 of Tehran-Iran that is suggested in pervious section (4-1-3-2) as EDDMC in region 6.
Site analysis
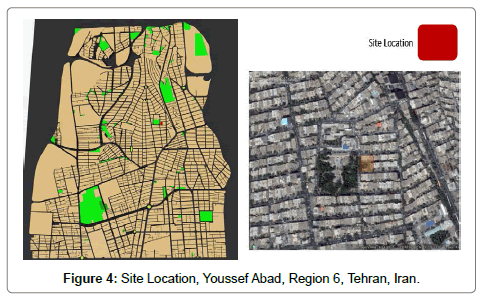
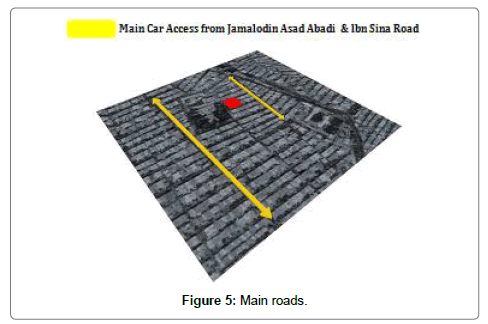
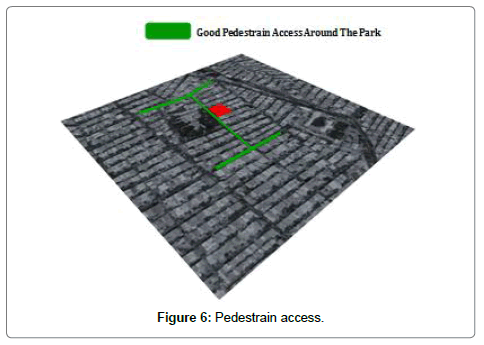
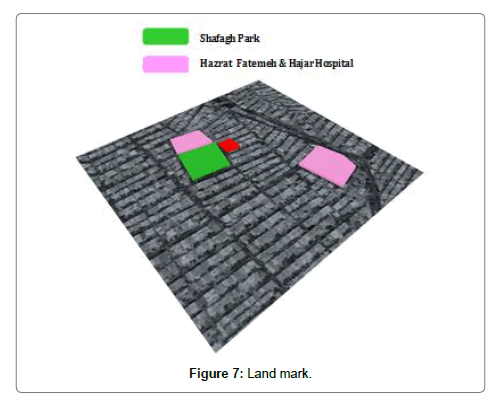
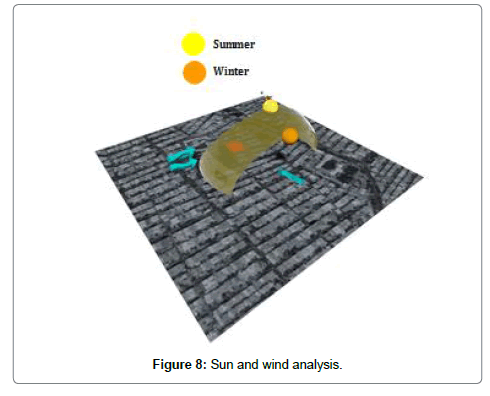
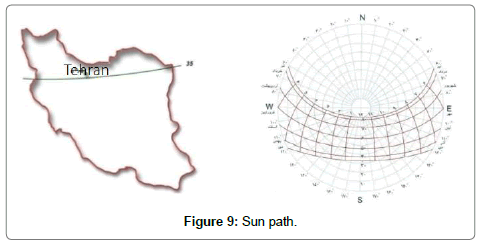
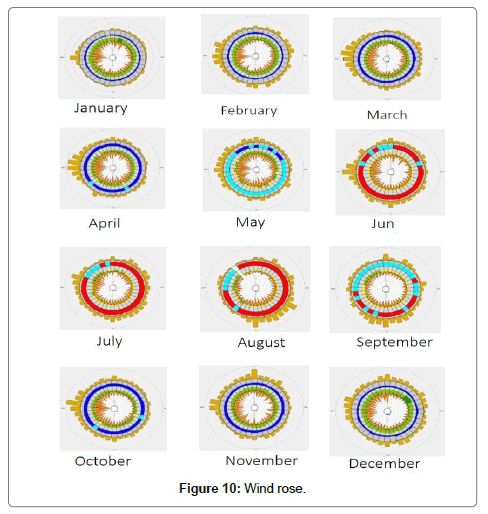
Site location: The site is concerned in a place of one real elementary school (Mostafa Khomeini Elementary School) in Youssef Abad Region 6 (Figures 4-10).
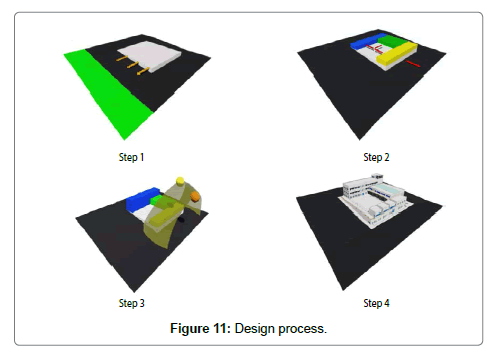
Design process: Design process consists of below steps (shown in Figure 11):
Step 1: To have a good view of the park, make the first mass as a rectangular shape.
Step 2: Divide the mass into 4 main buildings (and one court yard) as the idea of their functions.
Step 3: Increase the height of the classes building (blue building) for having more sun light.
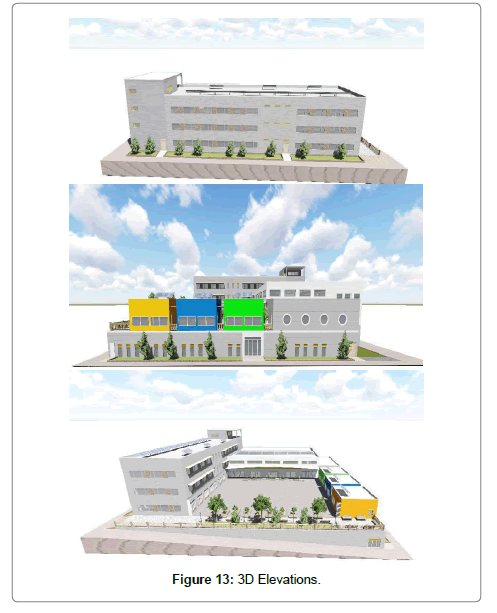
Step 4: Final mass which has modern view with long horizontal windows.
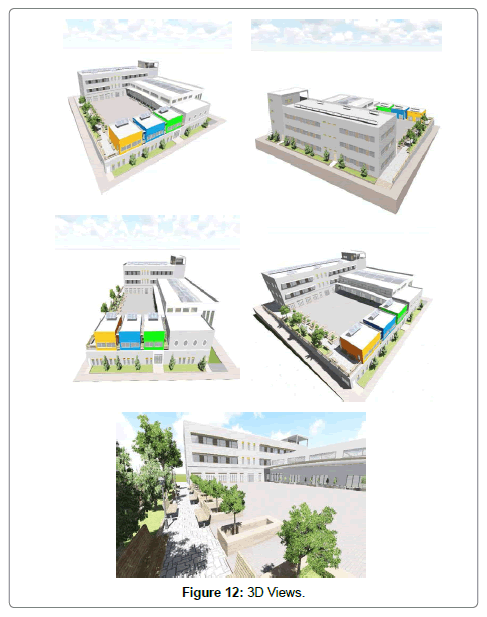
Three dimension (3D) of structure
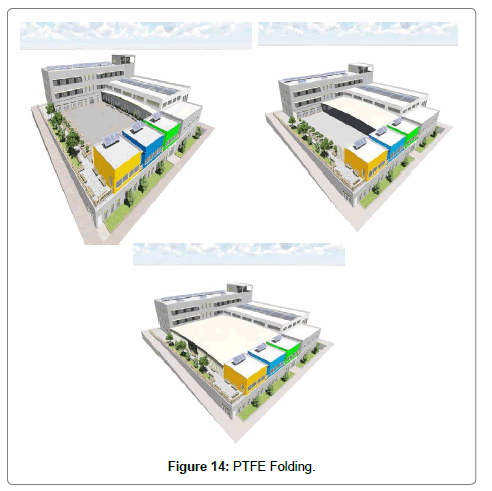
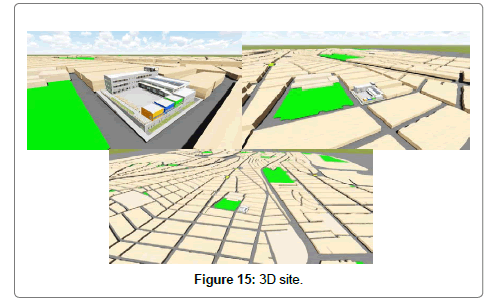
Figures 12-15 show 3D views, 3D elevations, PTFE Folding Roof and 3D site. (Note: Function of spaces is designed according to minimum standards that are mentioned in section 4-1-3-1-1 (Sphere Project Book, Figures 12-15).
Drawing
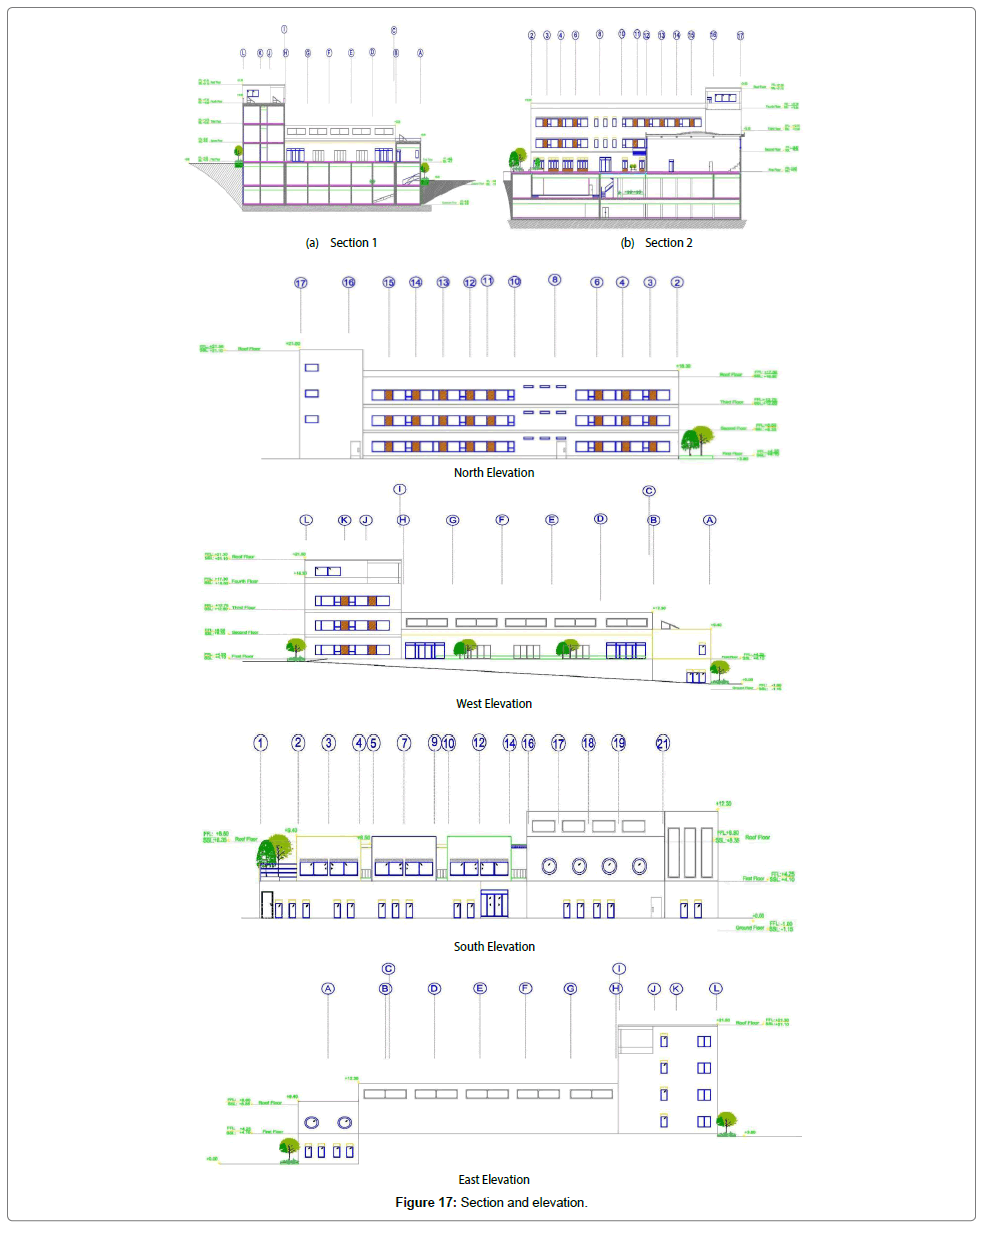
Drawings include some plans (before and after earthquake), dimension plans, elevations and sections plans (Figures 16 and 17).
Building materials
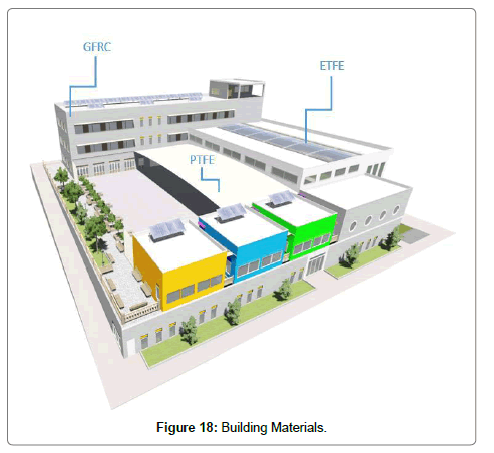
This section discusses ETFE, PTFE and CRFC that are considered as finishing materials for this project (Figure 18).
GFRC as finishing: Glass Fiber Reinforced Concrete (GFRC) is one of the most innovative construction materials available and provides designers with complex aesthetics as well as exceptionally high performance.
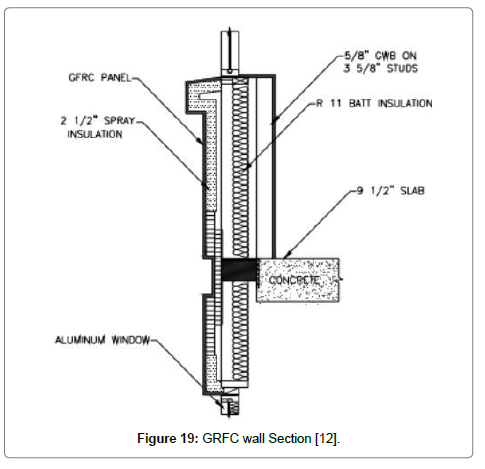
GFRC panels, generally ribbed or sandwich panels, provide durability, fire resistance, sound reduction and energy efficiency as well as the superior properties inherent in the material. With one-fifth of the weight for the same solution in precast concrete, this option is more suitable for areas with restricted access, and gives the building structure considerably less loads.
GFRC panels are lightweight but extremely strong, and come in a wide variety of finishes and colors. Tough and impact-proof, they have unrivalled durability, being resistant to acid rain, ultra-violet light and freeze-thaw (Figure 19) [12].
ETFE as gymnasium roof and windows: Ethylene-Tetra- Fluor-Ethylene copolymer, or ETFE, is a lightweight material used in the construction of large-span roofing, skylights, and facades. It finds application as an alternative to glass, where high light and UV transmission are requirements. Requiring less structural steel support than traditional glazed systems (rendering it easier to install and typically lower cost), it is often considered a value-engineered option over glass roofing. ETFE foil roofs can be supplied as a single layer membrane supported by a cable net system or as a series of pneumatic cushions made up of between two and five layers of ETFE.
ETFE Foil is a plastic polymer related to Teflon and is created by taking the polymer resin and extruding it into a thin film. Transparent windows are created either by inflating two or more layers of foil to form cushions or tensioning into a single skin membrane. Weighing approximately 1% of the weight of glass, ETFE (both single ply membranes as well as multiple layered ETFE cushions) are extremely light weight (Figure 20) [13].
Structural Design
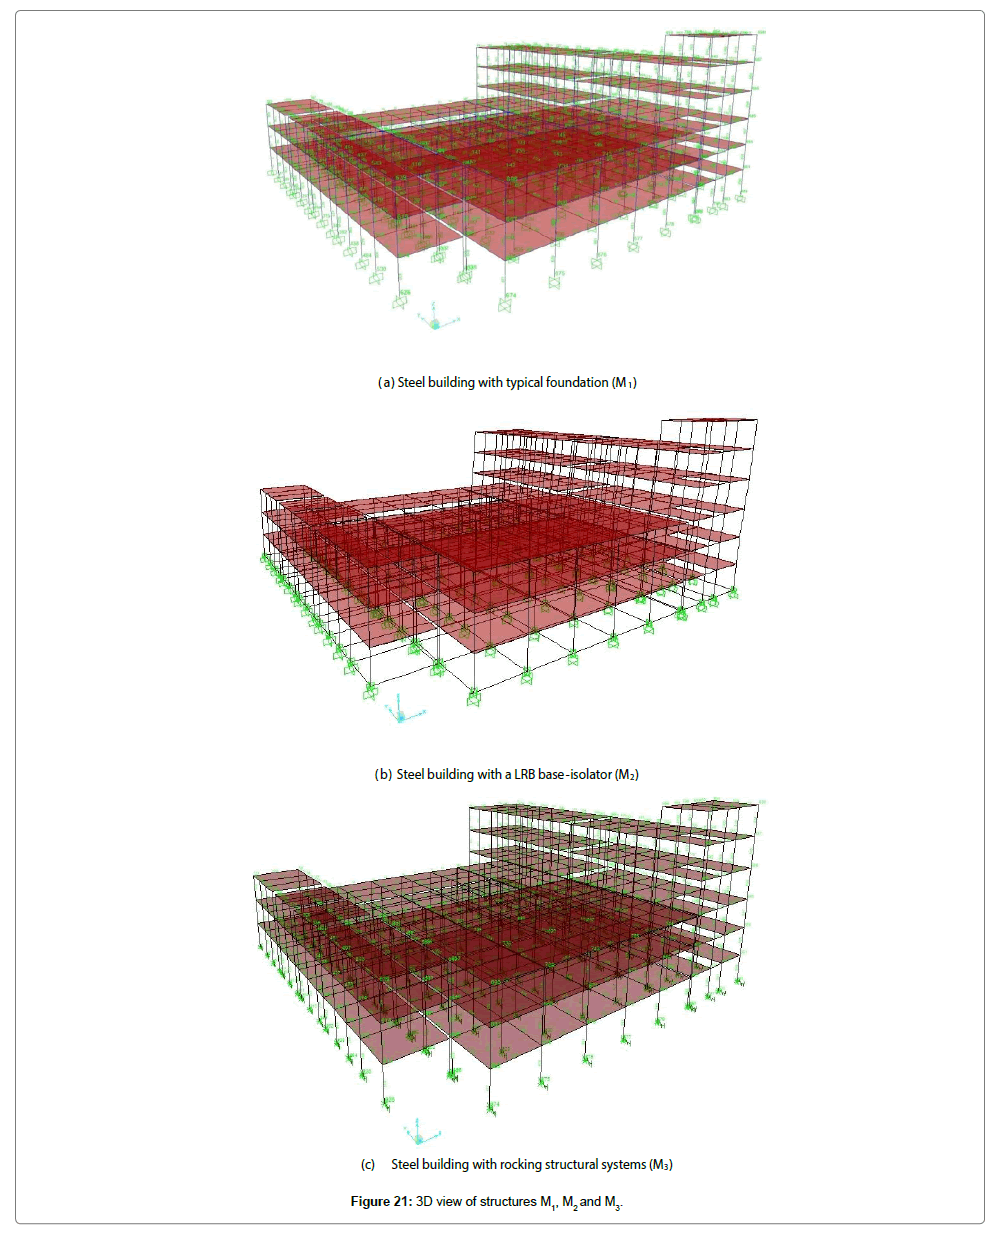
This study considered 3D moment-frame structures, as shown in Figure 21. All the requirements of the current Iranian seismic code (IS. 2800) were met. To calculate the weights of the floors, dead and live loads were considered as DL=600 Kg/m2 and LL=500 Kg/m2, respectively. All systems were designed according to the sixth issue of national building regulations (loads on buildings) and IS.2800 using LRFD method. In modeling phase, soil type III was considered as the site soil, and a training complex with an importance degree of I=1.2 located in a high-risk area was modeled. In this study, three structures were modeled as follows:
• The steel building of EDMMC with typical foundation (M1)
• The steel building of EDMMC with a LRB base-isolator (M2)
• The steel building of EDMMC with rocking structural systems (M3)
Figure 21 shows a 3D view of structures M
The gravity load was applied on the structures based on sixth issue of National Building Regulations (Load Regulations) and the earthquake load was calculated based on IS. 2800. To design steel members, we referred to USA's regulations on steel structures (AISCLRFD99). To build models, we used steel with yield strength of 2400 km/m3 and concrete with compressive strength of 210 km/m3.
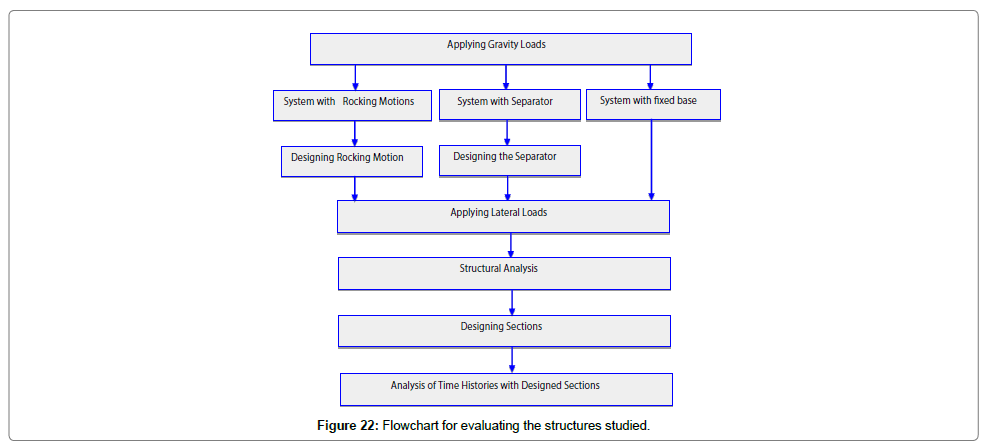
The assessment process is as follows: after loading, the structural system was analyzed based on IS. 2800 [14,15] (spectral dynamic analysis based on the design spectra), then the members sections were designed, and finally, the responses of structures were defined using the dynamic analysis of time histories of normalized records. The assessment flowchart is shown in Figure 22.
The selection of accelerations
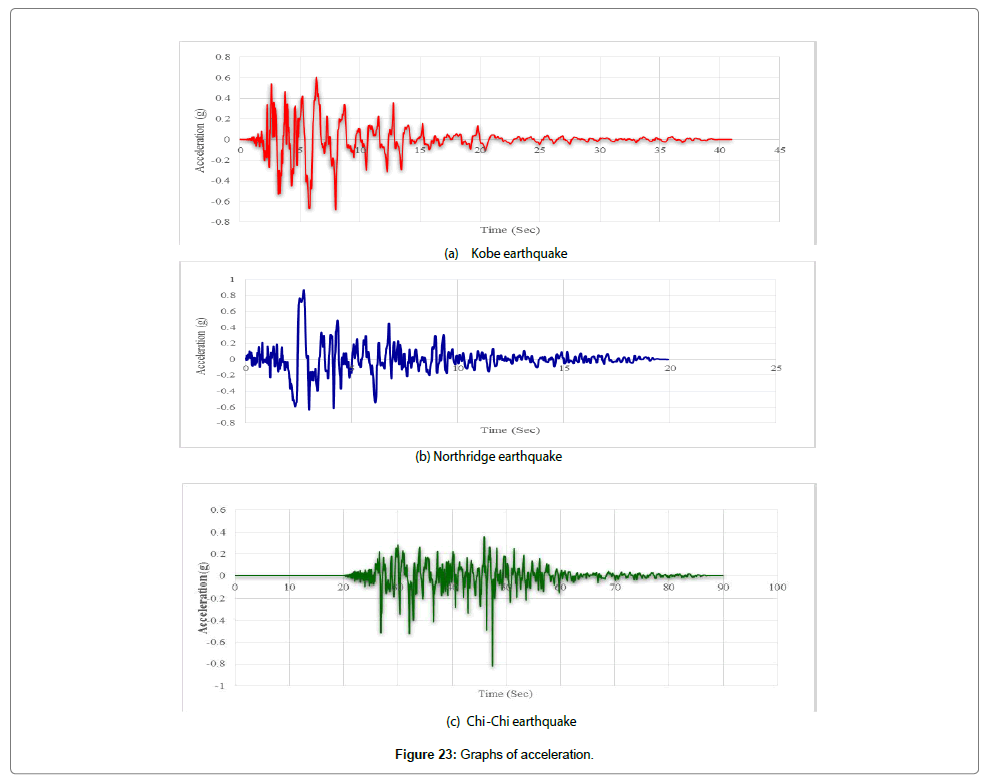
Three pairs of acceleration are used in this project. Similar to designed structures, they have been obtained from the earthquakes occurred in the grounds containing type-two soil according to 2800 standard.
The selected accelerations in this project are obtained using the following earthquakes:
1- Kobe earthquake (1996)
2- Northridge earthquake (1995)
3- Chi Chi earthquake (1999).
The temporal step and the total time of the record of each accelerations have been shown in Table 1.
| Acceleration 's name | Chi Chi | Northridge | Kobe |
|---|---|---|---|
| Temporal step | 0.005 | 0.01 | 0.02 |
| Total time | 90 | 24 | 48 |
Table 1: The temporal step and the total time of accelerations.
Drawing the acceleration diagram- time of acceleration
According to 2800 standard criteria, after selecting the related earthquakes, all of acceleration values in certain temporal steps are obtained by introducing the earthquake's acceleration pair to the software and are drawn by the software. In this way, the maximum acceleration of the acceleration pair (PGA) is obtained. It is worth mentioning that scaling acceleration pair via SEISMOSIGNAL software is used for reading and drawing the acceleration of the selected earthquakes.
Scaling acceleration to the maximum value
The first stage involves scaling the obtained acceleration from the software to the maximum value which equals g acceleration. To this aim, we should find a number so that the obtained PGA at the first stage multiplied by that number equals g acceleration. We can show it by the following relation:
α=g/PGA (1)
In this relation, α equals the scale factor that scales the accelerations to its maximum value (Table 2).
| Acceleration | Peak Ground Acceleration (PGA) | α Coefficient |
|---|---|---|
| Kobe | 0.599 g | 1.669 |
| Northridge | 0.879 g | 1.138 |
| Chi Chi | 0.474 g | 2.109 |
Table 2: Lists PGA and α coefficient for each accelerogram.
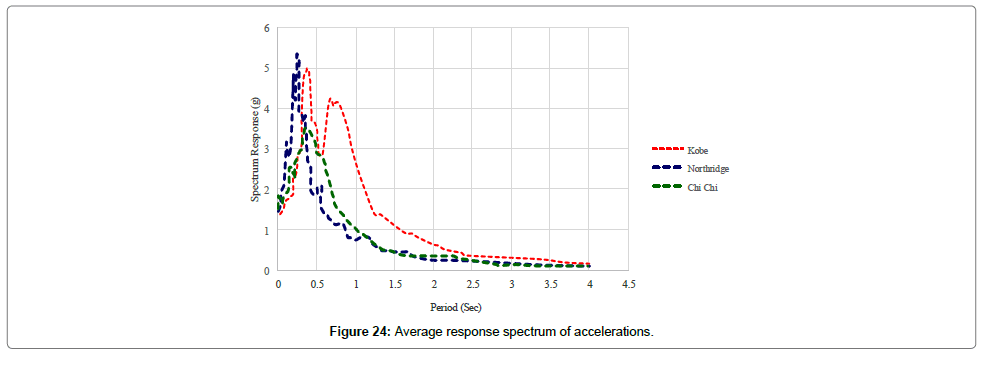
As shown in Figure 23, the value of acceleration is scaled to its maximum value, i.e. g (Figure 24).
Nonlinear dynamic analysis (time history)
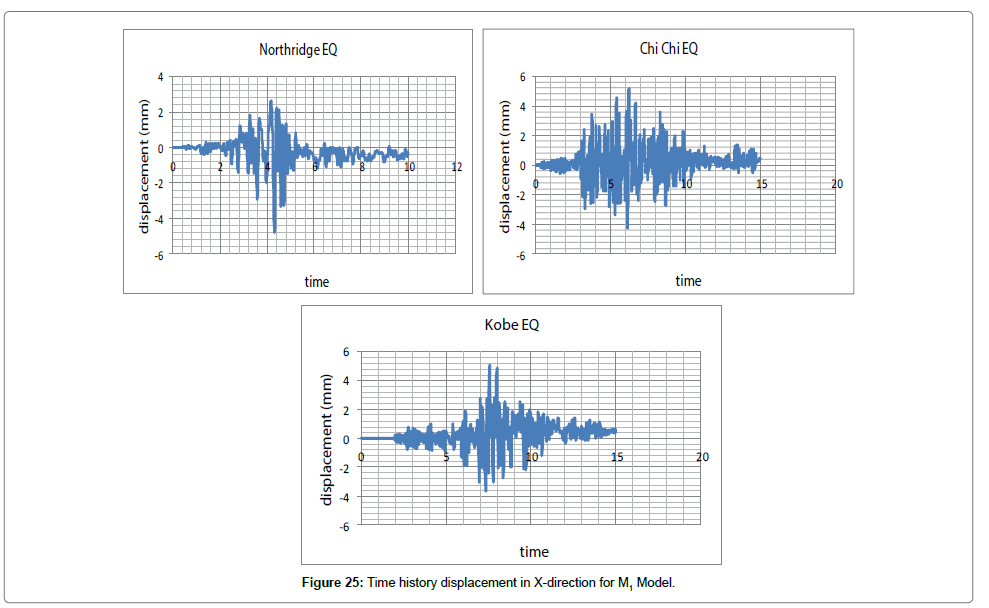
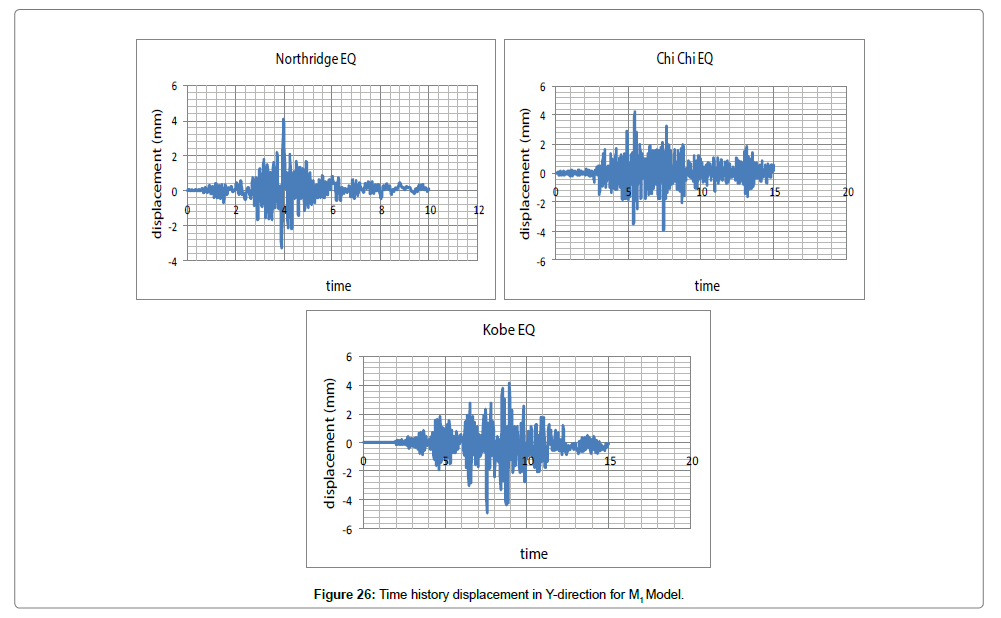
Steel structure with typical foundation (M1): In nonlinear time history analysis, the load was applied on the structure as acceleration in both directions of X and Y by Kobe, Northridge, and Chi-Chi earthquakes. The results obtained by modeling and analyzing are shown in Figures 25 and 26.
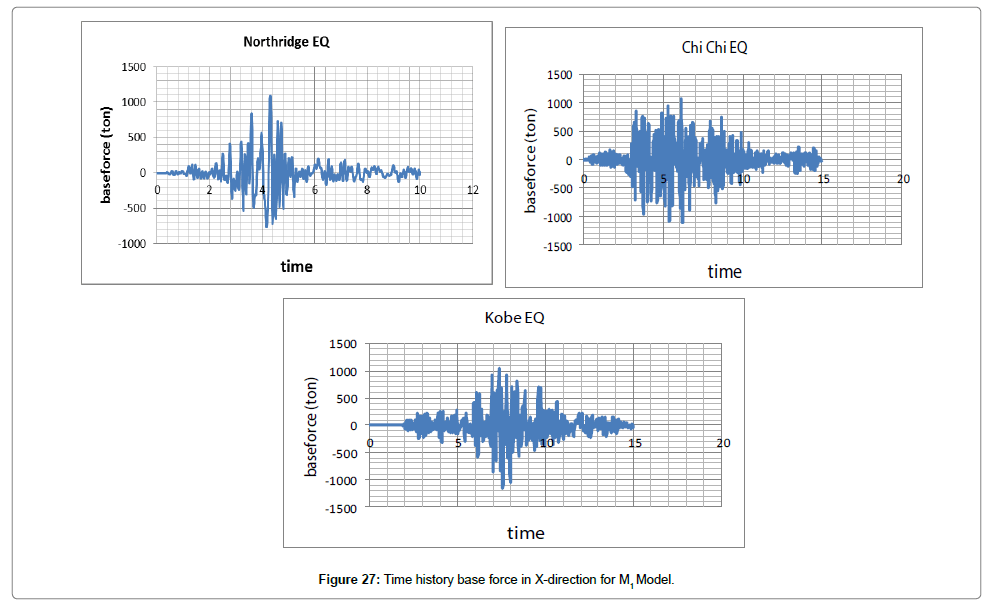
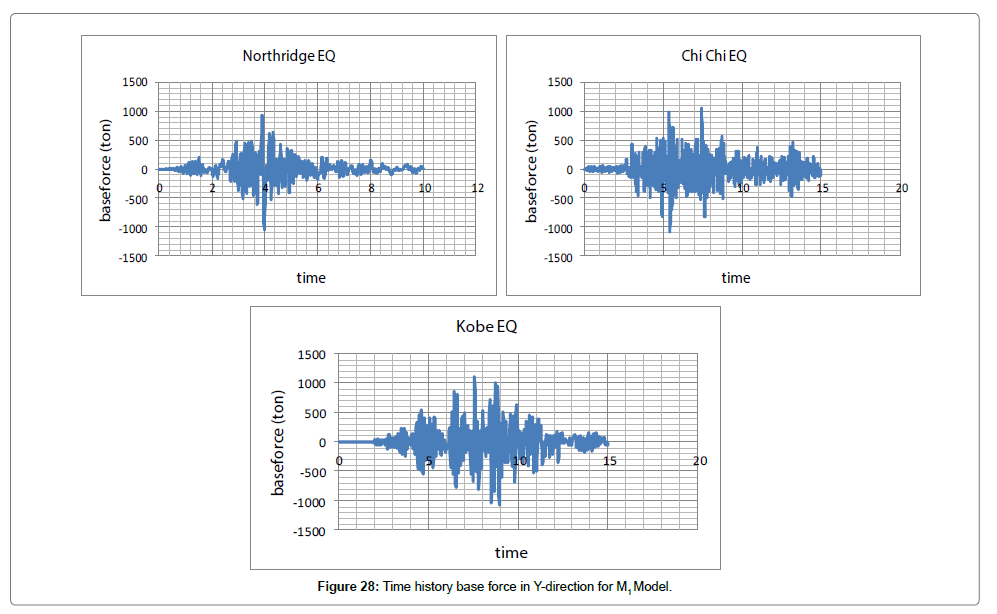
We first evaluate changes in displacement and force exerted on the structure both in X and Y directions considering changes in time (Figures 27, 28, Tables 3 and 4).
| The maximum displacement along the X in mm | ||
|---|---|---|
| Kobe | Northridge | Chi-Chi |
| 5.5 | 4.8 | 5.4 |
MAX Displacement=5.4 mm
Table 3: Maximum displacement in X- direction for M1 Model.
| The maximum displacement along the Y in mm | ||
|---|---|---|
| Kobe | Northridge | Chi-Chi |
| 4.8 | 4.2 | 4.4 |
MAX Displacement=4.8 mm
Table 4: Maximum displacement in Y-direction for M1 Model.
Tables 5 and 6 show the maximum force caused by the mentioned earthquakes.
| The maximum force along the X in Ton | ||
|---|---|---|
| Kobe | Northridge | Chi-Chi |
| 1140 | 1100 | 1218 |
MAX Displacement=1218 Ton
Table 5: Maximum force in X- direction for M1 Model.
| The maximum force along the Y in Ton | ||
|---|---|---|
| Kobe | Northridge | Chi-Chi |
| 1217 | 1086 | 1114 |
MAX Displacement=1217 Ton
Table 6: Maximum force in Y-direction for M1 Model.
The maximum force in X happened due to Chi-Chi earthquake which is 1218 tones. Kobe earthquake caused the maximum force in Y, with a value of 1217 tones (Figures 27 and 28).
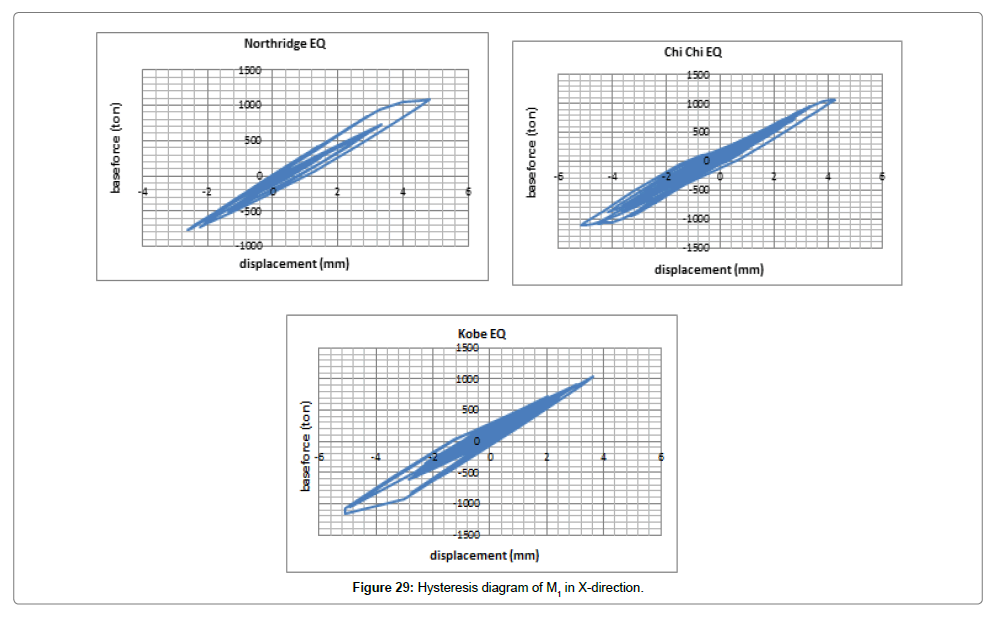
After representing diagrams of changes in displacement and force exerted on the structure (displacement-time and force-time) both in X and Y directions considering changes in time and interpreting the results, we will evaluate hysteresis diagrams (Figures 29 and 30).
As shown in Figures 29 and 30, the structure entered the nonlinear state by the three earthquakes while the structure displacement entered the plastic state. Given that the area under the hysteresis diagram represents the absorbed energy, Chi-Chi and Kobe had the maximum energy loss along X and Y, respectively. On the other hand, there was no significant increase in displacement compared to the base shear which is due to the high rigidity of the structure.
In general, the area under the hysteresis diagram represents the amount of energy absorbed by the structure under the load. On this basis and considering Figures 5-15, we can conclude that M1 absorbed the maximum amount of energy under Kobe earthquake while in X, the structure entered the nonlinear state by the three earthquakes and showed far more plasticity than other available earthquakes.
In the hysteresis diagram of M1 in Y, the only important point is the nonlinear behavior of the structure under Chi-Chi and Northridge earthquakes that absorbed a considerable amount of energy compared to Kobe earthquake (Figure 30).
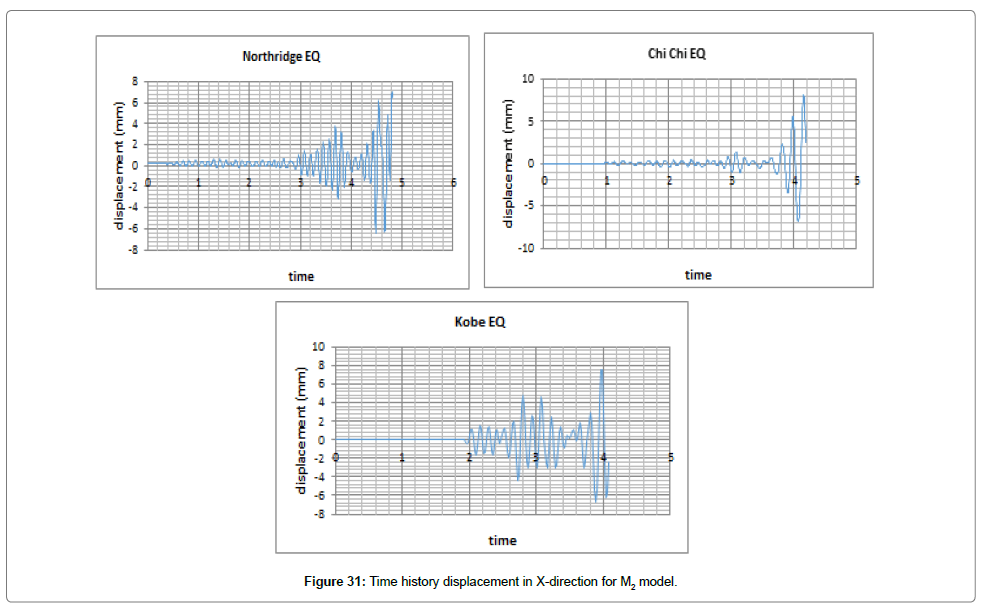
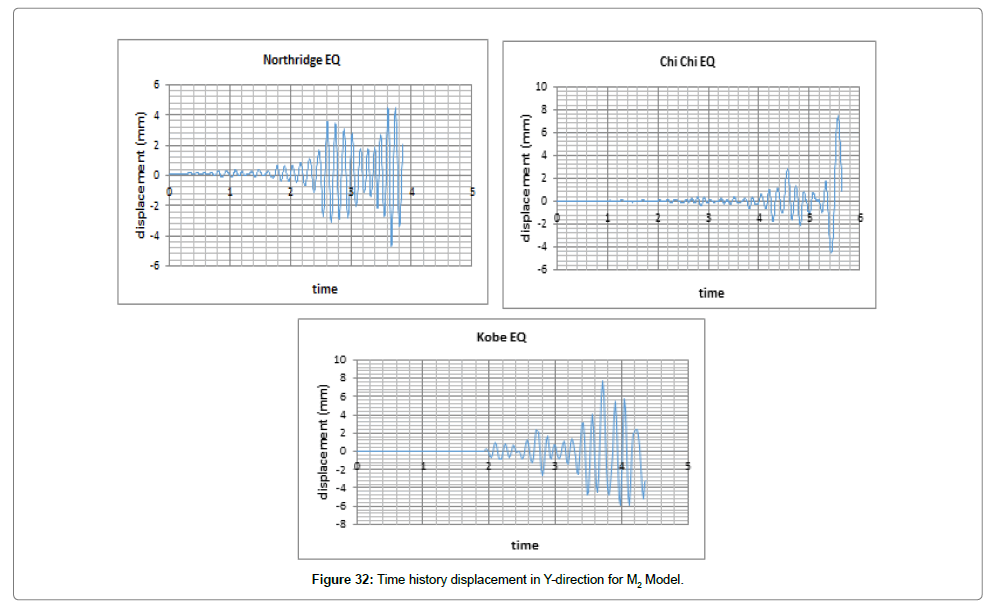
Steel Structure with LRB base isolators (M2): In nonlinear time history analysis, the load was applied on the structure as acceleration in both directions of X and Y by Kobe, Northridge, and Chi-Chi earthquakes. The results obtained by modeling and analyzing are shown in Figures 31 and 32.
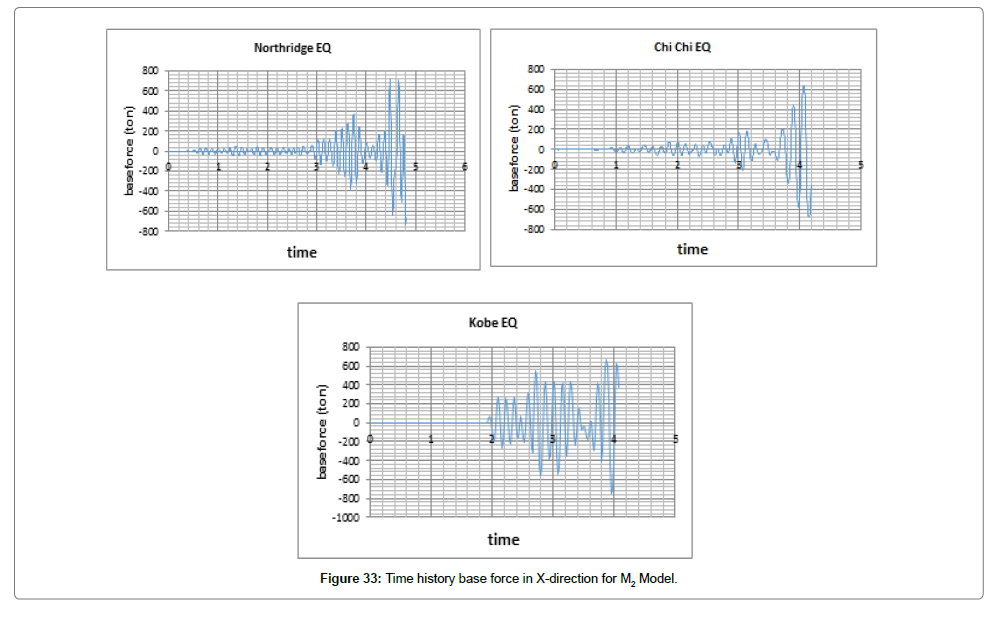
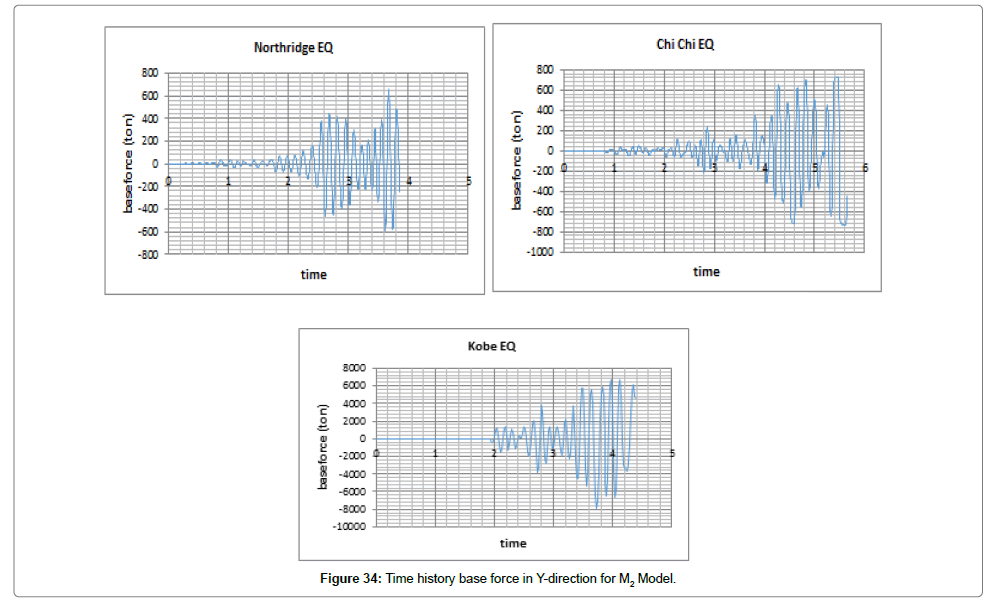
We first evaluate changes in displacement and force exerted on the structure both in X and Y directions considering changes in time (Figures 33 and 34). Tables 7 and 8 list the maximum displacements over time caused by the earthquakes.
| The maximum displacement along the X in mm | ||
|---|---|---|
| Kobe | Northridge | Chi-Chi |
| 7.6 | 7.2 | 8.1 |
MAX Displacement=8.1 mm
Table 7: Maximum displacement in X- direction for M2 Model.
| The maximum displacement along the Y in mm | ||
|---|---|---|
| Kobe | Northridge | Chi-Chi |
| 7.6 | 5.8 | 7.9 |
MAX Displacement=7.9mm
Table 8: Maximum displacement in Y-direction for M2 Model.
Tables 9 and 10 show the maximum force caused by the mentioned earthquakes.
| The maximum force along the X in Ton | ||
|---|---|---|
| Kobe | Northridge | Chi-Chi |
| 760 | 710 | 680 |
MAX Displacement=760 Ton
Table 9: Maximum force in X- direction for M2 Model.
| The maximum force along the Y in Ton | ||
|---|---|---|
| Kobe | Northridge | Chi-Chi |
| 800 | 680 | 710 |
MAX Displacement=800 Ton
Table 10: Maximum force in Y-direction for M2 Model.
The maximum force in X happened due to Kobe earthquake which is 760 tones. This earthquake also caused the maximum force in Y, with a value of 800 tones (Figure 33 and 34).
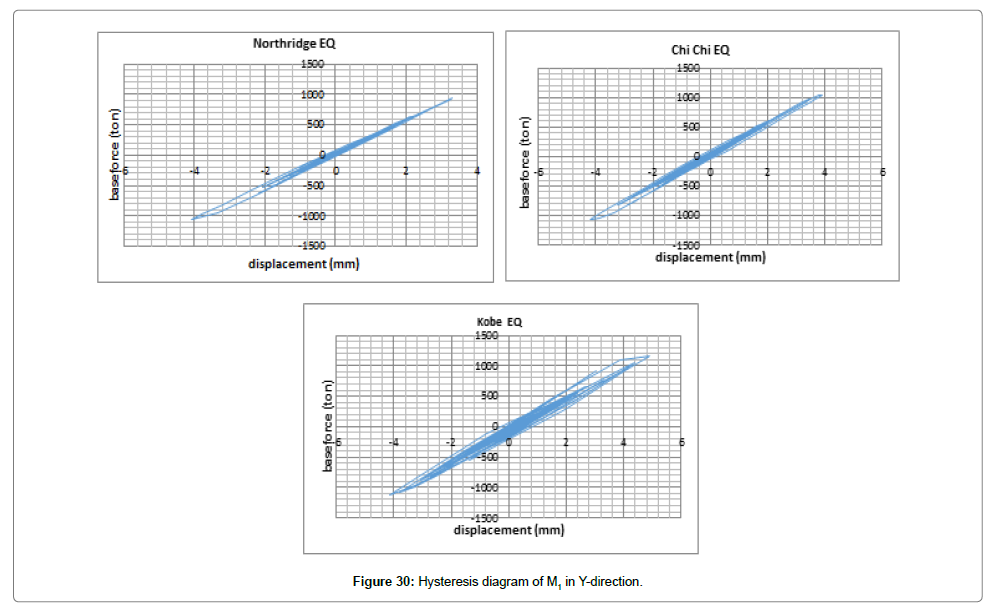
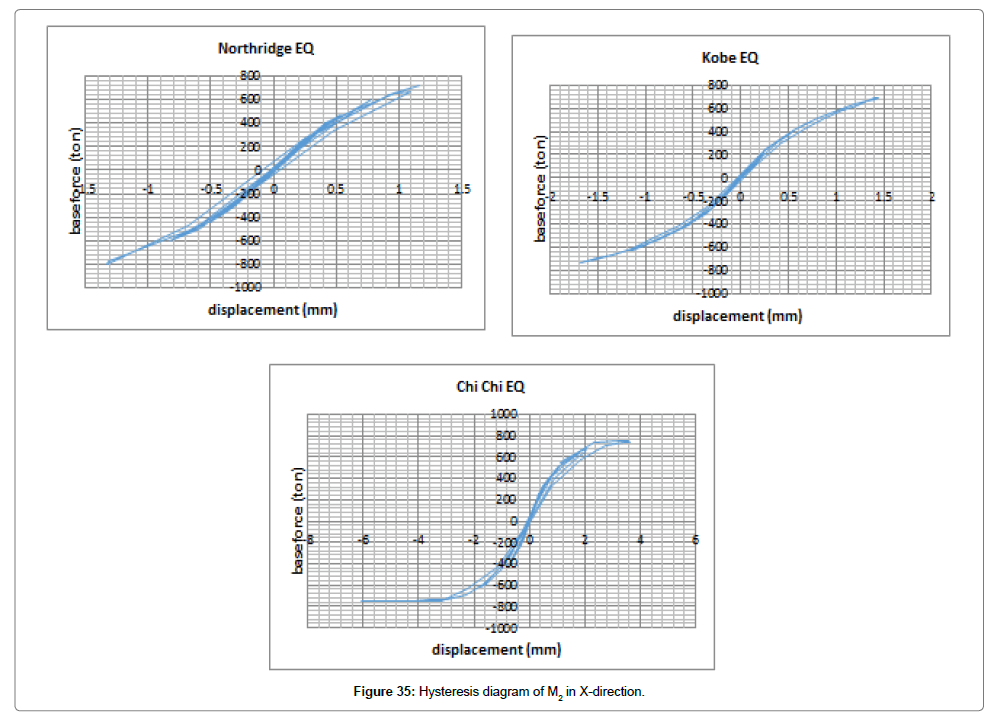
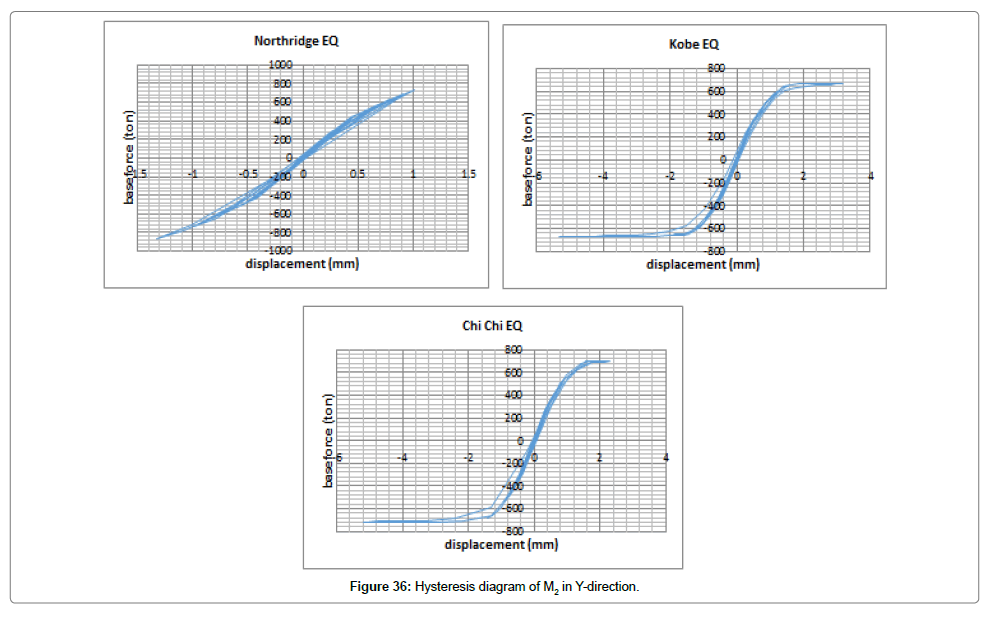
After representing diagrams of changes in displacement and force exerted on the structure (displacement-time and force-time) both in X and Y directions considering changes in time and interpreting the results, we will evaluate hysteresis diagrams (Figures 35 and 36).
As shown in Figures 35 and 36, the structure entered the nonlinear state by the three earthquakes while the structure displacement entered the plastic state. Given that the area under the hysteresis diagram represents the absorbed energy, Chi-Chi had the maximum energy loss along X and Y, respectively.
In general, the area under the hysteresis diagram represents the amount of energy absorbed by the structure under the load. On this basis and considering Figure 35, we can conclude that M2 absorbed the maximum amount of energy under Chi-Chi earthquake while in X, the structure entered the nonlinear state by the three earthquakes and showed far more plasticity than other available earthquakes.
In the hysteresis diagram of M1 in Y, the only important point was the nonlinear behavior of the structure under Chi-Chi and Kobe earthquakes that absorbed a considerable amount of energy compared to Northridge earthquake (Figure 36).
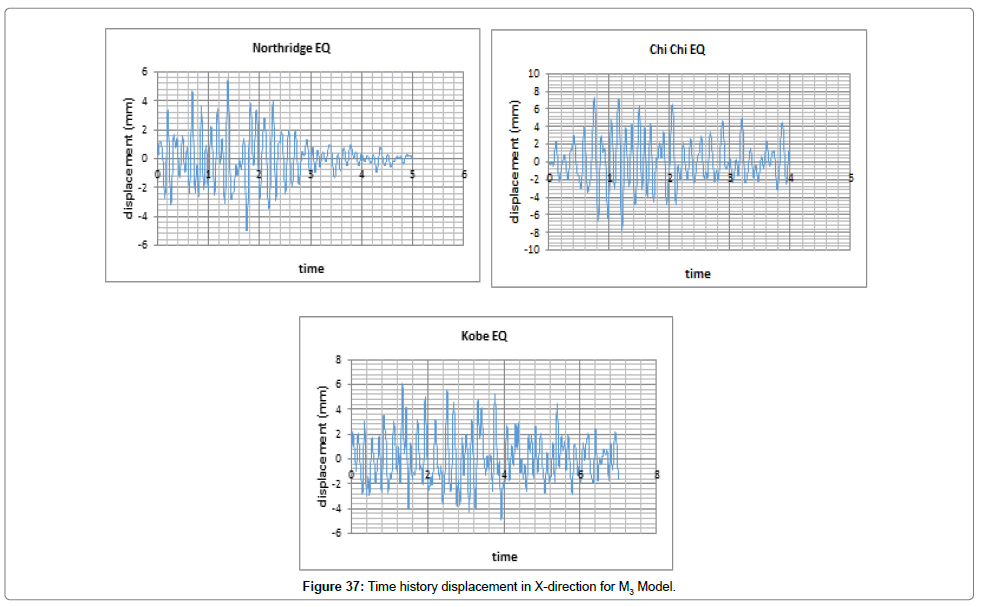
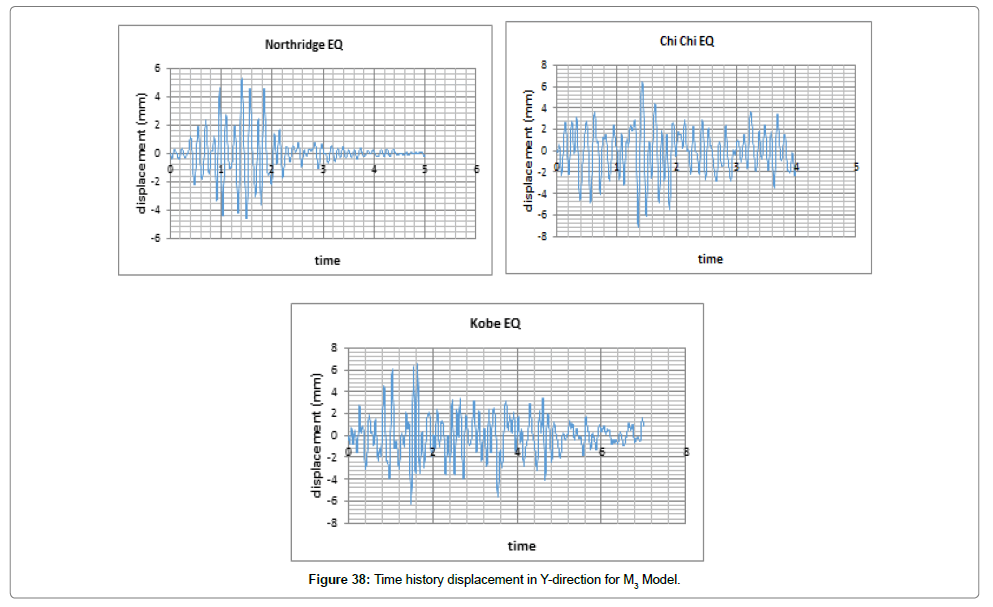
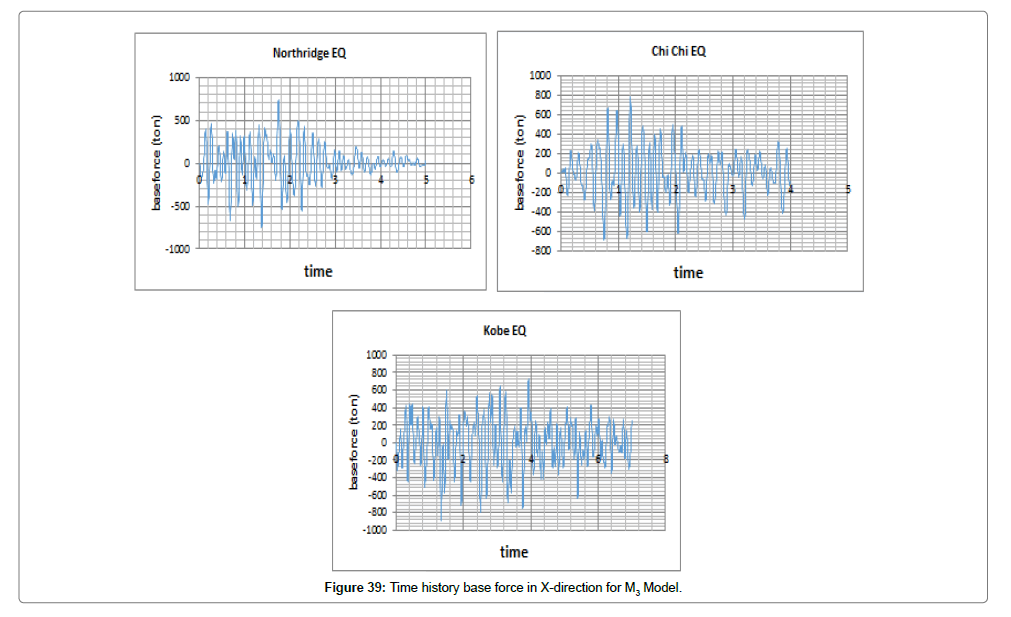
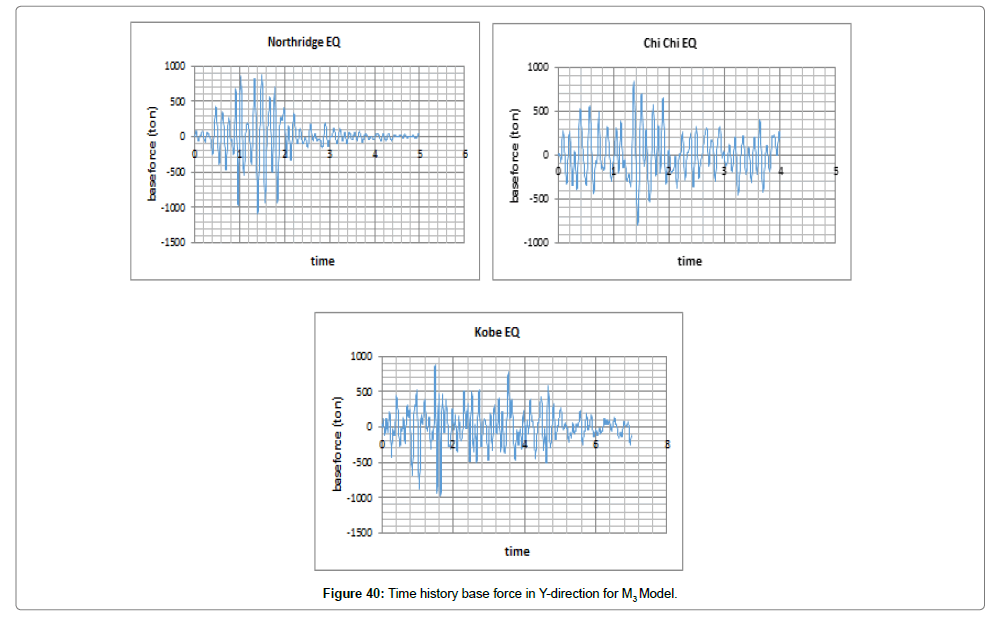
Steel structure with rocking structural system (M3): In nonlinear time history analysis, the load was applied on the structure as acceleration in both directions of X and Y by Kobe, Northridge, and Chi-Chi earthquakes. The results obtained by modeling and analyzing are shown in Figures 37 and 38.
We first evaluate changes in displacement and force exerted on the structure both in X and Y directions considering changes in time (Figures 39 and 40). Tables 11 and 12 list the maximum displacements over time caused by the earthquakes.
| The maximum displacement along the X in mm | ||
|---|---|---|
| Kobe | Chi-Chi | Northridge |
| 6.2 | 7.5 | 5.6 |
MAX Displacement=7.5 mm
Table 11: Maximum displacement in X- direction for M3 Model.
| The maximum displacement along the Y in mm | ||
|---|---|---|
| Kobe | Chi-Chi | Northridge |
| 6.1 | 7.2 | 5.4 |
MAX Displacement=7.2 mm
Table 12: Maximum displacement in Y-direction for M3 Model
Tables 13 and 14 show the maximum force caused by the mentioned earthquakes.
| The maximum force along the X in Ton | ||
|---|---|---|
| Kobe | Chi-Chi | Northridge |
| 885 | 782 | 760 |
MAX Displacement=885 Ton
Table 13: Maximum force in X- direction for M3 Model.
| The maximum force along the Y in Ton | ||
|---|---|---|
| Kobe | Chi-Chi | Northridge |
| 1050 | 860 | 1090 |
MAX Displacement=1090 Ton
Table 14: Maximum force in Y-direction for M3 Model.
The maximum force in X happened due to Kobe earthquake which is 885 tones. Northridge earthquake caused the maximum force in Y, with a value of 1090 tones.
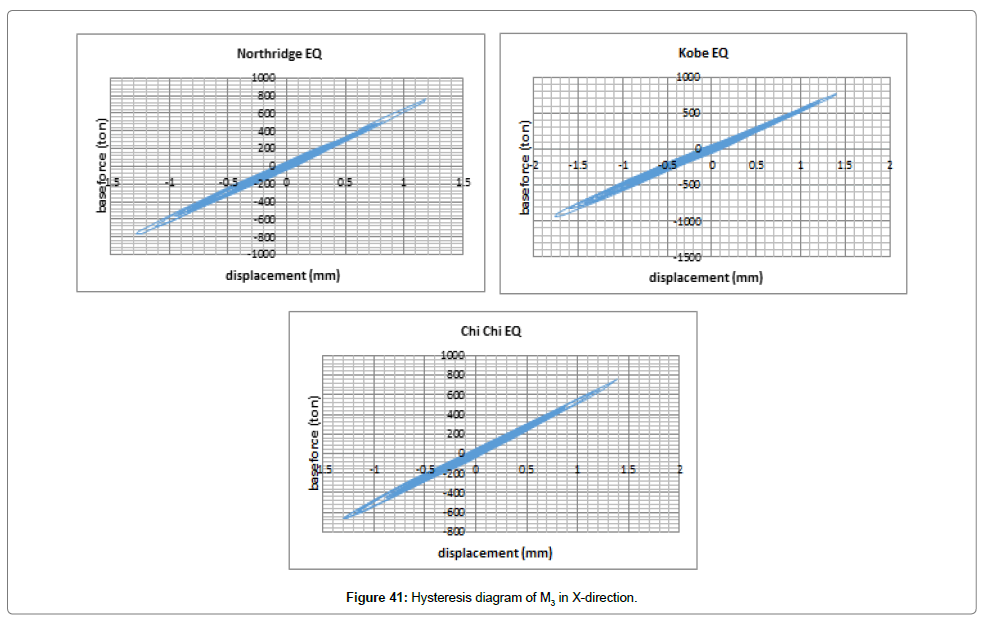
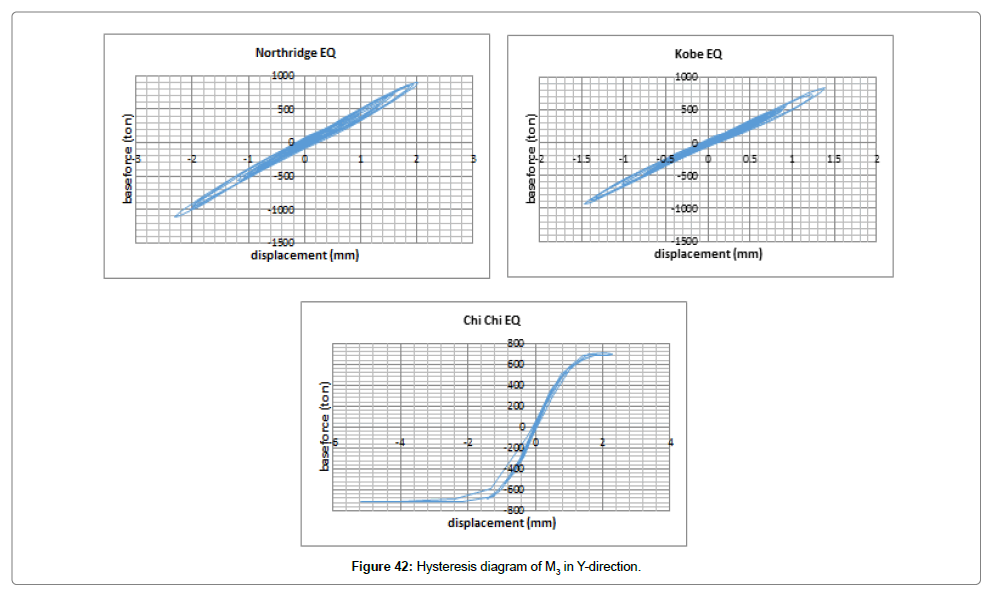
After representing diagrams of changes in displacement and force exerted on the structure (displacement-time and force-time) both in X and Y directions considering changes in time and interpreting the results, we will evaluate hysteresis diagrams (Figures 41 and 42).
As shown in Figures 41 and 42, the structure did not enter the nonlinear state by the three earthquakes and the structure displacement remained in the elastic state. Given that the area under the hysteresis diagram represents the absorbed energy, Chi-Chi had the maximum energy loss along X and Y, respectively.
In general, the area under the hysteresis diagram represents the amount of energy absorbed by the structure under the load. On this basis and considering Figure 41, we can conclude that M3 absorbed the maximum amount of energy and entered the nonlinear state under Chi-Chi earthquake while in X, the structure did not enter the nonlinear state by the three earthquakes and showed far less plasticity than other available earthquakes in Y.
In the hysteresis diagram of M3 in Y, the only important point was the nonlinear behavior of the structure under Chi-Chi and earthquake that absorbed a considerable amount of energy compared to Northridge and Kobe earthquakes (Figure 42).
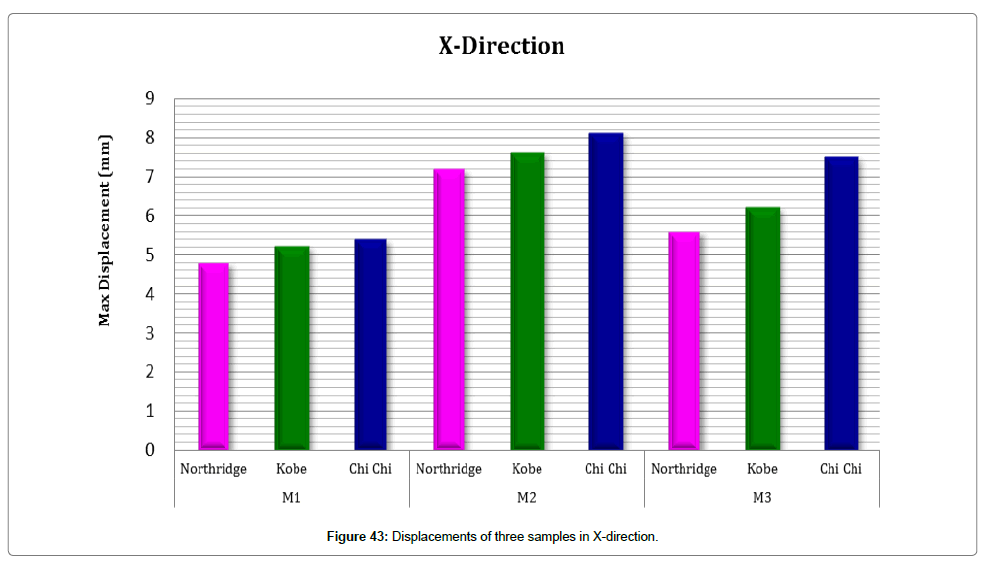
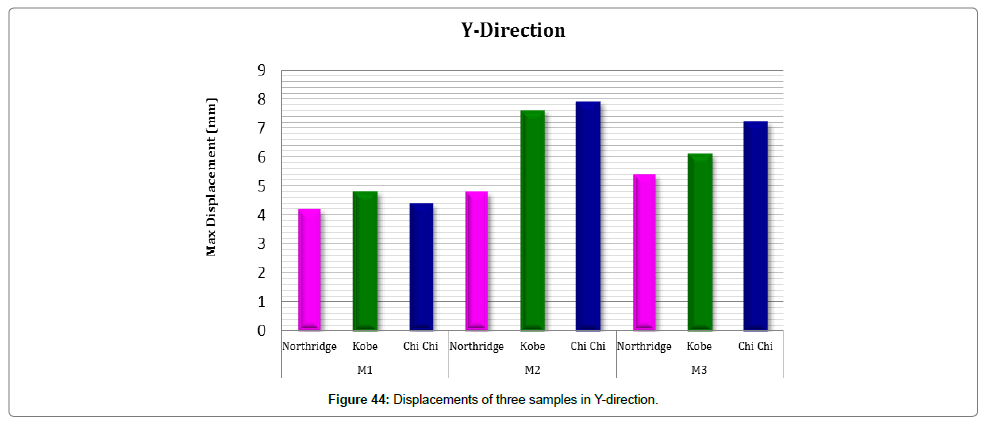
Comparing structural displacement: Figures 43 and 44 show displacements in X and Y, respectively. According to these figures, the maximum displacement in X (8.1 mm) was experienced by M2 and caused by Chi-Chi earthquake. In addition, the maximum displacement in Y was 7.9 mm, experienced by M2 (steel foundation with LRB base isolator) and caused by Chi-Chi earthquake.
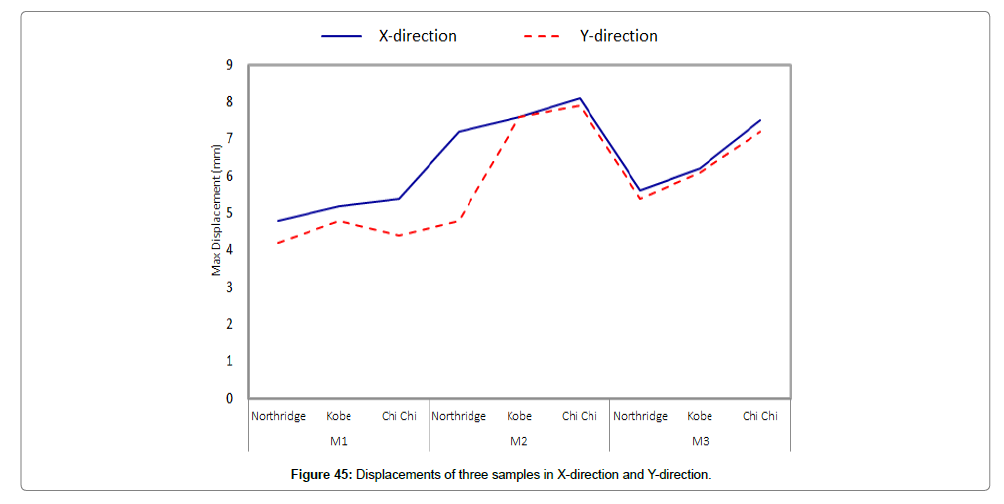
Figure 45 compares displacements in X and Y. As discussed, the maximum displacement of M2 in Y under Chi-Chi earthquake is about 2.5% more than the maximum displacement in X.
Conclusion
In this study, the seismic behavior of Earthquake (architectural and structural Design) Disaster Management Multipurpose Complex (EDMMC) was evaluated using dynamic nonlinear analysis.
In architectural design’s section is discussed about the idea of Earthquake Disaster Management Multipurpose Complex (EDMMC) with self-help neighborhood approach that has been proposed for making CBDRM feasible in each neighborhood of a large city like Tehran, The case study is Youssef Abad-region6-Tehran and then is designed one EDMMC with high performance of architectural and structural earthquake resistance design, that has different function before and after earthquake. Before earthquake EDMMC is a public school and after earthquake EDMMC allows neighborhood to help wounded people before coming of rescue and relief team and reduces the casualty of an earthquake disaster. But, in structural Design, the seismic behavior of Earthquake Disaster Management Multipurpose Complex (EDMMC) was evaluated using dynamic nonlinear analysis. In total, three different structures (the building of a training complex with a typical foundation (M1), the steel building of the training complex with a LRB base-isolator (M2), and the steel building of the training complex with rocking structural systems (M3)) were studied applying three earthquakes of Northridge, Kobe, and Chi-Chi. Several seismic parameters were also evaluated including time history of displacement (displacement-time), time history of base shear (forcetime), and the hysteresis diagram (force-displacement).
The results of this study are as follows:
• For the building of training complex with a typical foundation (M1), in both directions of X and Y, the maximum displacements was caused by Kobe earthquake with values of 4.5 mm and 8.4 mm, respectively. While the maximum force in X was experienced by Chi- Chi earthquake (1218 tons) and in Y by Kobe earthquake (1217 tones).
• For the building of training complex with a typical foundation, the structure entered the nonlinear state by the three earthquakes while the structure displacement entered the plastic state. Given that the area under the hysteresis diagram represents the absorbed energy, Chi-Chi and Kobe had the maximum energy loss along X and Y, respectively. On the other hand, there was no significant increase in displacement compared to the base shear which is due to the high rigidity of the structure. M1 absorbed the maximum amount of energy under Kobe earthquake while in X, the structure entered the nonlinear state by the three earthquakes and showed far more plasticity than other available earthquakes.
• In the hysteresis diagram of M1 in Y, the only important point was the nonlinear behavior of the structure under Chi-Chi and Northridge earthquakes that absorbed a considerable amount of energy compared to Kobe earthquake.
• For the building of training complex with LRB base separator (M2), in both directions of X and Y, the maximum displacements was caused by Chi-Chi earthquake with values of 8.1 mm and 7.9 mm, respectively. While the maximum force in X and Y was experienced by Kobe earthquake as 760 tons and 1217 tones, respectively.
• For the building of training complex with a typical foundation (M2), the structure entered the nonlinear state by the three earthquakes while the structure displacement entered the plastic state. Given that the area under the hysteresis diagram represents the absorbed energy, Chi-Chi had the maximum energy loss along X and Y.
• The area under the hysteresis diagram represents the amount of energy absorbed by the structure under the load. On this basis, M2 absorbed the maximum amount of energy under Chi-Chi earthquake while in X, the structure entered the nonlinear state by the three earthquakes and showed far more plasticity compared to other available earthquakes in Y.
• In the hysteresis diagram of M1 in Y, the only important point was the nonlinear behavior of the structure under Chi-Chi and Kobe earthquakes that absorbed a considerable amount of energy compared to Northridge earthquake.
• For the building of training complex with rocking structural systems (M3), in both directions of X and Y, the maximum displacements was caused by Chi-Chi earthquake with values of 7.5 mm and 7.2 mm, respectively. While the maximum forces in X and Y are experienced by Kobe and Northridge earthquake as 885 tons and 1090 tones, respectively.
• The building of training complex with rocking structural systems did not enter the nonlinear state by the three earthquakes and the structure displacement remained in the elastic state. Given that the area under the hysteresis diagram represents the absorbed energy, Chi- Chi had the maximum energy loss along X and Y, respectively.
• M3 absorbed the maximum amount of energy and entered the nonlinear state under Chi-Chi earthquake while in X, the structure did not enter the nonlinear state by the three earthquakes and showed far less plasticity than other available earthquakes in Y.
• In the hysteresis diagram of M3 in Y, the only important point was the nonlinear behavior of the structure under Chi-Chi and earthquake that absorbed a considerable amount of energy compared to Northridge and Kobe earthquakes.
Comparing displacements in X and Y, we found that the maximum displacement in X (8.1 mm) was experienced by M2 and caused by Chi-Chi earthquake. In addition, the maximum displacement in Y was 7.9 mm, experienced by M2 (steel foundation with LRB base isolator) and caused by Chi-Chi earthquake. As discussed, the maximum displacement of M2 in Y under Chi-Chi earthquake is about 2.5% more than the maximum displacement in X.
References
- Lee KS, Fan CP, Sause R, Ricles J (2005) Simplified design procedure for frame buildings with viscoelastic or elastomeric structural dampers. Earthquake Engineering & Structural Dynamic Journal 34:1271-1284.
- Rodrigo MMD, Lavado J, Museros P (2010) Dynamic performance of existing high-speed railway bridges under resonant conditions retrofitted with fluid viscous dampers. Engineering Structures. 32: 808-828.
- Mazza F, Vulcano A (2011) Control of the earthquake and wind dynamic response of steel-framed buildings by using additional braces and/or viscoelastic dampers. Earthquake Engineering & Structural Dynamic Journal 40:155-174.
- Petti L, Iuliis DM (2008) Torsional seismic response control of asymmetric-plan systems by using viscous dampers. Engineering Structures 30: 3377-3388.
- Base isolation and damping devices (2011) University of Canterbury Research Report. ENG ACA.0010 Final 34: 18-28.
- Ajrab JJ, Pekcan G, Mander JB (2004) Rocking Wall-Frame Structures with Supplemental Tendon Systems.
- SubramaniT, Jothi J, KavithaM (2014)Earthquake Analysis of Structure by Base Isolation Technique in SAP. Int Journal of Engineering Research and Applications4: 296-305.
- Patil SJ, Reddy GR(2012) State Of Art Review-Base Isolation Systems for Structures. International Journal of Emerging Technology and Advanced Engineering 2: 438-453.
- Kelly T (2009) Tentative Seismic Design Guidelines for Rocking Structures. Bulletin of the New Zealand society for earthquake engineering 42: 239-274.
- Ma QT, Butterworth JW (2012) Simplified Expression for Modelling Rigid Rocking Structures on two-Spring Foundations. Bulletin of the New Zealand society for earthquake engineering 45: 31-39.
- Markis N, Vassiliou M (2015) The Dynamics of the Rocking Frame. Seismic Assessment, Behavior and Retrofit of Heritage Buildings and Monuments, Computational Methods. In Applied Sciences.
- http://www.gfrcconstruction.com/
- http://www.makmax.com/business/etfe_advantages.html
- Code IS Standard no 2800 (2014) Iranian code of practice for seismic resistant design of buildings. (4thedn), Building and Housing Research Center.
- PEER Strong Motion Database (2015) Pacific earthquake engineering research center.
Relevant Topics
- Architect
- Architectural Drawing
- Architectural Engineering
- Building design
- Building Information Modeling (BIM)
- Concrete
- Construction
- Construction Engineering
- Construction Estimating Software
- Engineering Drawing
- Fabric Formwork
- Interior Design
- Interior Designing
- Landscape Architecture
- Smart Buildings
- Sociology of Architecture
- Structural Analysis
- Sustainable Design
- Urban Design
- Urban Planner
Recommended Journals
Article Tools
Article Usage
- Total views: 6863
- [From(publication date):
April-2017 - Aug 24, 2025] - Breakdown by view type
- HTML page views : 5719
- PDF downloads : 1144

