Study on Groundwater Quality around Saroornagar Mandal in Hyderabad, Telangana
Received: 03-Jul-2018 / Accepted Date: 23-Jul-2018 / Published Date: 31-Jul-2018 DOI: 10.4172/2157-7617.1000483
Keywords: Calcium hardness; Parameters; Ground water; Chloride; Analysis
Introduction
Hyderabad is the sixth largest city in India and has the population of 67,31,790 [1] that demands huge quantity of water to fulfill the various activities. It is a well-known fact that ground water recharge has always been linked with surface water. The city has two major water bodies, such as Hussain Sagar lake and Mir Alam Tank that are situated within the corporation limits. Also, there are some smaller lakes located at Nallakunta, Jubilee Hills, Ramanthapur and other places. In addition, Musi river is the other source of water flows through an area subjected to occasional torrential rains. There are two dams built on the Musi river that are Osman Sagar and Himayat Sagar. Both of the reservoirs constitute the major drinking water sources for Hyderabad. The major sources of surface water to Hyderabad are given in detail in Table 1 with capacity of water drawl and type of treatment [2] (Figure 1).
| Sources | Normal Drawls (in MGD) |
Present Drawls (in MGD) |
System Mode | Water Treatment Plant |
|---|---|---|---|---|
| Osmansagar | 25 | 0.00 | Gravity | Asif agar filter beds |
| Himayathsagar | 15 | 0.00 | Gravity | Miralem filter beds |
| Singanoor | 75 | 75.00 | Gravity/Pumping | Peddapur pH-3,4 |
| Manjra | 45 | 30.00 | Gravity/Pumping | Rajampet,Kalabgoor |
| Akkampally (Krishna pH-1,2,3) | 270 | 226 | 3 StagePumping | Kodandlapur filter beds |
| Sripada Yellampally (Godavari) | 86.00 | 56.00 | Godavari | |
| Total | 516 | 387 |
Table 1: Sources of surface water in Hyderabad.
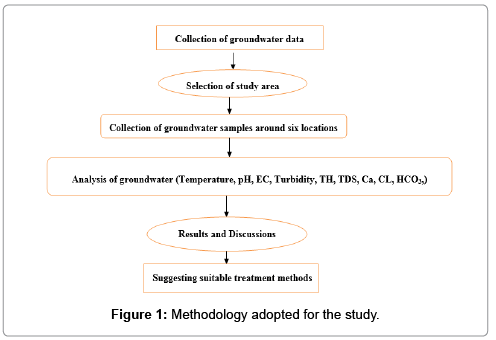
Figure 1: Methodology adopted for the study.
Methodology
Description of study area
Hyderabad has a tropical wet and dry climate bordering on a hot semi-arid climate. The annual mean temperature is 26.6°C (79.9°F); monthly mean temperatures is 21–33°C (70–91°F). The ground water level of the city shows considerable variations during the year with a depth of around 10 to 15m in the summer months and depth of around 2 m to 8 m during the monsoon months. Among 37 mandals of Rangareddy district in Hyderabad, saroor nagar mandal serves as the second largest one that consists of many towns and villages [3]. Hence saroor nagar has been chosen as the study area. Six sampling locations in this mandal were selected based upon the population and the nature of living, which are given in Tables 2 and 3. The present scenario of ground water levels in the study area is shown in the following Figure 2.
| Town | Population |
|---|---|
| LB nagar | 261987 |
| Bhupesh nagar | 27,461 |
| TKR College | 9000 |
| Nandhi hills | 15,913 |
| Badangpet | 12,740 |
| Balapur | 20,700 |
Table 2: Towns and villages in Saroornagar Mandal of Rangareddy district.
| Sampling Stations | Code |
|---|---|
| LB nagar | L1 |
| Bhupesh nagar | L2 |
| TKR college | L3 |
| Nandhi hills | L4 |
| Badangpet | L5 |
| Balapur | L6 |
Table 3: Description of sampling stations.
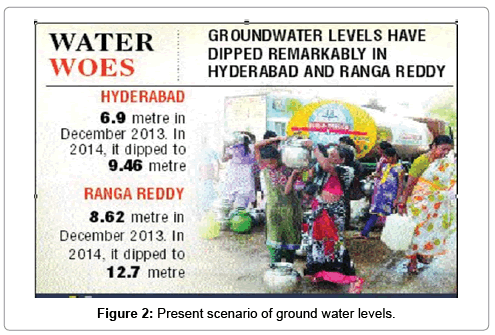
Figure 2: Present scenario of ground water levels.
Lal Bahadur Nagar is called as L. B. Nagar, it is a commercial and residential hub in Hyderabad, Telangana, India. This is located at main entrance for Hyderabad when approaching the city from eastern direction through Vijayawada highway NH 65. Bhupesh Guptha Nagar is located in Jillelaguda of Hyderabad City. TKR College is located in medbowli area of Meerpet municipality, Hyderabad. The college campus is spread over an area of 15 acres of land and having a strength of more than 9000 students and faculties. The other area, Nandhi hills is located at a distance of 2 km from TKR College and spread over an area of 15 sq.km within the Meerpet municipality, Hyderabad. Badangpet is a Nagar Panchayath located in Saroornagar mandal of Rangareddy district of Telangana. India. Last location, Balapur is a suburb in Ranga Reddy district of the Indian state of Telangana, which is located in Balapur mandal of Kandukur revenue division. Also, Table 2 explains in detail about towns and villages of Saroornagar Mandal [4-7].
Location of sampling stations
Ground water samples were directly collected from hand pump - bore well having a depth of 150 -250ft. Totally, 12 water samples were collected during both monsoon (6 samples in pre-monsoon and 6 samples in post monsoon). The grab sampling techniques was used to collect samples, preservations and analysis were carried out as per the standard methods [8-10].
Polyethylene bottle where used to collect samples, after the sample collection, it was transported to Teegala Krishna Reddy College of Engineering and Technology for preservation and analysis. Nine Physico-chemical parameters were analysed to check the quality of ground water such as Temperature, pH, EC, Total dissolved solids, Total hardness, Calcium hardness, Turbidity, Chlorides and Bicarbonate (Table 3).
Results and Discussion
Drinking water quality standard- BIS 10500 (1991) is given in Table 4. The water quality data of 12 samples at six locations is presented in Tables 5 and 6. Ground water quality analysis report mentioned in Tables 4 and 5 reveals that pH value of ground water were occurring in the ranges of 6.2 to 6.9 for all samples, which are within the permissible range as per water quality Standards. The Electrical Conductivity (EC) Values of ground water were in the ranges of 479-2255 μS/cm. The highest value of 2255 EC was recorded in sampling location at Bhupeshpur during post monsoon. The other 11 samples showed lower EC values within the permissible limits. Total Hardness is reported in terms of calcium carbonate, it ranges from 300 to 390 mg/L for all 12 samples and are within the permissible limit. Total dissolved solids are in the ranges of 214 to 308 mg/L for all samples and are within the permissible limit. The minimum and maximum values of Calcium in the six locations are 75 and 271 mg/L, respectively. Out of which, 4 samples are recorded higher values of calcium that is more than 200 mg/L and higher than the permissible limits of BIS standard. The values of Chloride for all the samples were in the range of 173 to 239 mg/L, which are within the permissible limit. Bicarbonates are the primary source of Carbonate and the dissolved form of carbon dioxide (CO2) in rain. The values of bicarbonates in all the samples were in the ranges of 170 to 280 mg/L, which are within the desirable limit [11-14].
| S. No | Characteristic | Requirement (desirable) | Permissible limit |
|---|---|---|---|
| 1 | Temperature(°C) | ||
| 2 | pH value | 6.5 to 8.5 | 6.5 to 8.5 |
| 3 | EC (μm/cm) | 0.25-1 | |
| 4 | Turbidity,NTU,Max | - | 10 |
| 5 | Total Hardness as CaCo3, max mg/l | 300 | 600 |
| 6 | Calcium as Ca, mg/l,max | 75 | 200 |
| 7 | Dissolved Solids, mg/l, max | 500 | 2000 |
| 8 | Chlorides as Cl,max mg/l | 250 | 1000 |
| 9 | Bicarbonate | 200-600 |
Table 4: BIS 10500 (1991) standard of drinking water.
| S. No | Parameters | L1 | L2 | L3 | L4 | L5 | L6 |
|---|---|---|---|---|---|---|---|
| 1. | Temperature (°C) | 24.1 | 22 | 23 | 25.2 | 21.9 | 24.7 |
| 2. | pH | 6.8 | 6.3 | 6.4 | 6.6 | 6.8 | 6.2 |
| 3. | EC (μm/cm) | 1580 | 1970 | 620 | 430 | 1185 | 595 |
| 4. | Turbidity (NTU) | 1.3 | 0.5 | 1.1 | 1.3 | 2.2 | 1.5 |
| 5. | Total hardness (mg/l) | 318 | 325 | 309 | 312 | 303 | 306 |
| 6. | Total dissolved solids (mg/l) | 256 | 268 | 292 | 218 | 214 | 259 |
| 7. | Calcium (mg/l) | 65 | 153 | 182 | 169 | 224 | 253 |
| 8. | Chlorides (mg/l) | 188 | 220.4 | 185.9 | 246.6 | 185.4 | 175.9 |
| 9. | Bicarbonate | 187.5 | 273 | 172.3 | 190.2 | 199 | 180.2 |
Table 5: Ground water quality-pre-monsoon.
| S. No. | Parameters | L1 | L2 | L3 | L4 | L5 | L6 |
|---|---|---|---|---|---|---|---|
| 1. | Temperature (°C) | 26 | 25 | 27 | 25.06 | 26.27 | 25 |
| 2. | pH | 6.5 | 6.2 | 6.30 | 6.9 | 6.9 | 6 |
| 3. | EC (μm/cm) | 1625 | 2255 | 697 | 479 | 1258 | 645 |
| 4. | Turbidity (NTU) | 1.2 | 0.4 | 0.9 | 1.0 | 1.8 | 0.8 |
| 5. | Total hardness (mg/l) | 328 | 336 | 328 | 320 | 396 | 316 |
| 6. | Total dissolved solids (mg/l) | 256 | 268 | 292 | 218 | 214 | 308 |
| 7. | Calcium (mg/l) | 75 | 166 | 198 | 179 | 249 | 271 |
| 8. | Chlorides (mg/l) | 196.4 | 226.42 | 194.93 | 239.92 | 173.44 | 194.93 |
| 9. | Bicarbonate | 197.5 | 280 | 162.5 | 185 | 201 | 176 |
Table 6: Ground water quality-post monsoon.
Effects of Calcium
Calcium and magnesium the two most common minerals that dissolve in water and make water as "Hard." The degree of hardness becomes greater as the calcium and magnesium content increases and is related to the concentration of multivalent cations dissolved in the water. Hard water interferes with almost every cleaning task from laundering and dishwashing to bathing and personal grooming. Clothes laundered in hard water may look dingy and feel harsh and scratchy. Dishes and glasses may be spotted when dry. Hard water may cause a film on glass shower doors, shower walls, bathtubs, sinks, faucets, etc. Hair washed in hard water may feel sticky and look dull. Water flow may be reduced by deposits in pipes. Water hardness causes cardiovascular disease in human beings [15] (Figure 3).
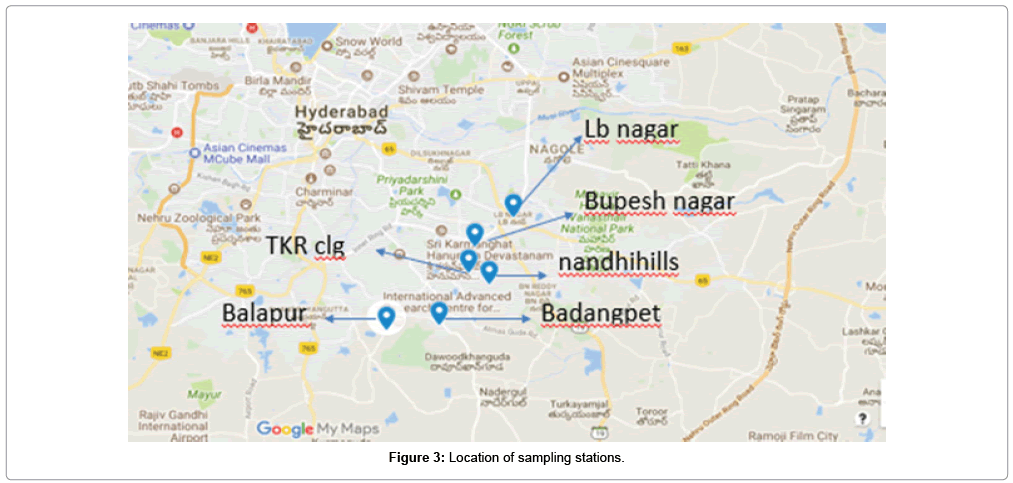
Figure 3: Location of sampling stations.
Conclusion
The extent of study area of Saroornagar sub-basin is 40.5 sq.km, out of which an area of 4.06 sq.km has covered in this study and distributed into 6 different locations. It was found that the ground water quality at badangpet (L5) and Balapur (L6) loacations have been deteriorated by higher concentration of calcium. In other four study areas L1 to L4, the groundwater quality is well within standard limit. Similarly, Ground water quality at Bhubesh nagar (L2) location has been deteriorated with higher solid content, which was reflected in EC values. The Greater Hyderabad Municipal Corporation (GHMC) must take appropriate measure to treat the groundwater before its supply to public by reducing calcium level.
References
- Saraswathi B, Radhika P, Vinoda Y (2016) Assessment of ground water quality of LB Nagar, Hyderabad and Impacts of Industries Closure. International Journal of Scientific & Engineering Research (IJSER) 7: 1315-1319.
- Syeda AU, Nurul H (2013) Assessment and evaluation of the quality of drinking water at the consumer end- A study of Hyderabad, Andhra pradesh, International Journal of Plant, Animal and Environmental Sciences 3: 50-54.
- Gogana V (2014) Analytical study on effects of water quality parameters using remote sensing & GIS under Hyderabad urban area Zone-V. Int J Res Eng Technol 3: 308-316.
- Samba SR, Manjunath A, Ramesh K, Hima Bindu Y, Sarada Devi M (2017) Assessment of ground water quality Saroornagar Mandal, Rr District, Telangana State. International Journal of Creative Research Thoughts (IJCRT) 5: 777-786.
- Saraswathi B (2015) Ground water quality of LB Nagar, Hyderabad and Impact of Industries Closure. International Journal of Scientific and Research Publications (IJSRP) 5: 1-3.
- Sridhar A, Seeta Y, Rao PLKM, Manikya P (2015) Impact of urbanization on groundwater In Central Basin of Hyderabad, Telangana State - India, International Journal of Advancements in Research & Technology (IJOART) 4: 42-46.
- Sarala C, Ravi Babu P (2012) Assessment of groundwater quality parameters in and around Jawaharnagar, Hyderabad. International Journal of Scientific and Research Publications (IJSRP) 2: 1-6.
- Ramamohan K, Patode RS (2013) Assessment of groundwater quality - A case study of Kondapur Mandal, Medak District, Andhra Pradesh. Current World Environment 8: 267-273.
- Srinivasamoorthy K, Chidambaram S, Prasanna MV, Vasanthavihar M, et al. (2008) Identification of major sources controlling groundwater chemistry from a hard rock terrain-A case study from Mettur Taluk. J Earth Syst Sci 117: 49-58.
- Brindha K, Rajesh R, Murugan R, Elango L (2010) Fluoride contamination in groundwater in parts of Nalgonda District. Environ Monit Assess 172: 481-492.
- Niranjan kumar K, Reddya AGS, Mallikarjuna R, Srinivas K (2009) Preliminary investigations of ground water quality in Hyderabad City. Int J Chem Sci 7: 59-70.
- Sudhakar M, Mamatha P (2004) Water quality in sustainable water management. Current Science 87: 942-947.
- Bureau of Indian Standards (BIS) IS 10500 (1991) Drinking water-specification (p. 8) (6th reprint, 2004). New Delhi: BIS, India.
Citation: Arulneyam D, Premsudha R (2018) Study on Groundwater Quality around Saroornagar Mandal in Hyderabad, Telangana. J Earth Sci Clim Change 9:483. DOI: 10.4172/2157-7617.1000483
Copyright: © 2018 Arulneyam D, et al. This is an open-access article distributed under the terms of the Creative Commons Attribution License, which permits unrestricted use, distribution, and reproduction in any medium, provided the original author and source are credited.
Select your language of interest to view the total content in your interested language
Share This Article
Recommended Journals
Open Access Journals
Article Tools
Article Usage
- Total views: 7834
- [From(publication date): 0-2018 - Dec 11, 2025]
- Breakdown by view type
- HTML page views: 6849
- PDF downloads: 985