tFRAP: A FRAP-Based Technique to Monitor Protein Translation in Living Cells
Received: 27-Nov-2017 / Accepted Date: 04-Dec-2017 / Published Date: 18-Dec-2017 DOI: 10.4172/2155-9872.1000390
Abstract
Traditionally, studies on protein translation rely on systems, in which cells have been lysed prior determination of levels of the protein of interest. However, these assays do not reflect the protein synthesis in living cells in real time, but analyze protein levels after a given incubation time, leading to limitations in results based on experimental parameters. To overcome this problem, we have previously established a Fluorescence recovery after photobleaching (FRAP)-based technique to monitor protein translation in living cells. For this, the protein of interest fused to green fluorescent protein (GFP) is expressed in cell lines. After bleaching the entire cell, the fluorescent signal of the protein of interest is lost, allowing to capture the signal recovery of newly translated GFPtagged protein over time. Here we present two improved versions of this technique using different fluorescent dyes: tFRAP (translational FRAP). For the first improved version of tFRAP we have inserted a second fluorescent dye, red fluorescent protein (RFP), into the same expression vector that drives expression of the protein of interest fused to GFP driven by a second promoter. For the second improved version of tFRAP we have fused our protein of interest to a photo-switchable dye, Dendra2. Both improved versions allow to correct the fluorescence signal intensity of the protein of interest for different transfection rates of individual cells. These two advanced techniques are new powerful tools for quantifying translation rates in living cells and will be useful in future studies on mRNA translation.
Keywords: Translation; mRNA; Live cell; Flourescence recovery after photobleaching
Introduction
The central dogma of biology describes the translation of the genetic information on the DNA that is transcribed into RNA, which serves as a template for protein synthesis [1-3]. This process is tightly regulated and fine-tuned. Several RNA-binding proteins control the process of protein translation from a messenger RNA. To investigate the process of protein translation and to test the effect of specific RNAs, RNAbinding proteins, or translation modifying drugs, it is important to have tools to monitor translation. Several different tools that monitor translation are available. For example, an RNA of interest can be in-vitro transcribed and subjected to in-vitro translation using for example rabbit reticulocyte lysate [4] or wheat germ extract. A different approach is to use reporter assays, in which for example a luciferase reporter is linked to the protein of interest, and serves as a measurement of the amount of protein that has been produced (for example Promega Dual-Luciferase Reporter Assay System). Alternatively, to test if the protein half-life time is affected after a given treatment, time-course experiments with the translation inhibitor cycloheximide (CHX) can be done and the protein level of a protein of interest can be measured on western blots. However, these assays do not reflect the protein synthesis in living cells in real time, but analyse protein levels after a given incubation time. This can be difficult if the experimental parameters are chosen such that the assay reaches saturation before the incubation time is over, or only transient effects on the translation occur. In these cases, it might be difficult to detect differences. Additionally, if a reduction in reporter activity is observed, this can also be caused by either an increased degradation of the reporter protein rather than a reduced translation rate or by an effect on the activity of the reporter itself (e.g., the luciferase activity). Therefore, for research projects investigating protein translation, it would be most suitable to have an assay that monitors protein synthesis in living cells in real time. This would not only give us the protein level at a given time-point but also shed light on the kinetics of the translation process. To achieve this several approaches using fluorescently labeled proteins, the translation of which can be monitored via fluorescence microscopy, have been newly developed [5-10], including an assay that monitors translation of GFP-tagged proteins in living mammalian cell cultures, which we have developed previously [11]. For this, we have cloned the RNA of interest downstream of green fluorescent protein (GFP) into an expression vector and transfected these constructs into cell lines. In these cells the GFP signal of protein that was present in the cell was bleached with a high intensity 488 argon laser in the entire cell. After bleaching the GFP signal was imaged every 5 min for 220 min. The recovering GFP signal correlates to freshly translated GFP-tagged protein. For the analysis the GFP signal of every cell was analyzed as the sum of the pixel over the area of the cell. Transiently transfected cells can ingest different amounts of plasmids. The more plasmid is taken up, the higher is the protein production rate. This makes it difficult to compare the signal recovery of individual cells. Therefore, to normalize the results of each cell, the second frame after bleaching was set as point zero and put to 100%. To overcome the problem of different transfection rates of individual cells, we here present two new versions of tFRAP and compare them to our previously described version. For the first version we have inserted a second fluorescent dye, red fluorescent protein (RFP), into the same expression vector that drives expression of the GFP-tagged protein of interest, driven from a different promoter. The RFP signal is used to normalize the GFP signal, allowing correction for different transfection rates of individual cells. For the second version of tFRAP we have fused our protein of interest to Dendra2. Dendra2 is a monomeric, green-to-red photoswitchable fluorescent protein derived from Octocorallia that has been optimized for maturation and a bright fluorescence both before and after photoswitching [12]. Its codon usage is optimized for high expression in mammalian cells. At the starting time-point of our live-cell imaging we photoswitch all Dendra2- tagged protein of interest from green to red signal. We then use the red fluorescence signal intensity for normalization of freshly translated green fluorescent protein to correct for different transfection rates of individual cells.
Here we describe a detailed protocol of these two improved versions of tFRAP. This method is inexpensive, and, apart from a confocal microscope equipped with an incubator, does not require any special equipment. tFRAP is a powerful tool for quantifying translation rates and kinetics and studying the influence of specific regulatory genes or compounds on protein translation in living cells.
Materials and Methods
Plasmids/Cloning
Conventional tFRAP: For the previously established version of tFRAP [11] we used our previously described pEGFP-C1-HTT exon1 constructs, in which huntingtin (HTT) exon1 was cloned into the multiple cloning site of pEGFP-C1 using the restriction enzymes PstI and XhoI. HTT exon1 contained 49CAG repeats (Figure 1A).
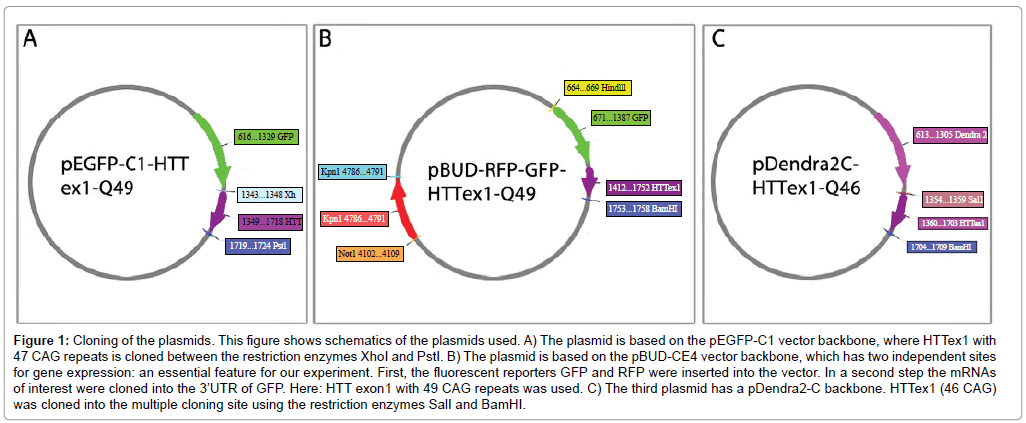
Figure 1: Cloning of the plasmids. This figure shows schematics of the plasmids used. A) The plasmid is based on the pEGFP-C1 vector backbone, where HTTex1 with 47 CAG repeats is cloned between the restriction enzymes XhoI and PstI. B) The plasmid is based on the pBUD-CE4 vector backbone, which has two independent sites for gene expression: an essential feature for our experiment. First, the fluorescent reporters GFP and RFP were inserted into the vector. In a second step the mRNAs of interest were cloned into the 3’UTR of GFP. Here: HTT exon1 with 49 CAG repeats was used. C) The third plasmid has a pDendra2-C backbone. HTTex1 (46 CAG) was cloned into the multiple cloning site using the restriction enzymes SalI and BamHI.
tFRAP improved version 1: As a backbone the pBudCE4 Vector (ThermoFisherScientific) was used, because it allows the expression of two genes driven from two different promoters (CMV and human EF-1α promoter). We used the CMV site to introduce GFP fused to HTT exon 1 with 49 CAG repeats into the vector (primers used see Supplementary Table 1) using the restriction enzymes HindIII and BamHI. Three stop codons at the end of the GFP sequence were inserted such that the HTT exon1 sequence was located in the 3’UTR of GFP. This allows measurement of effects of the HTT exon1 sequence on the RNA level, without having site-effects that might occur when translating the expanded CAG repeat into a polyglutamine stretch. Afterwards, we inserted the RFP sequence into the EF-1α promoter site using the restriction enzymes KpnI and NotI (Figure 1B).
tFRAP improved version 2: As a backbone the pDendra2-C Vector (Clontech) was used. We introduced HTT exon 1 with 46 CAG repeats into the multiple cloning site to obtain Dendra2-tagged HTT exon1 using the restriction enzymes SalI and BamHI (Figure 1C, primers used see Supplementary Table 1).
Cell culture
For the experiments shown here HeLa cells were used. Cells were cultured in DMEM Medium containing 10% FCS and were kept at 37°C and 5% CO2. 1 × 10³ HeLa cells were seeded per well of an 8-well chambered cover glass (Nunc/Thermo Fisher Scientific, 115411) oneday prior transfection. Transfections were done with PolyFect (Qiagen) according to the manufacturer’s instructions. After transfection cells were incubated for 24 h at 37°C at 5% CO2. To inhibit translation, the translational inhibitor cycloheximide (CHX) was added to the culture medium prior imaging (100 μg/ml). Of note, tFRAP can be done in diverse cell lines, however, transfection protocols as well as bleaching and imaging parameters should be optimized for each cell line.
Imaging
For all three versions of tFRAP we measured transfected cells using a Zeiss LSM700 inverted microscope (provided by the light microscope facility, DZNE Bonn) equipped with an incubator for longterm temperature and CO2 control (PeCon). In such a setting without focus device it is recommended to use a large microscope incubator that was preheated at least 2 hours before the experiments are started. Alternatively, other set-ups with hardware-based focus drift correction can be used. For the different versions of tFRAP different lasers and different bleach parameters were used as specified below. In all assays the simultaneously imaged transmitted light channel was used to check the morphology of the cells. During the whole experiment the pinhole was open, since the whole cell should be imaged (not only one optical section). To run a multi position FRAP-based live cell imaging the microscope needs features to bleach (i.e. scanning a defined region using different excitation settings like laser power or scan speed), remember different positions and perform a time series. Here, we used the ZEN software version 2009 in combination with the Multi Time Series PLUS ZEN 2009-2010-20 macro from Zeiss. Alternatively, single position FRAP measurements can also be done without such multi time series macro. Transfected cells were chosen, their position marked and regions of interest (ROI) were defined for bleaching. The size and shape of the ROI were chosen such that they covered the whole cell. Up to 40 cells per experiment were chosen.
Conventional tFRAP: A 488 nm excitation laser was used for measurement over a time period of 4 h in 2% intensity. For the bleaching step parameters were set to achieve a 30-70% bleaching effect with the 488 nm laser in a high intensity of 70% (25 iterations, pixel dwell time 6.3 μsec). The experiment consisted of three blocks: in block 1, one initial picture before bleaching (pre-bleach) was taken, block 2 contained the bleaching as well as taking a picture directly after bleaching (post-bleach) and block 3 consisted of a time lapse with an image taken every five minutes for four hours.
tFRAP improved version 1: 488 nm and 555 nm excitation lasers were used for measurement over a time period of 4 h in 2% intensity. For the bleaching step parameters were set to achieve a 30-70% bleaching effect with the 488 nm laser in a high intensity of 75% (25 iterations, pixel dwell time 6.3 μsec). The experiment consisted of three blocks: in block 1 one pre-bleach picture was taken, block 2 contained the bleaching as well as taking a post-bleach picture and block 3 consisted of a time lapse with an image taken every five minutes for four hours.
tFRAP improved version 2: 488 nm and 555 nm excitation lasers were used for measurement over a time period of 4 h in 2% intensity. For the photoswitching step parameters were set to achieve a clear switch of green signal to red signal using the 405 nm laser at a high intensity of 80% (3 iterations, pixel dwell time 50.42 μsec). The experiment consisted of three blocks: in block 1 three pre-photoswitching pictures were taken, block 2 contained the photoswitching as well as taking a post-photoswitching picture and block 3 consisted of a time lapse with an image taken every five minutes for four hours.
To rule out that imaging-dependent bleaching of the green signal occurred, we did a control experiment, in which we took 48 pictures (one picture every 5 seconds) of a cell that was not bleached. Importantly, signal intensity did not decrease significantly.
Analysis
The lsm files were opened and analyzed with the Fiji [13] distribution of ImageJ software. Cells changing morphology visibly were excluded from analysis, so were cells changing their area considerably over time, because both can lead to changes in fluorescence that are not due to translation. Channels were split and the fluorescence intensity in each cell for green fluorescence for all time-points and for red fluorescence for at time point zero (t=0) for the two improved versions of tFRAP was quantified. For automated cell region detection and fluorescence quantification we used a customized ImageJ macro performing following signal processing steps: First, a rectangular region containing a single cell was selected manually. Within this subset, the cell region was detected for each time frame on basis of the reference channel (i.e. the red emission channel). First, images were smoothed with a median filter in space and time (radius xy: 4 pixels, radius t: 3 pixels). Second, image regions were classified into cell region and background by applying the default automatic threshold [14] of ImageJ for each time frame. Finally, average cell region intensities for both reference and measurement channel were collected over time and exported to a spread sheet. This macro as well as a tutorial how to use it are available (supplementary data). For the two improved versions of tFRAP the intensity of the green signal was normalized to red at time point zero (t=0). Of note, for conventional tFRAP as well as for the improved version 1 the first 5 minutes after bleaching are excluded from the analysis, since an initial recovery of some fluorescence due to diffusion in the cell is occurring after the first minutes of measurement.
We analyzed the time series of cell intensities by fitting a linear regression model to the time series. The intercept was controlled for each time series. The slope parameter was fitted per treatment and then tested against the slope of the control using a Welch's t-test for unequal variances. Statistical analysis can be performed for example using the GraphPad Prism software.
Results and Discussion
We developed conventional tFRAP as a tool to analyze mRNA translation in living cells. Here we introduce two novel improved versions of tFRAP and compare them to conventional tFRAP. For conventional tFRAP the protein of interest is fused to a GFP-tag. For the improved version 1 of tFRAP the cDNA of interest is cloned into a plasmid that has two different promoters: one promoter driving the expression of the protein of interest fused to GFP, and one promoter driving the expression of RFP. For the improved version 2 of tFRAP the protein of interest is fused to the photoswitchable dye Dendra2. As example for any protein of interest we have used here HTT exon1. Plasmids described above (Figure 1) were transfected into HeLa cells. The analysis was then done on a confocal microscope equipped with an incubator for long-term temperature and CO2 control. Transfected cells were identified by red and green fluorescent signals. For conventional tFRAP (Figure 2) as well as improved version 1 (Figure 3) the GFP signal was bleached to remove the signal of protein that was already translated at starting time point. For the improved version 2 of tFRAP (Figure 4) the green fluorescent protein already present at the starting time-point of the experiment was photoswitched into red fluorescent signal. Then the signal recovery of green fluorescence was measured over a time frame of 220 min post bleach in all three experimental settings. The accumulating green signal is made up by the newly translated protein, in our examples HTT exon1.
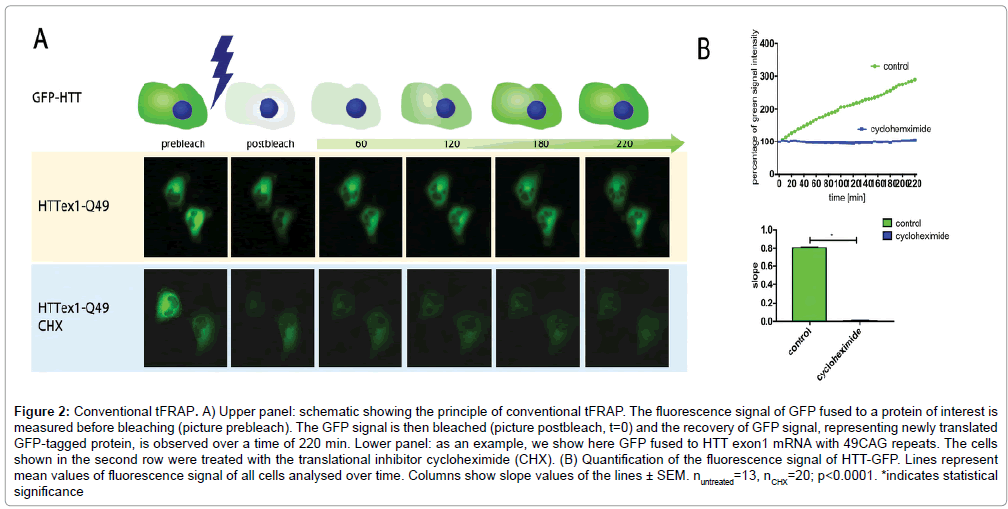
Figure 2: Conventional tFRAP. A) Upper panel: schematic showing the principle of conventional tFRAP. The fluorescence signal of GFP fused to a protein of interest is measured before bleaching (picture prebleach). The GFP signal is then bleached (picture postbleach, t=0) and the recovery of GFP signal, representing newly translated GFP-tagged protein, is observed over a time of 220 min. Lower panel: as an example, we show here GFP fused to HTT exon1 mRNA with 49CAG repeats. The cells shown in the second row were treated with the translational inhibitor cycloheximide (CHX). (B) Quantification of the fluorescence signal of HTT-GFP. Lines represent mean values of fluorescence signal of all cells analysed over time. Columns show slope values of the lines ± SEM. nuntreated=13, nCHX=20; p<0.0001. *indicates statistical significance
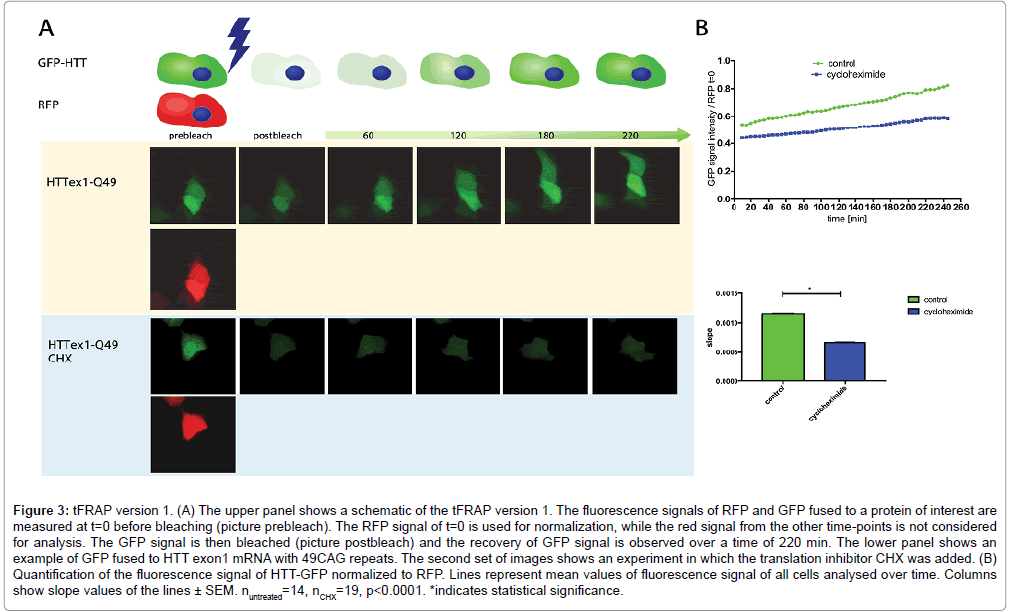
Figure 3: tFRAP version 1. (A) The upper panel shows a schematic of the tFRAP version 1. The fluorescence signals of RFP and GFP fused to a protein of interest are measured at t=0 before bleaching (picture prebleach). The RFP signal of t=0 is used for normalization, while the red signal from the other time-points is not considered for analysis. The GFP signal is then bleached (picture postbleach) and the recovery of GFP signal is observed over a time of 220 min. The lower panel shows an example of GFP fused to HTT exon1 mRNA with 49CAG repeats. The second set of images shows an experiment in which the translation inhibitor CHX was added. (B) Quantification of the fluorescence signal of HTT-GFP normalized to RFP. Lines represent mean values of fluorescence signal of all cells analysed over time. Columns show slope values of the lines ± SEM. nuntreated=14, nCHX=19, p<0.0001. *indicates statistical significance.
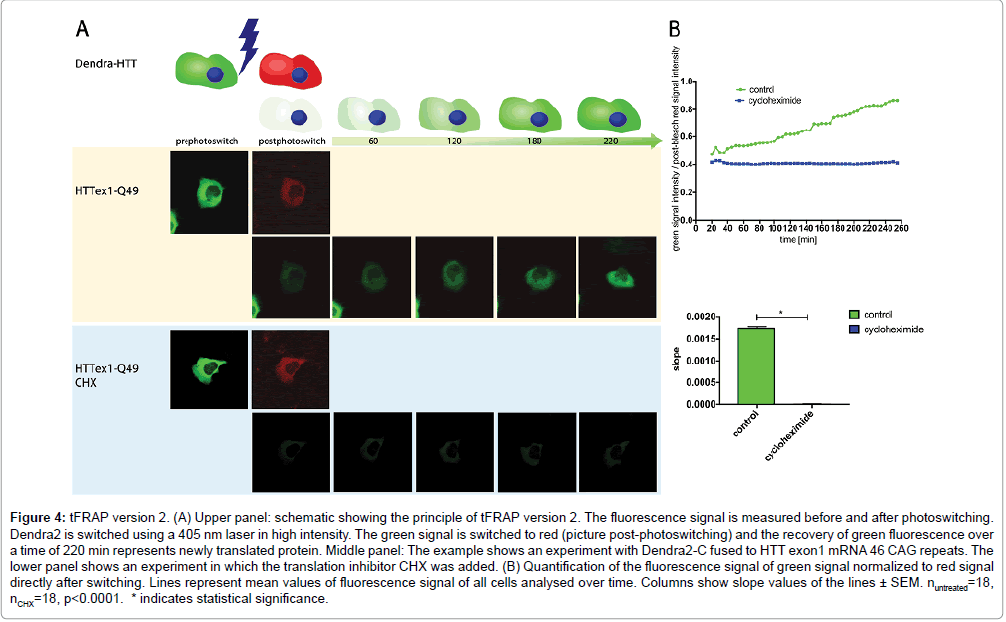
Figure 4: tFRAP version 2. (A) Upper panel: schematic showing the principle of tFRAP version 2. The fluorescence signal is measured before and after photoswitching. Dendra2 is switched using a 405 nm laser in high intensity. The green signal is switched to red (picture post-photoswitching) and the recovery of green fluorescence over a time of 220 min represents newly translated protein. Middle panel: The example shows an experiment with Dendra2-C fused to HTT exon1 mRNA 46 CAG repeats. The lower panel shows an experiment in which the translation inhibitor CHX was added. (B) Quantification of the fluorescence signal of green signal normalized to red signal directly after switching. Lines represent mean values of fluorescence signal of all cells analysed over time. Columns show slope values of the lines ± SEM. nuntreated=18, nCHX=18, p<0.0001. * indicates statistical significance.
To proof that the signal recovery indeed represents freshly translated protein, an experiment using the translation inhibitor CHX was done. As expected, treatment of the cells with CHX blocked signal recovery of green fluorescently labelled HTT (Figures 2-4).
Measuring translation in real time in living cells is necessary to study mRNA translation, since analyses of protein levels with other conventional methods give only information about a certain time point leaving changes in kinetics in the dark. Our improved versions of tFRAP fill this gap (Figure 5). Our example of HTT in the presence or absence of a translation inhibitor shows that tFRAP enables us to measure protein translation in real time in living cells and to compare translation rates of protein synthesis under different experimental conditions. While in general measuring translation rates works well with all three versions, the two improved versions have the advantage that the signal in each individual cell can be normalized to compensate for different transfection rates of individual cells. In our hands tFRAP version 3 was most convenient, since here the dye that is used for normalization is not expressed from a different promoter as in tFRAP version 2. With using the photoswitchable dye we therefore can rule out that any possible differences in the usage of the two promoters manipulate the resulting data.
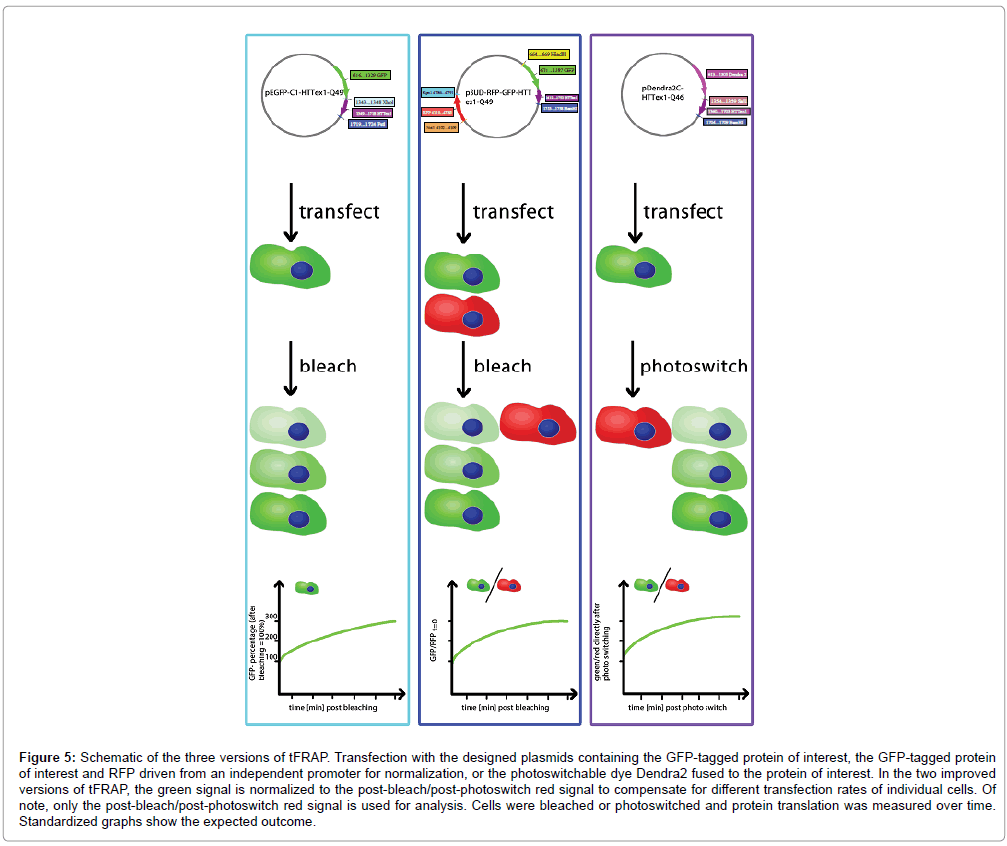
Figure 5: Schematic of the three versions of tFRAP. Transfection with the designed plasmids containing the GFP-tagged protein of interest, the GFP-tagged protein of interest and RFP driven from an independent promoter for normalization, or the photoswitchable dye Dendra2 fused to the protein of interest. In the two improved versions of tFRAP, the green signal is normalized to the post-bleach/post-photoswitch red signal to compensate for different transfection rates of individual cells. Of note, only the post-bleach/post-photoswitch red signal is used for analysis. Cells were bleached or photoswitched and protein translation was measured over time. Standardized graphs show the expected outcome.
We provide here detailed protocols as well as detailed information on data analysis including a macro for fluorescence intensity quantification, which paves the way for the practical usage of tFRAP by everyone.
Acknowledgments
We thank Dr. Erdem Tamgüney (DZNE) and Dr. Walker Jackson (DZNE) for careful review of the manuscript.
References
- Crick F (1970) Central dogma of molecular biology. Nature 227: 561-563.
- Li GW, Xie XS (2011) Central dogma at the single-molecule level in living cells. Nature 475: 308-315.
- Bustamante C, Cheng W, Mejia YX (2011) Revisiting the central dogma one molecule at a time. Cell 144: 480-497.
- Kozak M (1990) Evaluation of the fidelity of initiation of translation in reticulocyte lysates from commercial sources. Nucleic Acids Res 18: 2828.
- Syntichaki P, Troulinaki K, Tavernarakis N (2007) eIF4E function in somatic cells modulates ageing in Caenorhabditis elegans. Nature 445: 922-926.
- Yan X, Hoek TA, Vale RD, Tanenbaum ME (2016) Dynamics of Translation of Single mRNA Molecules In Vivo. Cell 165: 976-989.
- Han K (2014) Parallel measurement of dynamic changes in translation rates in single cells. Nat Methods 11: 86-93.
- Aakalu G, Smith WB, Nguyen N, Jiang C, Schuman EM (2001) Dynamic visualization of local protein synthesis in hippocampal neurons. Neuron 30: 489-502.
- Brittis PA, Lu Q, Flanagan JGÂ (2002) Axonal protein synthesis provides a mechanism for localized regulation at an intermediate target. Cell 110: 223-235.
- Yu J, Xiao J, Ren X, Lao K, Xie XS (2006) Probing gene expression in live cells, one protein molecule at a time. Science 311: 1600-1603.
- Krauss S (2013)Translation of HTT mRNA with expanded CAG repeats is regulated by the MID1-PP2A protein complex. Nat Commun 4: 1511.
- Gurskaya NG (2006) Engineering of a monomeric green-to-red photoactivatable fluorescent protein induced by blue light. Nat Biotechnol 24: 461-465.
- Schindelin J (2012) Fiji: an open-source platform for biological-image analysis. Nat Methods 9: 676-682.
- Ridler T, Calvard S (1978) Picture Thresholding Using an Iterative Selection Method. IEEE Transactions on Systems, Man, and Cybernetics 8: 630-632.
Citation: Griesche N, Pesch V, Nalavade R, Weber S, König I, et al. (2017) tFRAP: A FRAPBased Technique to Monitor Protein Translation in Living Cells. J Anal Bioanal Tech 8: 390. DOI: 10.4172/2155-9872.1000390
Copyright: © 2017 Griesche N, et al. This is an open-access article distributed under the terms of the Creative Commons Attribution License, which permits unrestricted use, distribution, and reproduction in any medium, provided the original author and source are credited.
Select your language of interest to view the total content in your interested language
Share This Article
Open Access Journals
Article Tools
Article Usage
- Total views: 6337
- [From(publication date): 0-2017 - Dec 22, 2025]
- Breakdown by view type
- HTML page views: 5391
- PDF downloads: 946