The Application of Cretaceous Clay Minerals of Mjez El Beb (North-Western Tunisia) in Ceramic Industry
Received: 07-Sep-2015 / Accepted Date: 06-Oct-2015 / Published Date: 16-Oct-2015 DOI: 10.4172/2157-7617.1000308
Abstract
The Cretaceous clays of north-western Tunisia have been studied for their use in the traditional ceramic industry (bricks, tiles and pottery). Mineralogical, chemical, thermal analyses, technological proprieties and grain size distribution were carried out on clay samples collected from Jebel El Moura (BM section) and kef Lasfar-Oued El Jebs (MK section) in the locality of Mjez el Beb. The results showed that these clay minerals are represented mainly by kaolinite associated with illite and smectite. Quartz, calcite, feldspars and hematite were also detected as accessory minerals in the whole rock. The amount silica is convenient for the manufacture of ceramic products. So the prepared mixtures were made without admixture of any variety of silicate. The technology tests revealed that the modelled products had small shrinkage during drying and firing, and a high bending strength. For this reason, the clay mixtures were made without admixture of quartz or any other component. As a result, Mjez el Beb clays have high qualities necessary for the manufacture of tiles and ceramic bricks.
Keywords: Ceramic industry; Clays; Cretaceous; Jebel el Moura; North-western of Tunisia; Technology tests
9053Introduction
Clay minerals likely have a great range of applications, including agriculture (soils that grow plants), oil absorbents, iron casting, animal feeds, pharmaceuticals, drilling fluids, waste water treatment, paint, paper, paint, petroleum industry, cat litter, catalysis, ceramic etc., Their applications are tightly dependent upon their structure, composition, and physical properties [1]. Knowing these characteristics may help to better use in many fields especially in the ceramic industry. In particular, kaolinite and illite are the preferred type of clay for the traditional ceramic industry, since they can be easily moulded, and have a fine g and a moderate plasticity. Besides, they are the purest clays, since they have a low Cation Exchange Capacity (CEC), and therefore very little in composition. Moreover, they do not absorb water and do not expand when they come in contact with water that makes them ideal for industrial applications. These non-swelling clays are widely exposed in many areas, especially in north Tunisia, where a large occurrence of cretaceous clays have been reported in Jebel Mourra (Mjez El Beb, Tunisia) [2]. This raw material is the subject of this research which deals with the physico-chemical properties of two clay mixtures of Mjez el Beb (BM and MK sections) in order to assess the possibility of using them in faience and brick productions (Figure 1).
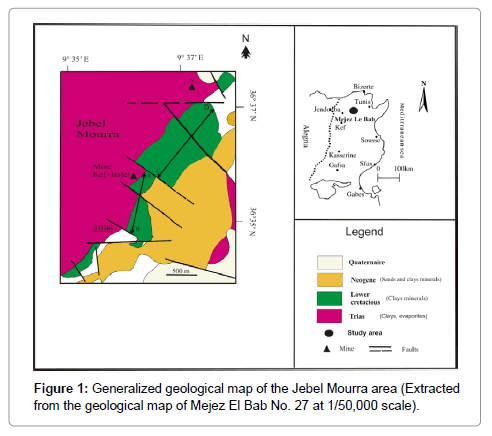
Figure 1: Generalized geological map of the Jebel Mourra area (Extracted from the geological map of Mejez El Bab No. 27 at 1/50,000 scale).
Geological Setting
The study area is located at 8 Km in the south Mjez El Beb city (in the northern Tunisia). It consists of a NE-SW-trending anticline-like structure. Previous studies [3-7] showed that the Triassic gypsiferous cap rock constitutes the core of this structure bounded on its southeastern flank by Cretaceous and Tertiary sediments. These later are cut by NW-SE and SE-NW to E-W faults. This structure is the result of an extensive tectonic regime affecting the north of Tunisia during the Cretaceous resulting from the convergence of African and Eurasian plates. From a paleogeographic perspective, this area belongs to the "Sillon Tunisien" (an E-W to SW-NE Tunisian Trough), which results from the Tethyan rifting events [3]. The Early Cretacous to Early Albian marls and clayey limestones were separated from Late Albian to Paleocene shales and limestones by a regional unconformity [8,9]. Two N-S-trending geological sections, are located in the SE flank of Jebel Mourra, and consist of Cretaceous clay formations (Figure 2). Regarding, El Mouraa outcrops (BM section), a 1700 m thick clayey series of beige and gray to brownish colour containing few beds of fine limestone with beige, and grey patina in breakage (Figure 2a). The series dates to the Early Cretaceous witnessed by the following fauna species: Lenticulina Ouacheniss, Epistomina (Brotzena) djaffaensis [10,11], Globuligerina hoterivica [10-12], Hedbergella tuschepsensis, Leupoldina pustulans, Biglobigernella barri. The lithological series of Kef Lasfar- Oued Jebs (MK section) includes five clay combs varying from beige, greenish to grey in colour, and with a thickness ranging from 150 to 480 m (Figure 2b). Faunistic species namely: Thalmanninella appenninca ballernaensis were found in these tender levels, which let us to attribute these series from Albian to Senonian age. These argillaceous combs contain metre-scale alternations of beige pelagic limestone units.
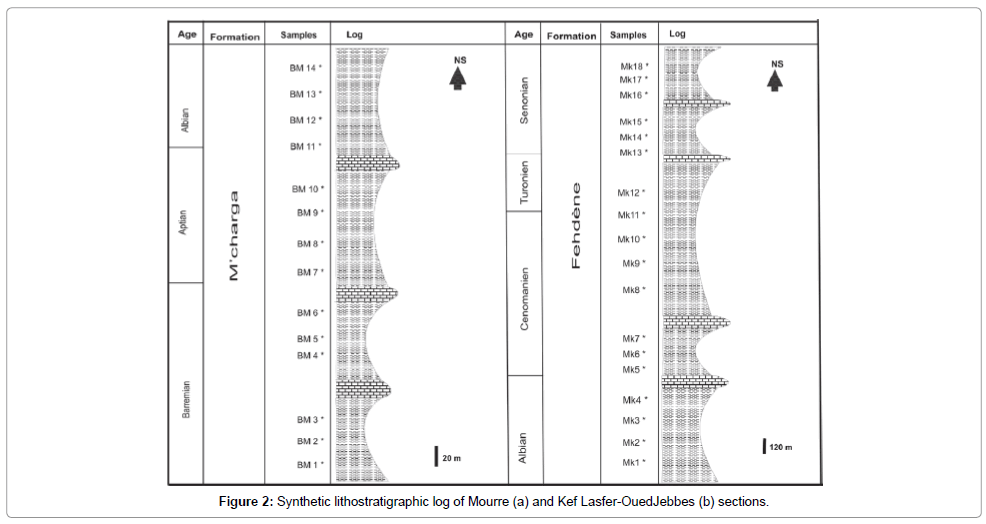
Figure 2: Synthetic lithostratigraphic log of Mourre (a) and Kef Lasfer-OuedJebbes (b) sections.
Materials and Methods
More than 50 Kg of raw materials were collected from this Mjez el Beb clay deposits. Eighteen samples were taken from kef Lasfar- Oued El Jebs section and fourteen specimens were sampled from jebel El Mourra section. One representative mixture for the whole lower Cretaceous clays (BM section) and another one (MK section) of the Upper Cretaceous clay have been considered to define the potential use of these raw materials in the ceramic industry. Therefore, BM and MK clays were used in the ceramic earthen ware, while BM and MK samples were mixed to make up the bricks. The bulk material was initially dried at 60°C for 24 h, and then was gently crushed. Mineralogical analysis was carried out by X-ray diffraction (XRD) using a PANalytical X'Pert Pro diffractometer, operating at 40 kV and 40 mA; and equipped with a Cu Kα radiation (1.5418 Å). The relative abundances of non-clay species was estimated using the heights ratio of the main reflections whereas, clay minerals proportions were determined by measuring the superficies of the "001" reflections. Infrared spectra were obtained using a JASCO FT-IR-420 spectrophotometer. The pressed-discs, we prepared using 1 mg of the selected samples which was diluted with 200 mg KBr. Discs were heated on the oven overnight at 150°C to minimize the water absorption on KBr and the clay powder. Transmittance spectra were recorded in the MIR region 4000 to 400 cm-1. The cation exchange capacity was measured with standard acetate ammonium procedure. Chemical compositions of powdered and pressed clays samples were determined by subjecting them to an electron microprobe equipped with an X-ray dispersive spectrometer (Bruker S4 Pioneer). Samples preparation was realized according to the conventional techniques proposed by Meseguer et al. [13]. The particle-size distribution was obtained by laser granulometry using a MALVERN instrument. Thermal Gravimetric Analysis (TGA) and Differential Thermal Analysis (DTA) were performed with a SETRAM type 124 TG/DTA instrument using aluminium as inert reference material. Temperature was increased from room temperature to 1100°C at the regular increment of 10°C/min in air atmosphere. The expansion and firing shrinkage were measured using the dilatometer Adamel Lhomargy Type DM 15. The powders were heated from room temperature above 1200°C with 10°C/min. The liquid limit (LL), plastic limit (PL) and plastic index (IP), (IP=LL−PL) were determined for each sample in accordance with the French Standard NF P 94-051. The Bigot curve drawn with an Adamel barelattograph is used to characterize the drying process. The ceramic properties, namely moisture content dry shrinkage and dry bending strength were performed on fired products. The linear firing shrinkage, the bending strength and the water absorption for ceramic faience, were obtained from modelling numerous flat pieces (with normative dimensions: 100 mm×50 mm×10 mm). After compacting of 60 g moistened materials (7wt.% moisture content) under 250 bars, the prepared pieces were oven-dried at 105°C until constant weight then fired at 950°C and at 1000°C during 1h. The water absorption for ceramic faience was determined by immersing a specimen of brick in water boiling until constant mass. The water absorption by dipping (Abs) is expressed as a percentage of the dry weight and is calculated by the following relationship: Abs = 100 x (mh - ms)/ms. mh, constant wet mass of the specimen after immersion; ms, constant dry mass of the specimen wiped with an absorbing any water surface rag. The bending strength was measured with a three point flexural method according to the norm [14]. The linear firing shrinkage, the bending strength and the water absorption were carried out for ceramic bricks pieces heated in three stage of temperature: 800°C, 850°C, 900°C, at heating rate 5 ºC/ min and the soaking time 1 hour.
Results and Interpretations
Mineralogy characterization
Particle size: The grading curves of (BM) and (MK) mixtures have a bimodal distribution: a dominant particle-size population having diameters ranging between approximately 30 μm and 25 μm; a second population with diameters lower than 4 μm (Table 1 and Figure 3). The D50 and D90 particle-size represent the median diameters which range between 8.97 μm and 39.47 μm for BM, and 15.77 μm and 48.02 μm for MK. This later is related to the presence of the kaolinite. The fraction below 2 μm corresponds to 40.38% and 38.7% of the whole sample for MK and BM respectively. These values are suitable for the ceramic manufacture.
| Mixtures | D10 | D50 | D90 |
|---|---|---|---|
| BM | 1.50 | 8.97 | 39.47 |
| MK | 2.33 | 15.77 | 48.02 |
Table 1: Particle size distribution.
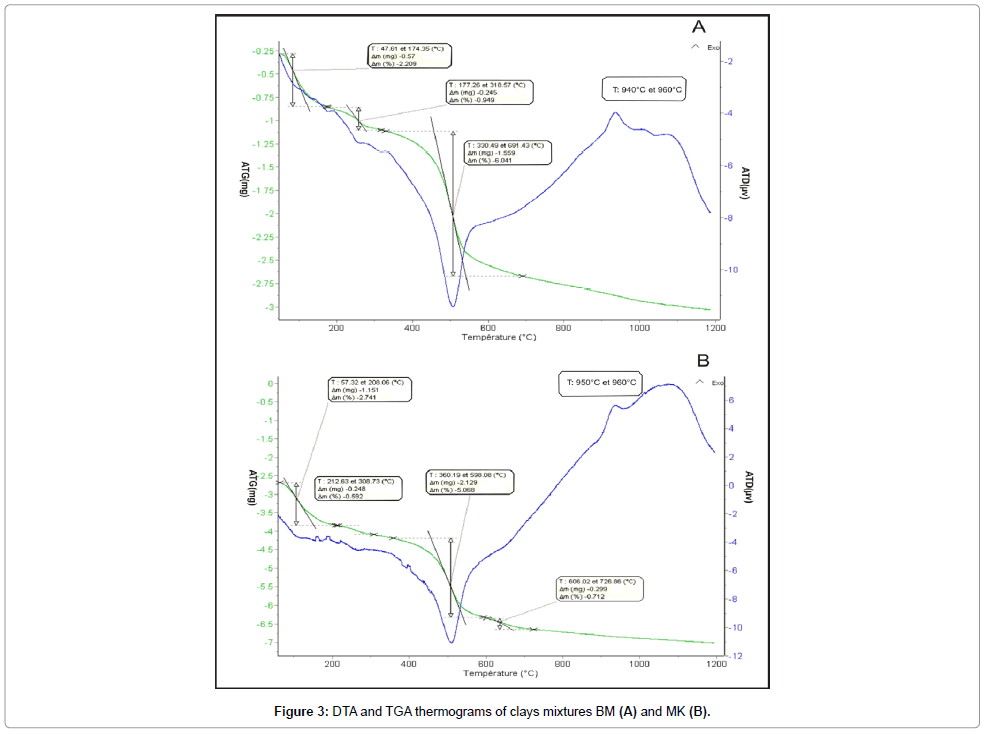
Figure 3: DTA and TGA thermograms of clays mixtures BM (A) and MK (B).
X-ray Diffraction: The results summarized in Table 2 show the predominance of kaolinite (48% for BM and 41% for MK), and smectite (46% for BM and 38% for MK) and low to moderate content of illite (20% for MK and 6% for BM). The mineralogical analysis of the non-clay minerals indicates the presence of quartz (51% in the MK samples and 35% in the BM samples), calcite and the feldspars which the content not exceeds the 6%, and, the hematite which is only detected in the MK sample (2%).
| Mixtures | Whole rock | Clay fraction | ||||||
|---|---|---|---|---|---|---|---|---|
| Quartz | Calcite | Feldspars | Phyllosilicates | Hematite | Kaolinite | Illite | Smectite | |
| BM | 35 | 6 | tr* | 58 | 0 | 48 | 6 | 46 |
| MK | 51 | 2 | 6 | 39 | 2 | 42 | 20 | 38 |
Table 2: Mineralogical composition of BM and MK the mixtures (Wt.%).
Infrared spectroscopy: The IR absorption curves of both clay samples BM and MK are roughly similar, as seen in (Figures 4 and 5). It shows the presence of OH-stretching bands at the vicinity of 3600- 3700 cm-1 domain and the Si–O stretching bands near 1000 cm-1 [15-19]. Bands at 3698 cm-1, and 3620 cm-1 are attributed to the structural OH respectively of kaolinite [15,16,20,21]. The broad OH-stretching band ranging from 3623 and 3926 cm-1 coupled with relatively weak absorption bands near 825 and 750 cm-1 are characteristic of illite. The latter bands arise from Al-Mg-OH deformation. The shoulder at 913 cm-1 is attributed to the Al-OH–Al bending vibration and characterise the dioctahedral phyllosilicates [22]. The peak at 885 cm-1 is assigned to the Fe-Al-OH vibration that identified usually in the illite and smectitic minerals [23] resulting from Fe3+ for Al substitution in the octahedral sheet. The shoulder arising from the Si-O-Al vibration is showed at 536 cm-1. The presence of water is verified by the band large at 3400 cm-1. Peaks at 1727, 1402, 875 and 712 cm-1 correspond to the presence of calcite. The quartz was identified in the two samples by the bands at 1098, 1045, 798, 471cm-1. As conclusion, the IR spectra of BM and MK clay characterise a natural mixture composed by kaolinite, illite and smectite minerals.
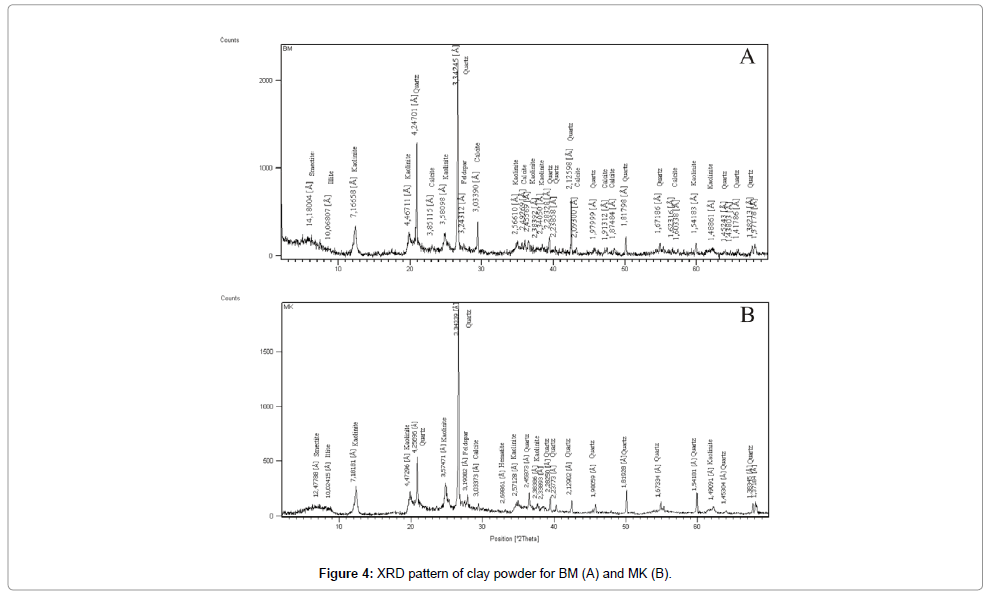
Figure 4: XRD pattern of clay powder for BM (A) and MK (B).
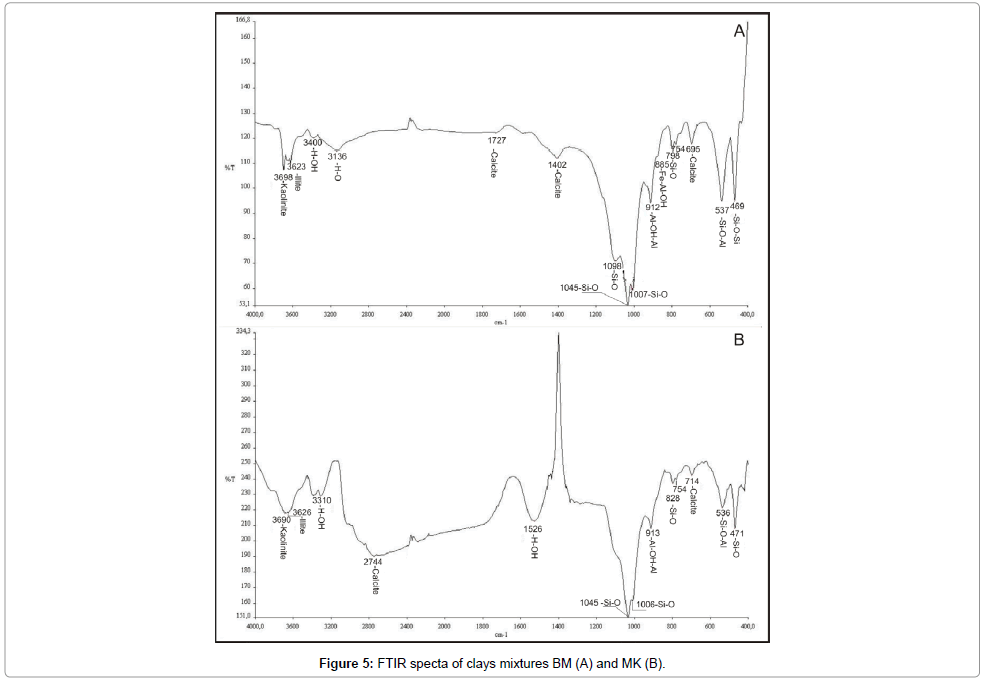
Figure 5: FTIR specta of clays mixtures BM (A) and MK (B).
Chemical characterization
Major elements and trace elements analyses: Table 3 shows the results of the major elements and trace elements analyses of the (BM) and (MK) mixtures. The SiO2 contents are 54.17% and 57.87% for BM and MK samples respectively. Concerning the Al2O3, we reported 19.43% and 18.22% for BM and MK mixtures respectively. The contents of alkalis (K2O + TiO2) are moderately high for both mixtures (3.332% for BM, 3.628% for MK). The content of Fe2O3 is relatively high for both mixtures (9.5% for BM and 10.48% for MK) which is assigned to the presence of hematite. This value is acceptable for the use in the ceramics industry. The significant amount of CaO is assigned to the presence of carbonates. SO3 values are insignificant, and are linked to the Pb-Zn sulphide reported in Kef Lasfar mine. Chemical results of trace elements show that MK samples are enriched in, Ni, Co, Ce, Ta, Pb, Sb, whereas, BM samples reveals higher contents in Cu, La, Pr, Br and Au (Table 4).
| Major elements | BM | MK |
|---|---|---|
| SiO2 | 54.17 | 57.87 |
| Al2O3 | 19.43 | 18.22 |
| MgO | 0.90 | 1.471 |
| Fe2O3 | 9.5 | 10.48 |
| CaO | 5.755 | 2.245 |
| K2O | 1.838 | 2.228 |
| Na2O | 0.17 | 0.14 |
| TiO2 | 1.494 | 1.408 |
| P2O5 | 0.1536 | 0.120 |
| MnO | 0.0177 | 0.022 |
| SO3 | 0.4732 | 1.432 |
| LOI | 6.13 | 5.25 |
| SiO2/Al2O3 | 2.78 | 3.17 |
Table 3: Chemical analyses of the major elements (%), loss on ignition (LOI) in weight %, of BM and MK mixtures. (Wt.%).
| Trace elements | BM | MK |
|---|---|---|
| As | 3.979316 | 5.150252 |
| Pb | < 1.94624 | 135.2637 |
| W | 1.58596 | 1.09105 |
| Ta | 2.047425 | 16.3794 |
| Sb | < 3.33448 | 241.7498 |
| Sn | 1.969125 | 5.35602 |
| Nb | 102.75888 | 82.48672 |
| Zr | 808.41852 | 784.7286 |
| Rb | 236.83219 | 259.69244 |
| Zn | 3133.143 | 3052.806 |
| Cu | 92.6666 | 87.07465 |
| Ni | 40.07784 | 74.6548 |
| Cr | 255.2066 | 636.306 |
| V | 244.79429 | 235.2714 |
| Ga | 49 | 40.91835 |
| Ge | <1 | 0.69405 |
| Br | 41 | 6,7 |
| Sr | 1452,72362 | 1462,8707 |
| Y | 77 | 90 |
| Mo | < 3 | < 3 |
| Ag | <0.93096 | <0.93096 |
| Cd | < 1 | < 1 |
| Te | 3 | 100 |
| I | 180 | <30 |
| Cs | 600 | 540 |
| Ba | 2,9 | 510 |
| La | 119 | 1 |
| Ce | <1 | 100 |
| Pr | 100 | 46 |
| Nd | 55 | 83 |
| Hf | <9.7 | 57 |
| Pt | < 2 | < 2 |
| Au | 17 | < 2 |
| Hg | 7 | 19 |
| Th | 600 | 60 |
| U | 7.8 | 7.4 |
| Co | < 53.3528 | 94.3776 |
Table 4: Chemical analyses of the trace and rare earth elements of clay mixtures (ppm).
Cation exchange capacity and specific surface: The values of cation exchange capacity (CEC) of clays BM and MK are 52 méq/100 g for BM and 47 méq/100 g for MK respectively. The low values are due to the abundance of kaolinite and to the presence of non-clay minerals. The specific surface area (BET) of the studied clays is low: 77.77 m2/g for BM and 59.81 m2/g for MK. These values confirm that the studied clays are a mixture (semi-kaolin-semi-illito-smectic).
Thermal behaviours
Thermal Analysis: The DTA-TGA curves of the prepared mixtures (Figures 6 and 7) show: (i) a significant endothermic peak at around 100°C, resulting from the removal of adsorbed and interlayer water of the clay minerals [24]. It represents a 2.209% (for BM) and 2.741% (for MK), weight loss of water moisture and hygroscopic water; (ii) an endothermic peak around 300°C is assigned to the combustion of organic material; (iii) an endothermic peak at 540°C attributed to the dehydroxylation of kaolinite; (iv) an endothermic peaks between 606°C and 726°C with a weight loss of 0.719% corresponds to the dehydroxylation of smectite ; (v) an exothermic peak at around 950°C corresponds to the reorganization of the structure of metakaolin in Mullite.
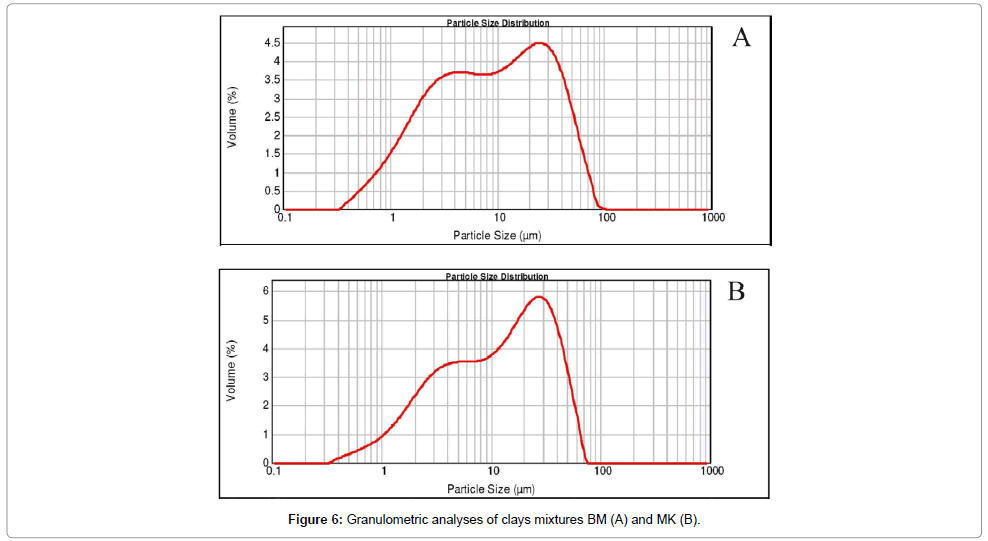
Figure 6: Granulometric analyses of clays mixtures BM (A) and MK (B). Figure 7:
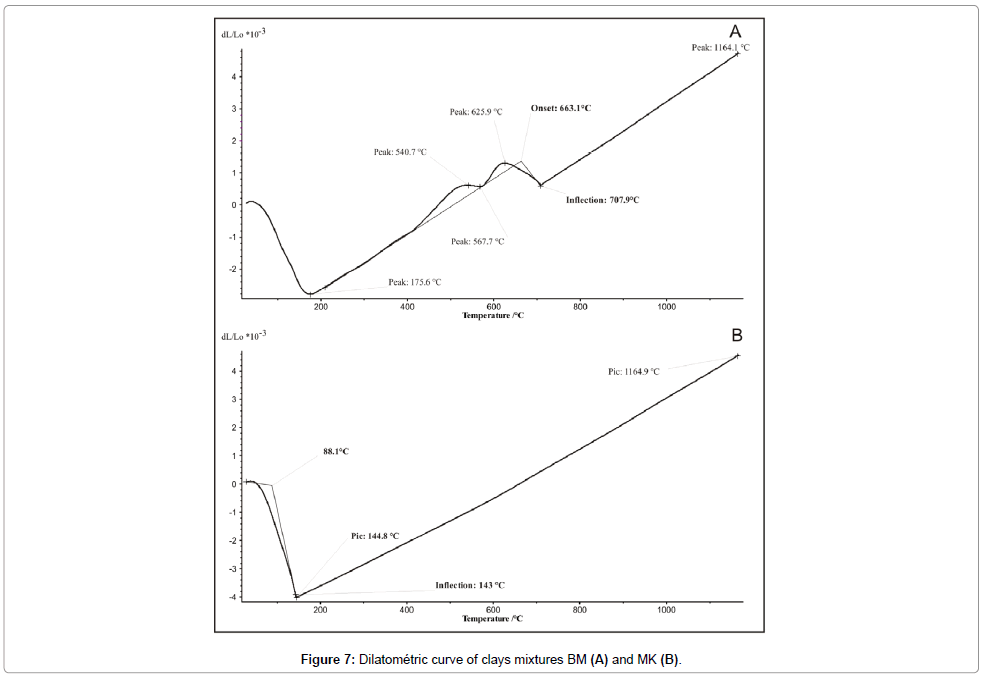
Figure 7: Dilatométric curve of clays mixtures BM (A) and MK (B).
Dilatometry: The Thermo-dilatometric curve of MK mixture shows a slight dilation at 88.1°C followed by a low shrinkage (4.01%) observed at 144.8°C (Figure 8). Beyond this temperature, the curve becomes linear, which corresponds to an important dilatation. The firing temperature is around 1165°C with a total shrinkage of 4.53%. For BM mixture, the first dilatation is observed at 88°C followed by 2.82% of shrinkage occurred at 175.7°C and, confirming the departure of residual water (Figure 9). The hook observed between 500 and 700°C is linked to the presence of illite. The inflexion point at 707°C is originated from the quartz conversion. The final firing temperature corresponding to 4.70% of shrinkage occurred at 1164°C.
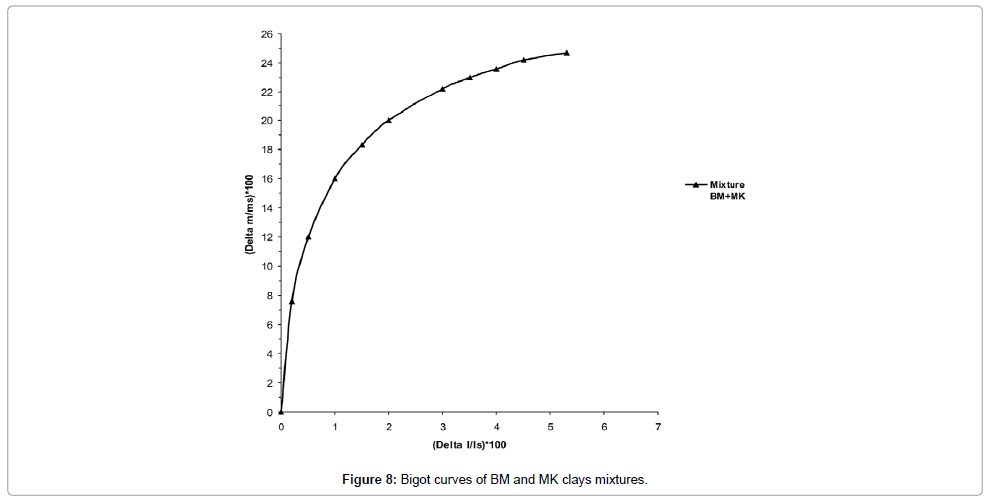
Figure 8: Bigot curves of BM and MK clays mixtures.
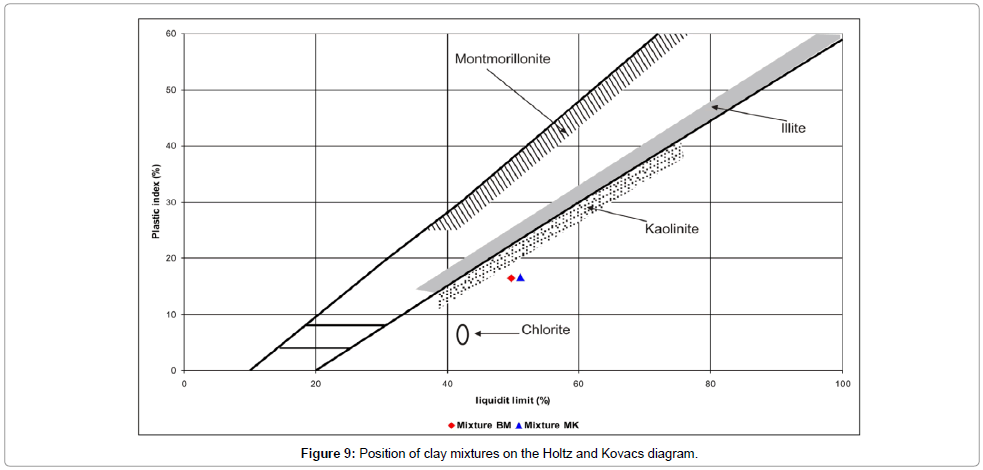
Figure 9: Position of clay mixtures on the Holtz and Kovacs diagram.
Plasticity: The results of the plasticity tests are given by the Atterberg limits (Table 5 and Figure 10). The values of the LL are about 49.74% for BM and 51.11% for MK. The PL values are 33.33% and 34.50% for BM and MK respectively, which are in agreement with the range of plasticity used for ceramic product manufacture defined in the literature (30-60%). The plasticity index PI was calculated based on the arithmetic difference of the plasticity limit and liquid limit. Both clays present relatively medium values of plasticity (7%< PI >15%).
| Mixtures | LL | PL | PI |
|---|---|---|---|
| BM1 | 49.74 | 33.33 | 16.41 |
| MK1 | 51.11 | 34.50 | 16.61 |
Table 5: Atterberg limits (%).
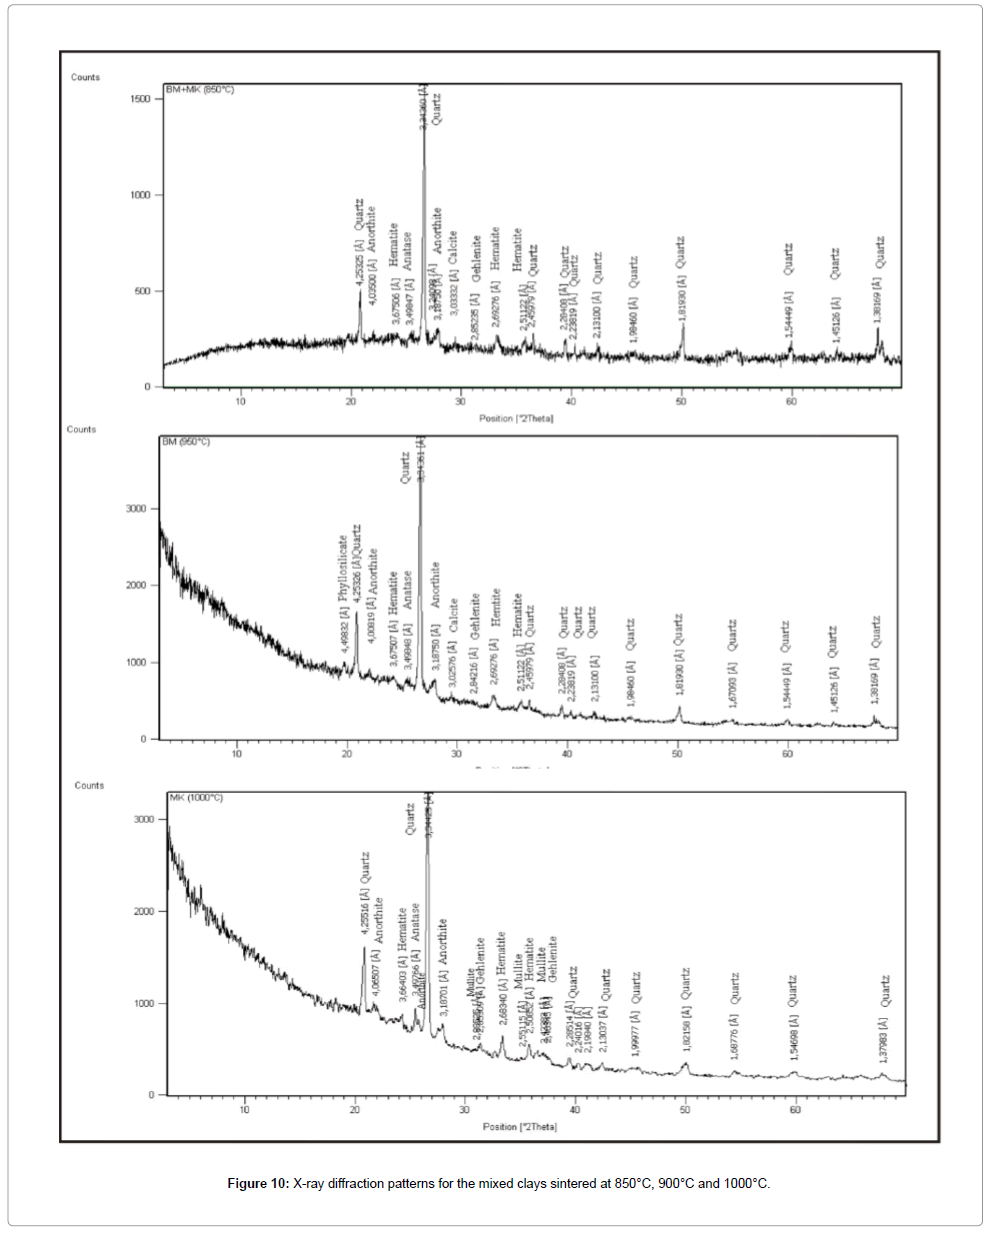
Figure 10: X-ray diffraction patterns for the mixed clays sintered at 850°C, 900°C and 1000°C.
Bigot Curves: The Bigot curves of the clay mixtures (BM and MK) after drying shows that the proportions of moisture water, interlayer water and colloidal water are 24.66%, 17.61% and 7.05% respectively (Figure 11). The total shrinkage after drying is 5.51%. This value results from the substantial amount of sand in the clay samples.
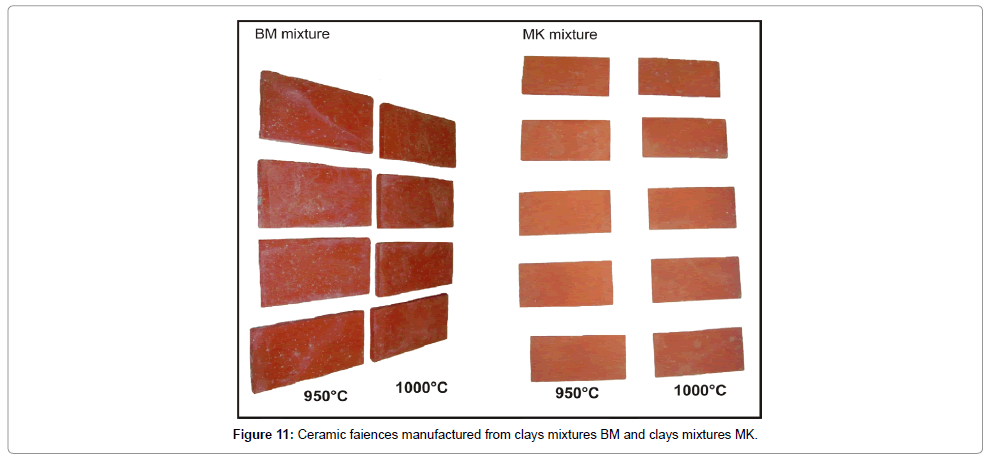
Figure 11: Ceramic faiences manufactured from clays mixtures BM and clays mixtures MK.
Industrial Tests
Concerning, the tiles manufacture, the results of technological tests in semi-industrial scales show a small drying shrinkage at around 1% for BM and 0.7 for MK (Table 6). Furthermore, the firing shrinkage is less than 2% for the two mixtures and depends to the firing temperature. The values of water absorption are greater than 10% for both mixtures, which is conforms to the French standard N.F.EN. 15 [25] (Table 7). Regarding the resistance to the inflection, which is the parameter defining the class of ceramic faience products according to the French standard N.F. EN 100 [26], we recorded at 1000°C 11.62 N/mm2 for MK mixture and 8.56 N/mm2 for BM mixture. Therefore, the results of semi-industrial technological tests for the tiles are similar. For the ceramic brick fabrication, we consider only one mixture combining BM and MK clays. The drying shrinkage values are around 7.70% and the removing cooking values are 0.44% at 800°C. It becomes 1.8% at 850°C and evolves to 3.89% at 900°C. The water absorption reduces from 14.70 to 7.78% when the temperature shifts from 800°C to 900°C (Table 7).
| Mixtures | Temperature (°C) |
Breaking Load | Flexural strength N/mm2 | Breaking force | Removing Cooking (RC %) |
Linear firing shrinkage (LF %) | L.O.I (%) | Water absorption (WA%) |
|---|---|---|---|---|---|---|---|---|
| MK | 950 | 256.04 | 6.63 | 217.49 | 1.04 | 1.44 | 9.24 | 14.08 |
| 1000 | 312.94 | 11.62 | 271.87 | 1.00 | 1.57 | 9.61 | 13.05 | |
| BM | 950 | 211.90 | 6.58 | 172.44 | 0.71 | 1.65 | 10.96 | 14.69 |
| 1000 | 246.23 | 8.56 | 200.65 | 0.69 | 1.81 | 11.08 | 14.17 |
Table 6: Composition of mixtures and corresponding measured values of flexural strength, water absorption, the linear firing shrinkage, the Removing Cooking and the L.O.I. for ceramic faience.
| Linear firing shrinkage (LF %) |
Firing temperature (°C) |
Removing Cooking (%) | L.O.I (%) | Water Absorption (WA%) |
|
|---|---|---|---|---|---|
| (BM + MK) Mexture | 7,70 | 800 | 0.44 | 9.55 | 14.70 |
| 850 | 1.8 | 9.62 | 11.31 | ||
| 900 | 3.89 | 9.90 | 7.78 |
Table 7: Technological properties of the prepared ceramic bricks.
Discussion
In order to assess the potentiality of Mjej el Beb clays in the ceramic industry, their mineralogy, chemistry composition, thermal behaviours and technological properties were determined. The results showed the predominance of the fine fraction composed basically with kaolinite, smectite and illite which are confirmed by the infrared spectroscopy. The confectioned items made of these clays have a red to dark colour arising from the high concentration of iron oxides content. This later, lead to a good fluxing properties and affect the mechanical strength of the ceramic products [27,28]. In addition, Fe2O3 with alkaline elements favour the formation of vitreous phase and lead to the densification of these fine materials and therefore could affect their fluxing and the firing temperatures [29]. The weight loss on ignition occurring after sintering lead to the development of the porosity, and has an effect on the resistance to the inflection during the thermally treatment. Beside, this clays are enriched in some trace elements such as Zn Sr, Cr, Th, Cs, Nb, V, Zr and Y. Zn Sr, Cr, Th which could be mobilized by the mineralizing fluids of the Kef Lasfer mine. These elements have an important role in the improvement of the mechanical resistance of the ceramic products. Previous studies showed that the Cs, Nb and V enhance the melting point as well as the mechanical strength. Whereas, the Zr present as oxide (zirconia), or silicate (zircon) could improve the ceramic materials quality. Biside, Y could be used as a sintering additive [30]. During the thermal treatment, various reactions occur principally dehydration, dehydroxylation and structural reorganization and neoformation phases.
Structural transformations
During firing treatment, clay minerals are transformed into new minerals dehydrated. At 850°C, kaolinite is transformed into amorphous phase: metakaolinite (Al2Si2O7) by the removal of the hydroxyl groups of the silicate lattice according to the following reaction: Al2Si2O5(OH)4 → Al2Si2O7 + 2H2O.
Between 850°C and 950°C, the CaCO3 decomposes to CaO accompanied by disengagement of CO2 outside the structure of fired bodies; this phenomenon creates a porous structure [29]. The CaO reacts with the metakaolinite at increasing temperature, leading to the formation of the gehlenite which evolves to anorthite [31,32] (Figures 12 and 13) according to the following reaction:
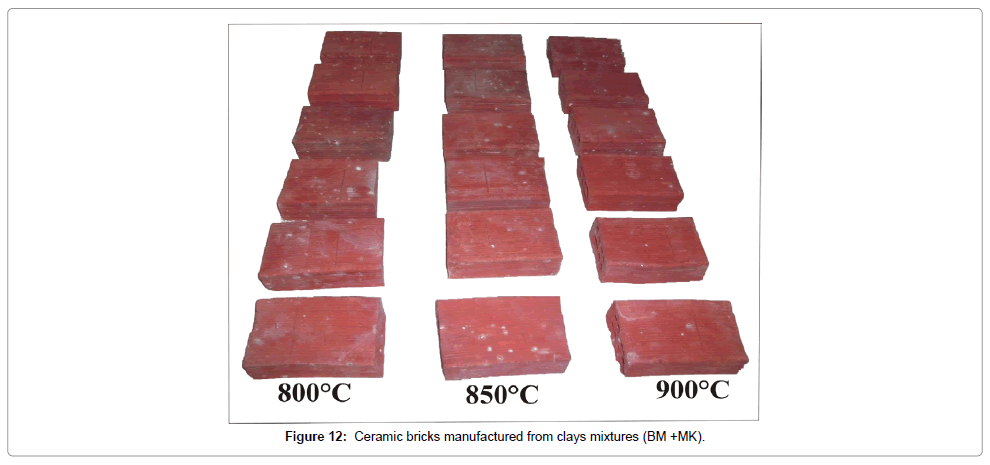
Figure 12: Ceramic bricks manufactured from clays mixtures (BM +MK).
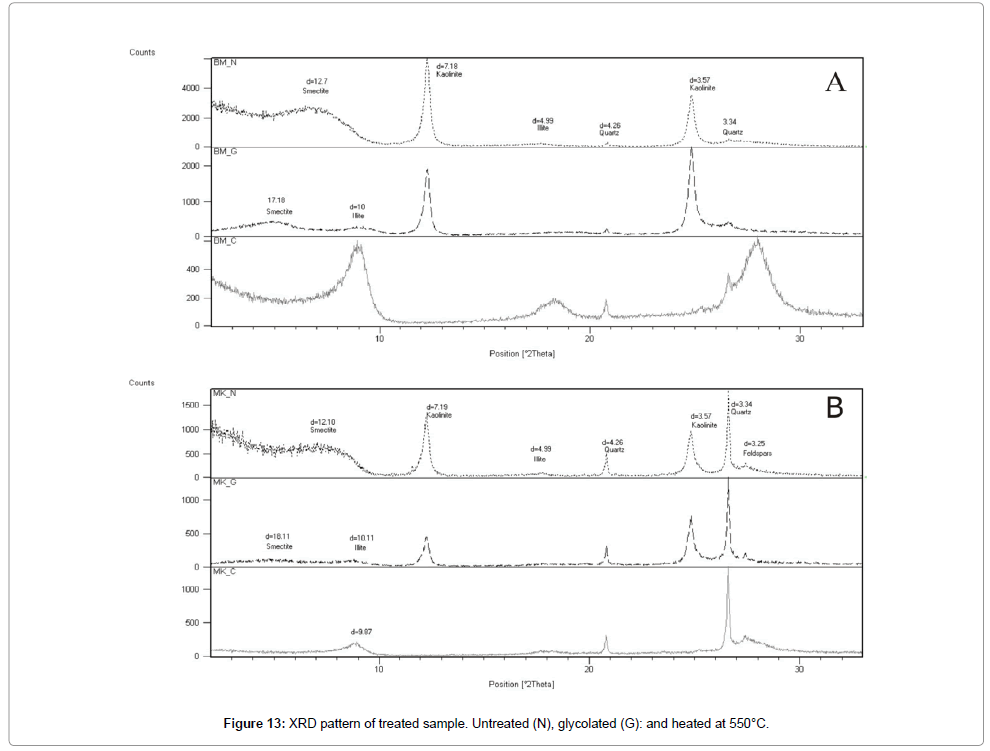
Figure 13: XRD pattern of treated sample. Untreated (N), glycolated (G): and heated at 550°C.
Al2Si2O7 + (2 + n) CaO → Ca2Al2SiO7 + n CaOSiO2
Ca2Al2SiO7 + 3SiO2 + Al2O3 → 2 CaAl2Si2O8
In general, we cannot exclude the formation of anorthite from the metakaolinite according to the reaction:
Al2Si2O7 + CaO → CaAl2Si2O8.
Above 900°C, a segregated spinel-type phase (γ-Al2O3) recrystallizes [33], and evolves to mullite when the temperature increase above 1000°C. The industrial tests carried out on the fired products reveal a low withdrawal, which is linked to the removal of the water. This latter is responsible of the tightening of the particles and the decrease of the liquid surface and capillarity tension. Concerning the mechanical resistance to the inflection, the medium value observed is related to the medium plasticity of the Cretaceous clays. Previous studies showed that the flexural strength could be linked to the presence of silica minerals [34]. It was also shown, that the mechanical resistance to the inflexion increases with vitrification. Indeed, when vitrification is completed, the pores join together to from large pores causing the macroscopic deformation on the ceramic materials [35-40].
Conclusion
In conclusion, the mineralogical and geochemical characterizations of the Cretaceous clay of Mjez El Beb revealed a good quality of raw material composed mainly of kaolinite and illite and enriched withAl2O3, and SiO2. These oxides have a decisive influence on the refractoriness and strength of the final product. Besides that, the Fe2O3, alkali and alkaline earth elements, present in the clays, lead to the rapid vitrification and fusion during firing. In addition, the high proportions of finer particles favour the vitrification due to the good compaction during moulding, which positively influences on the resistance of fired materials. During firing, several mineralogical transformations of the minerals initially present in clay powder occur [41-43]. The new phases represented mainly by metakaolinite, gehlenite, anorthite, spinel-type phase (γ-Al2O3) and mullite enhance the process of sintering of ceramic matrix. Therefore, the mineralogical and chemical compositions allowed us to choose the suitable semi industrial manufacturing applications [44-46]. For this, we recommend to use BM and MK clay-mixture in the ceramic earthen ware, and to mix BM and MK for the bricks fabrication. The quality of the ceramic product could be verified by examining the firing shrinkage, the firing line narrowing, the ignition loss, the porosity, the plasticity and the flexural strength.
Acknowledgements
This work was carried out in the University of Sciences, Tunis, Tunisia, Centre Technique des Matériaux de Construction, de la Céramique et du Verre "C.T.M.C.C.V”, Centre de Recherches et des Technologies des Eaux Technopole de Borj-Cédria. We thank Mrs Bargaoui Latifa for her helpful contribution of thermal analyses.
References
- HammamiM (1999) Ectonics,Holoceneand implementationmineralizationin thediapirszone (Tunisie septentrional), Thesis, University Tunis, Tunisie, (183pp).
- Bolze J (1954) Ascension and pierced through diapirs in the mountains of Cretaceous Téboursouk (Tunisie septentrionale). CR Socgéol France: 139-141.
- Perthuisot V (1978) Dynamic and petrogenesis of Triassic extrusions in northern Tunisia. Thesis esEcoleNormaleSuperieure Sciences, Paris. (312 pp).
- Rouvier H, Perthuisot V, Mansouri A (1985) Deposits and salt bearing diapirsin southern Europeand North Africa. Econ Geol 80: 666-687.
- Benassi R, Jallouli C, Hammami M, Turki MM (2006) The structure of Jebel El Mourra, Tunisia: Adiapiric structure causing a positive gravity anomaly. Terra Nova 18: 432-439.
- Bejaoui J, Bouhlel S, Cardellach E, Canals À, Perona J, et al. (2013) Mineralization and fluid inclusion studies of the Aptiancarbonate-hosted Pb-Zn-Ba ore deposits at Jebel Hamra. CentralTunisia J GeochemExplor 128: 136- 146.
- Marie J, Trouve P, Desforges G, et Dufaure P (1984) New elements of the Cretaceous paleogeography of Tunisia. Notes et Mém., CFP 19: 7-37.
- Orgeval JJ (1994) MetalconcentrationPeridiapiric: example of theBougrinedeposit(TunisiaAtlas) In:FontbotéL,BoniM(eds)Sediment-hosted Zn-Pbright. Springer, Heidelberg, Applied to Mineral Deposits, Special Publication 10: 354-389.
- Salaj J (1978) The geology of the Pelagian block; The eastern Tunisian platform, in Nairn. A.E.M., Kanes, W.H., and Stehli, F.G., eds. The ocean basins and margins; The western Mediterranean, v.4B: New York, Plenum Press: 361-416.
- Maamouri AL, Zaghbib-Turki D, MatmatiMF, Chikhaou MI,Salaj J (1994) The Bahloul formation centro-northern Tunisia: New lateral variation dating and new interpretation in terms of sequence stratigraphy. J AfricanEarthSci 18: 37-50.
- Van Hinte, JEA (1976) Cretaceous time scale, Amer Ass Petrol Geol Bull 60: 498-516.
- Meseguer S, Sanfeliu T, Jordan MM (2009)b. Classification and statistical analysis of mine spoils chemical composition from Oliete Basin (Teruel. NE Spain). Environ Geol 56: 1461-1466.
- ISO 10545-4 (2014) Ceramic tiles: Determination of flexural strength and fracture strength.
- Farmer VC (1974) The layer silicates in the infrared spectra of minerals. pp 331-365.
- Van der Marel HW, Beutelspacher H (1976) Atlas of Infrared Spectroscopy of Clay Minerals and their Admixtures: Elsevier, Amsterdam: pp396.
- Kodama Y (1985) Optical solitons in a monomodefiber. J Statistical Physics 39: 597-614.
- Balan E, Saitta AM, Mauri F, Calas G (2001c) First-principles modeling of the infra-red spectrum of kaolinite. Am Mineralogist 86: 1321-1330.
- Benco L, Tunega D, Hafner J, Lischka H (2001)b. Orientation of OH groups in kaolinite and dickite: Ab initio molecular dynamics study. American Mineralogist 86: 1057-1065.
- Van der MarelH, Krohmer W (1969) OH stretching vibrations in kaolinite and related minerals. Contributions to Mineralogy and Petrology 22: 73-82.
- Farmer VC (2000) Transverse and longitudinal crystal modes associated with OH stretching vibrations in single crystals of kaolinite and dickite. SpectrochimicaActa. Part A: Molecular and Biomolecular Spectroscopy 56: 927-930.
- Borchardt GA (1977) Montmorillonite and other smectite minerals: In Minerals in Soil Environments, J. B. Dixon and S. B. Weed, edn, Soil SciSocAmer, Madison, Wisconsin: 293-330.
- MendelovioE, Yariv S, Villalba R (1979) Iron-bearing kaolinite in Venezuelan laterites. I. Infrared spectroscopy and chemical dissolution evidence. Clay Miner 14: 323-331.
- BaranB, Ertürk T, Sarikaya Y, Alemdaroglu T (2001) Workability test method for metals applied to examine a workability measure (plastic limit) for clays. Applied Clay Sci 20: 53-63.
- AFNOR EN 159 (1991) Ceramic tiles, Determination ofthewater absorption 61p.
- AFNOR EN 99(1982) Ceramic tiles, Determination of the water absorption6p.
- Anderson CR, Siegel DA, Kudela RM, Brzezinski MA (2009) Empirical models of toxigenic Pseudo-nitzschia blooms: Potential use as a remote detection tool in the Santa Barbara Channel. Harmful Algae 8: 478-492.
- Samara M, Lafhaj Z, Chapiseau C (2009) Valorisation of stabilized river sediments in fired clay bricks: Factory scale experiment. J Hazardous Mater 163: 701-710.
- Darweesh HHM (2001) Utilization of cement kiln by-pass dust waste as a source of CaO in ceramic industry. Silicates Industrials 66: 47-52.
- HabashiF (2001) Historical Introduction to Refractory Metals, Mineral Processing and Extractive Metallurgy Revie 22: 25-53.
- Jouenne CA (1984) Ceramics trafficking Minerals and Materials, Editions Septima Paris.
- Traore K (2003) Low temperature sintering of a kaolinitic clay in Burkina Faso. Transformations thermiques et réorganisations structurales. Thèse de Doctorat pp:140.
- Colegrave EB, Rigby GB (1952) The decomposition of kaolinite by heat: Trans. Brit Ceram Soc 51: 355-367.
- Baccour H, Medhioub M,Jamoussi F, Mhiri T, Daoud A (2008) Mineralogical evaluation and industrial applications of the Triassic clay deposits, Southern Tunisia. Mater Charact59: 1613-1622.
- AndersonM, Elliott M, Hickson C(2002) Factory scale trials using combined mixtures of three byproduct wastes (including incinerated sewage sludge ash) in clay building bricks. J Chemical TechnolBiotechnol 77: 345-351.
- Chang LLY(2002) Industrial Mineralogy: Materials, Processes and Uses. Upper Saddle River, NJ: Prentice-Hall.
- Dondi M, Ecrolani G, Guarini G, Marsigli M, Mingazzini CV(1999)Major deposit of brick clays in Italy: part 2. Technological properties and uses. Tile Brick Int 15: 360-370.
- FrancoF, Cecila JA, Pérez-MaquedaLA, Pérez-RodrÃguezJL,Gomes CSF(2007) Particle-size reduction of dickite by ultrasound treatments: effect on the structure, shape and particle-size distribution. Applied Clay Science 35: 119-127.
- GadsenJA (1975) Infrared Spectra of Minerals and Related Inorganic Compounds. Butterworths, London.
- Gunasekaran S, Anbalagan G (2007) Spectroscopic characterization of natural calcite minerals. SpectrochimicaActa (Part A) 68: 656-664.
- Jamoussi F, Bédir M, Boukari N, Kharbachi S, Zargouni F,et al.(2003)Clay mineralogical distribution and tectono-eustatic control in the Tunisian margin basins. CR Acad Sci 335: 175-183.
- LCPC(1987)Atterberg limits, liquid limit, plastic limit, test methodLPC, n°19, publication L. C. P. C. 26.
- Massrouhi A (2006)The salt-bearing devices of Mateur region Tebourba and Bab El Mjez (Tunisie Nord). Thesis University Tunis, Tunisiepp:260pp
- Rouvier H(1977)Geology of the extreme north of Tunisia: paleogeography and tectonic superimposed at the eastern end of the northern Maghreb channel. Thèse ès Sciences, Univ. Paris VI pp:634.
- Sdiri A, Higashi T, Hatta T, Jamoussi F, Tase N(2010)Mineralogical and spectroscopic characterization and potential environmental use of limestone from the Abiod formation, Tunisia. EnvironEarth Sci 61: 1275-1287.
- Van OH(1963)An Introduction to Clay Colloid Chemistry: Interscience, New York: 94-95
Citation: Faten HBZ, Dalel S, Najet SS, Mohsen H (2015) The Application of Cretaceous Clay Minerals of Mjez El Beb (North-Western Tunisia) in Ceramic Industry. J Earth Sci Clim Change 6(9): 308. DOI: 10.4172/2157-7617.1000308
Copyright: © 2015 Faten HBZ, et al. This is an open-access article distributed under the terms of the Creative Commons Attribution License, which permits unrestricted use, distribution, and reproduction in any medium, provided the original author and source are credited.
Select your language of interest to view the total content in your interested language
Share This Article
Recommended Journals
Open Access Journals
Article Tools
Article Usage
- Total views: 13587
- [From(publication date): 11-2015 - Aug 31, 2025]
- Breakdown by view type
- HTML page views: 12549
- PDF downloads: 1038