The Dynamics of the Coastal Land Scapes Over the Last Decades: Wind Drivers for Change Along the North Western Mauritanian Coast
Received: 14-Dec-2017 / Accepted Date: 21-Feb-2018 / Published Date: 28-Mar-2018 DOI: 10.4172/2157-7617.1000450
Abstract
The alterations of the coastline are a major concern for maritime countries. Mauritania is no exception. As one of the countries with the highest marine productivity in the world, it stimulates growth in infrastructure development and jobs with its marine resources exploitation. But, the marine erosion and submersion have never been more critical to the entire coast. Coastal developments are planned, despite these risks both in the north and in the south. What about the coastline dynamic over the last decades and are they the same all along the Mauritanian coastline? What are the consequences on the coastal landscapes? The chronology of the paleo shoreline has been extensively studied near the Arguin Gulf for a better understanding of the infill of this large sedimentary basin and the last marine invasion started during the Nouakchottian period. The current retrospective study gives details on recent dynamics over the last seven decades. It is based on remote sensing images coupled with statistical analyses of climate data. A focus has been chosen on the Arguin Bank Park, which has been protected since 1976, because such wild areas represent a preferred window to evaluate natural responses. It is also home to coastal ecosystems of primary interest such as eelgrass beds. Five patterns differ in the dynamics of coastal segments that are a continuing accretion, a stability or an erosion. In addition, the time scales of these analyses allow for the identification of the impulse response of the environment, in phase or lagged time. Two new lagoons are developing and one of which shows a colonization by an eelgrass meadow system. The flooding of several insular wetland has become increasingly frequent and raises various questions about the mangroves and changes in the attractiveness of birdlife, the park's main richness. The various coastal dynamics may be the consequence of the sedimentary balance driven by northeasterly winds and the coastal drift currents. While the future projection of this coastal area remains complex, a better understanding of the dynamics should help feed the Strategy for managing the Mauritania’s coastline as well as the management of the Park. The ecological approach of the climate impacts opens up new perspective based on equivalent ecological concept.
Keywords: Climate impact; Coastal landscape; Mauritanian coast
Introduction
The current marine invasion of the coastal Mauritanian area has started about 6500 BP [1]. The sea level rise flooded the extensive delta which forms now the north coastal shelf, called the Arguin Gulf. Inland, the desertification led to the drying up of the river system. Then, a barrier beach has being built up from 4200 BP until present; materials have been provided by the Saharan Azefal and Akchar ergs (rooted in the huge western Erg). Those barriers isolated the coastal low salty plains, the sebkhas [2]. The prevailing climatic conditions over this period were quite similar to the current ones [3]. The two recognized drivers could be the eastern wind sediment transport and the geologic structure with a gentle slope. The numerous studies performed provide the chronology of this paleo shore, not only their geomorphological building but also few elements about their natural habitats and human occupation [4-6].
These observations, which trace the history of ancient epochs, smooth many dynamics at finer time scales. While these variations in coastal landscapes caused by climate change have always existed, their anthropogenic consequences have taken on a different meaning now-a-days due to demographic and economic development. To this end, states have committed themselves to adapting sustainable societal models. Mauritanian coastal areas are undergoing major development, while climate prediction models point to this Saharan zone as one of the most vulnerable to the consequences of these changes. The objective of the present analysis is to identify the dynamics of coastal landscapes over the last seven decades. Strategies may be adapted according to the time frames and mechanisms underlying them.
The geomorphological moving of this coastal area could directly or indirectly impact ecosystem services provided by this area. The commitment of the Mauritanian State to the biodiversity and the current discussion about the adaptation and mitigation strategies on climate change gives the direction to focus these analyses on the northwestern coasts. The coastal dynamic is assessed through an ecological approach. The moving of the coastline over the last decades is discussed with regard the main natural habitat: marine or land habitat.
Several habitats of the National Park of Arguin Bank (PNBA) support the high productivity of the north-western Mauritanian continental shelf which is largely exploited by fisheries and also by water birds. The tidal habitat of seagrass bed as well as the saltmarshes is also a crucial element with regard to their natural roles in mitigating the adverse effects of climate change. The seagrass bed is composed of the two species Zostera noltii and Cymodocea nodosa and extends over 500Km² on tidal mudflat of the central zone of the Gulf. The sediment is trapped by the Zostera long leaves which results in stabilized tidal flats. This natural habitat is also known as a spawning and nursery role; it is a vital feeding area for thousands of paleo arctic birds [7-9]. The seagrass root system and the degradation of the dead leaves support the organic matter cycle [10,11]. This productivity helps the carbon storage [12]. But the tidal character makes this area more vulnerable to high climate variability.
The mangrove areas are constituted by a single species, the white mangrove (Avicenia germinans). It is a remarkable natural habitat although it covers only about 4Km2 fragmented surface [13,14]. In addition, it has also a scientific value because it is the most North African mangrove and by the way it could either be a bio indicator of climate change or a mitigation element for resilience.
A retrospective study was carried out using remote sensing data which covered the period from 1985 to January 2017 and several climate parameters. The selection of those parameters referred to the coast building processes which is mainly controlled by the inflow of continental sediments and their redistribution driven by the long shore drift current and hydrodynamics [15]. The previous study on paleo climate mainly considered the sea levels [16]. Using a multi-decadal timescale, the climate parameters parsed were shifting wind and rainfall patterns. The wind series were reconstructed for different angles from records of two weather stations of the National Meteorological Office, ONM: Nouadhibou and Nouakchott between the years 1960 to 2016. Rainfall and air temperature series were also established.
The wind from northeast to southeast with a speed a specific threshold causes a deflation and the air transport of these particles through saltation and suspension in the case of dust. 50 to 80% of these materials shift coastward from the large North African ergs and 20 to 50% from the north-eastern Mauritanian basin [17,18]. Close to coast, the contact between the oceanic and continental air masses slows down the flow; a vertical stratification sets up and sediment load drops down [19,20]. The coarsest particles land near the shore; the dust are driven by the Atlantic flux to the Caribbean [21]. The wind driven flux are quantified by 10 to 50 tons per linear meter of coast per year and 25% of the input drop down the sea.
The trade wind speeds up a coastal drift southward the Arguin Gulf (Reyssac, 1977). This current carries the sediment of continental origin and accumulated along the shore as sand bars. The northern area of the Gulf (from Tintan peninsula to Techekché), is less concerned because it is sheltered from the trade wind pressure by the Nouadhibou peninsula. The direction of the drift current could reverse under southern storms [1].
The hydrodynamic regime also controls the flow and shapes of the sedimentary deposition. Two hydrodynamic patterns characterize the Mauritanian coast. The Atlantic long swells (period >10 s) converge toward the north-western area. When nearing the coast, their power is depreciated by the shallow waters of the Arguin Gulf; they are more destructive south of Cape Timiris [22,23]. On the contrary, the local weather phenomenon (wind with a fetch between 20 km to 200 km wide) could generate short-crested waves (period <5 s). Their power could maintain higher sediment load which is re suspended from the mud flats and relocated toward sheltered bays or seaward. These waves cause more erosion on barrier shores, dunes and tidal mudflats. The swell could also contribute in raising the sea level when combined with spring tides particularly at the equinoxes. The consequence is an expansive marine invasion because the land is flat and at low level. The various temporal variations of climate parameters were described in previous analyses [24]. This study analyzed how shoreline has been affected by climate change. The chronological dynamics have been reconstructed through the visualization by satellite images of the study area at different dates. By the way, those last analyses have a speculative aspect. Then, the results were viewed in the context of the future projections provided by the Intergovernmental Panel on Climate Change, IPCC [25]. Finally, the potential impacts on the natural habitats were tested from few field observations available and more academic studies. This approach opens up new perspectives based on the equivalent ecological concept and suggests recommendations.
Material and Methods
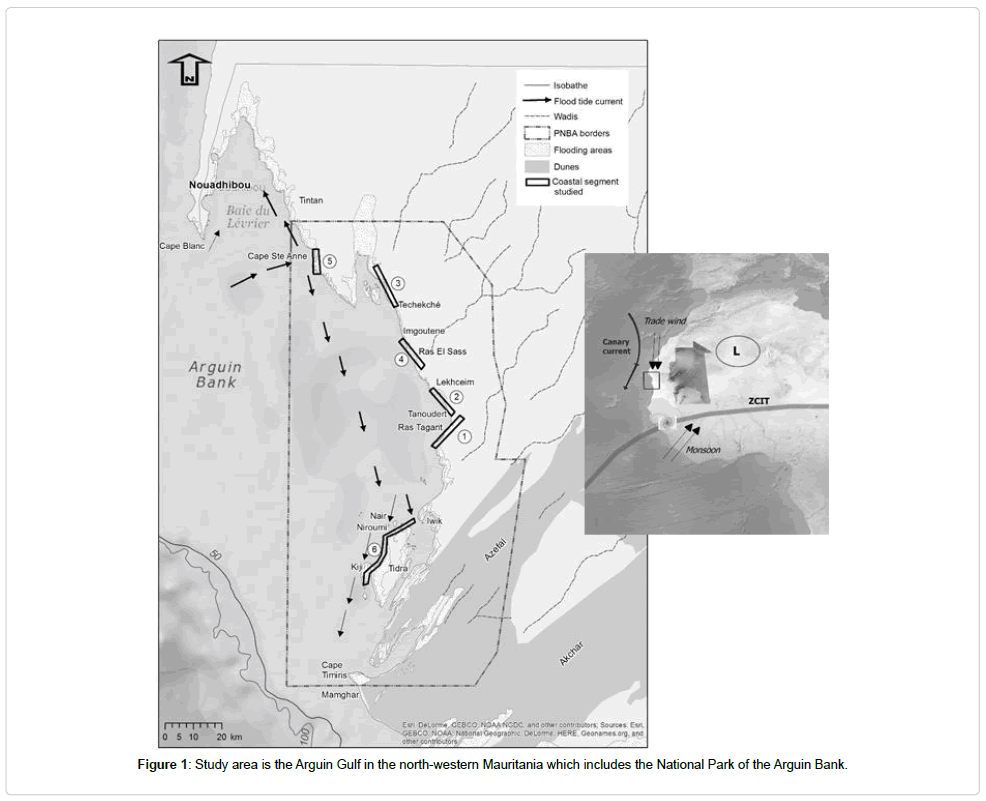
The study area includes the north-western Mauritania. This focus refers to its crucial economic and natural heritage roles. This area shelters the National Park of the Arguin Bank, PNBA and is, therefore, well placed to observe climate and ecosystem variations because restricted infrastructures and activities (Figure 1).
Mauritanian waters offer varied living conditions, alternating between a cold current (current 91 from the Canary Islands) and a warm current (current from Guinea). The north-west zone is formed by a large continental shelf covered with shallow waters and cut by a network of channels flowing into canyons at the continental slope. This shelf, the Arguin Gulf, is a vestige of the former delta of the Tamanraset River [26]. These conditions make the Mauritanian waters one of the most productive marine areas in the world and a biogeographical crossroads. Arctic, tropical, Mediterranean and Saharan-African species meet there seasonally or permanently. This convergence is the originality of its biological richness and also represents a source of fragility. A half land half-marine national park of 1200,000 km2 was created in 1976 and became a UNESCO World Heritage site in 1989 [27].
Delineation of the Shore Line
The delineation of the shore line resulted from the implementation of the calculation of the Modified Normalized Difference Water Index, MNDWI, using four Landsat imagery, calibrated and geometrically corrected [28,29]. The physical context of the images used was similar to ease comparison between dates for example limiting the equinox tide print. All scenes correspond to winter season and low tide with medium range (Table 1). The atmosphere of the Saharan region is charged with dust blown up by east-to-northeast winds on the great ergs of southern Algeria and north-eastern Mauritania. Winter shows the conditions of purity of the atmosphere most favourable to the use of satellite imagery. The number of scenes retained and the time interval between two dates were dictated by the availability of scenes taken in similar tidal and visibility conditions. For example, the period known as the "great drought", especially in the 1990s, is characterized by the greatest frequency of sand storm and consequently the absence of image usable for such a study. The extension of the study area was nevertheless limited by this equation of criteria and the southern part was excluded. The MNDWI index is based on the satellite channels green (G) and medium infrared (MIR or SWIR) and the following formula is applied: MNDWI = (G-MIR)/ (G+MIR). The positive values indicate the water or wetlands which means the zones that can be 119 submerged. The delineation between the zones affected or not by the sea are seen as “shore 120 line”.
| Satellite | Date | Tide Coefficient | Low tide | Acquisition Time |
|---|---|---|---|---|
| LS5TM | 1985/01/12 | 82 | 11:12 | 11:02 |
| LS5TM | 1998/02/17 | 69 | 10:49 | 11:08 |
| LS5TM | 2007/01/09 | 68 | 11:07 | 11:26 |
| LS8OLI | 2017/02/05 | 57 | 13:52 | 11:32 |
Table 1: Satellite remote sensing view characteristics (Source: NOAA/USGC, https://earthexplorer.usgs.gov).
Climate parameters
The geomorphological building of the Mauritanian coasts is controlled by the continental sedimentary inputs and its relocation along the shore line under the pressure of the drift current and the hydrodynamics.
The wind is the main driver for these processes. Therefore, several wind data series have been restated in accordance with the scope to analyze the coastal landscape over the last decades. The series have been based on the three-hourly daily wind records, archived in direction angle sectors of 20° and speed ranges of 2 m.s-1. The metric performed is the number of occurrences aggregated per month and per year and that is according to each angle sector. The number of occurrences has been considered more relevant than average to reflect the chronic stress pressure on the natural system.
The easterlies aggregate the wind origin angles from 40° to 100°. A threshold about 6 to 8 m.s-1 is considered relevant for stirring up the sediment under the atmosphere’s humidity conditions in the northeastern Mauritania [30]. The data used are archived by speed class of 2 m.s-1 range; wind equal or over 6 m.s-1 has been therefore selected to establish the data series from both meteorological stations, Nouadhibou and Nouakchott. The monthly occurrence of sand storm has been also calculated from the Nouakchott station. The World Meteorological Organization (WMO) describes a dust uplift as a storm when the horizontal visibility is less than 1 km with a severe wind (>10.3 m.s-1). This events can happen in winter with northeasterlies and also in summer when monsoon storms. The oceanic winds aggregate the wind origin angles from 240° to 320°; speed range that is equal or over 8 m.s-1, have been selected as effective to a short swell over the Arguin Gulf. In the lack of characterization results on the continental shelf swell based on in situ measurements, the threshold was defined above the long term average level à wind speed at the Nouadhibou station from 1980 to 2016. This threshold also corresponds to development of breaking wave regarding the Beaufort scale. In parallel, wind occurrences with a speed less than 2 m.s-1 whatever the angle direction have been quantified to illustrate some soft hydrological situation which can help the sediment material deposition. The southern wind aggregates origin angles from 140° to 220°; speed range that is equal or over 6 m.s-1, have been considered effective to reverse the littoral drift and uplift a northward wave front. In the same way, the trade wind aggregate origin angles from 320° to 360°. On the same way, speed range that is equal or over 4 m.s-1, have been considered effective to strengthen the littoral drift from north to south and uplift a southward wave front. The rainfall data series have also been restated from monthly records at both stations. Annual precipitation is low. Nevertheless, rain events reactivate old wadis and can contribute to the formation of resurgence, or even rupture of the coastal dune barrier. The data source is the Nouadhibou and Nouakchott synoptic stations which are better covering the study area (Table 2). In fact, the geomorphological context and the location of the Nouadhibou peninsula affect the wind direction and rate which are modified between the north, center and south of the Gulf. The rainfall is also very different between the two stations; this results from the seasonal shift of the Intertropical Convergence Zone, ITCZ which is the monsoon driver.
| Climate parameters | Period | Source | Frequency |
|---|---|---|---|
| Wind (origin direction/speed) and sand storm | |||
| Nouakchott | 1961-2016 (1966, 1973) | National Weather Office of Mauritania, ONM |
Three-hourly |
| Nouadhibou | 1980-2016 | ||
| Rainfall (accumulation) | |||
| Nouakchott | 1945-2016 | ONM | Daily |
| Nouadhibou | 1980-2016 (2008-2011) | ||
| Sea level rise | |||
| Satellite | 1993- 2012 | (GERICS, 2015) | Average |
Table 2: Characteristics of base data and source (Period in italic are missing data).
The sea level data is not a climate parameter but a consequence of climate. Nevertheless, its effect on the coastal building combined with climate parameters is crucial. Therefore, this parameter has been considered as well as the previous ones. There is no time series recorded in Mauritania which is long enough. The closest tide gauge station is the Dakar one but the time series was twice interrupted [31]. The data used are results from a recent study around the Nouakchott area [32].
Description of the Coastal Natural Habitats
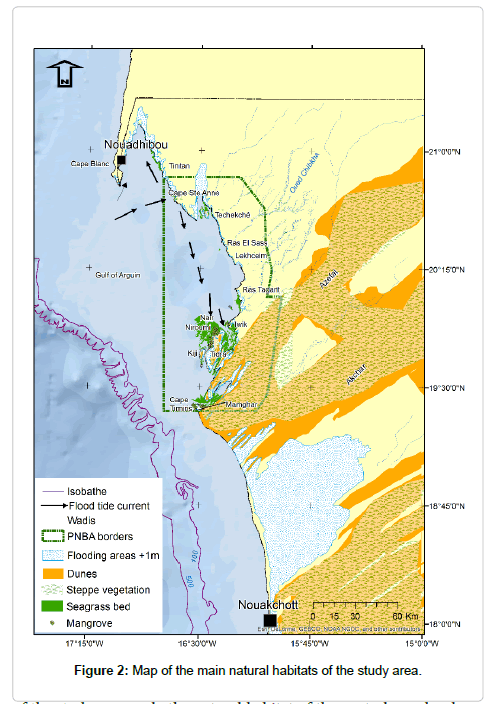
Numerous studies and maps have been achieved on the central area around Iwik and some islets which are low lying and close to the main coast (Figure 2). Unfortunately, these are only part-monitored with no available data. The northern area is less documented. The progress of these natural habitats is discussed in this study with regard to the latest studies and informal field observations.
Several land covers have been described [33-35]. The desert steppes show sparse shrubs and bushes on gravel, sand or fossil marine shell grounds. Species are Saharan like nucularia perrini, Salsola sieberi, Suaeda vermiculata and grass like such as Psoralea plicata or ephemeral grass. Sand-clay basins are home to a special flora named Graret Lehmir. Wet wadis are very rare in the Park (wadis Zidine, Chibka, Nouaferd) and they are quite filled with sand; indeed their flow are lined by Acacia trees (Acacia tortilis raddiana), two types of grasses and divers herbaceous weeds. The last flora pattern is dune belts which are characterized by halophyte plants like spartina (Spartina maritima) on the low lying area, the slikke; then a second belt shows species such as Stipagrostis pungens and Cornulaca monacantha. The sand can be fixed to develop a colony of euphorbia (Euphorbia balsamifera). Available data is outdated and it is difficult to assess the density, the coverage and the renewal of these natural communities over the last decades. Limited and fragmented mangrove swamps have been reported on the North of Tidra and around Mamghar village. These mangroves are characterized by a unique species Avicennia germinans. Any monitoring of the mangrove habitat was implemented at the north of Tidra Island on the contrary of the Cape Timiris one and the Al-Zhaïn sub area. Some element of their physiological status and geographical extent are discussed while this natural habitat represents important concerns in tropical zones mainly African ones. On the marine part of the study area, only the natural habitat of the central area has been mapped through a SPOT satellite image captured on February 19th, 2003. The scene was calibrated in reference to field surveys, one during the fall of 2008 and the second one in early 2010 in the framework of the PACOBA program [36]. A field trip last May 2016 to the Bellaa’t lagoon on the west side on the Tintan peninsula gave the opportunity to identify new development of tidal seagrass bed over this recent marine invasion.
Analysis Method of Variation of the Coastal Zone
The shoreline dynamic was identified for each period between two imagery dates in a row. Six segments were distinguished to illustrate the various dynamic patterns observed (located on the Figure 1). The time series of climate parameters selected were analyzed through several time scales: 215 multi annual and seasonal from the monthly data.
The following successive steps were implemented:
• Graphics describing the series dynamic over the period and a seasonal pattern. The latest was calculated by the monthly average over the all series.
• Applying standardized statistical tests for randomness to detect the series potential long-term trend.
• Other statistical tests were applied to discover time series break.
This test makes it possible to better characterize the chronology of changes of each parameter used in order to understand the underlying mechanism. The existence of a time lag can clarify the triggering effect of one or another parameter. 225
A break is defined as a change in scores over time due to more than just chance [37]. In terms of statistical likelihood, the break is linked with the no stationarity of the time series. The meaning is a date or a short period of time when an effective change occurs. The software used was Khronostat that suggests five statistical tests on the 229 series homogeneity (IRD, 1998). Three tests were applied:
• The Mann Whitney non-parametric test which was modified by Pettit [38];
• Bayesian method by Lee et Heghinian [39];
• Segmentation method by Hubert [40].
The Sheffé test was previously applied to test the null hypothesis of no break and the confidence level used was 99% and 95% [41]. In case the hypothesis is rejected, these statistical methods suggest a date for the break and the period around this date. The Hubert method allows for detection of several breaks in a time series [42,43]. When the other tests have been applied a first date of break is then suggested. Subsequently, the method is iterated with sub-series to look for existing second break. Finally, the series were subjected to the correlation calculation to detect a certain cyclical periodicity. The significance level (p) was α = 0.05.
The chronological progress for the coastal landscape was recreated using the shoreline shift, the climate variations observed and little knowledge on the natural habitats as well marine as continental [44].
The reference to climate projections and paleo shores opens up the discussion on the risk of ecosystem service change under climate change. In this perspective, some recommendations are proposed to take into account the risk in the diverse strategies for the coastal management with new vision related to the ecological equivalence concept.
Results
The dynamics depend on the coastal segment
Over the three periods between the years 1985 and 2017, the shoreline dynamics depend on the coastal segment of the study area. Several cases have been characterized and illustrated by one segment (Table 3).
| Dynamics | Coastal segment |
|---|---|
| Stable | N° 1: Râs Tagarît - Tanoûdêrt |
| Continued progradation | N° 2: Lekhceîm – Tanoûdêrt |
| N° 3: Techekché | |
| Regression with breach in the shore dune system | N° 4: Imgoutene – Lekhceîm |
| N° 5: Bellaa’t (West Tintan peninsula) | |
| Regression induced by marine submersion | N° 6 : North and West of the Tidra island |
Table 3: Segments illustrated six dynamic patterns in the study area. The segments are plotted on the map (Figure 1).
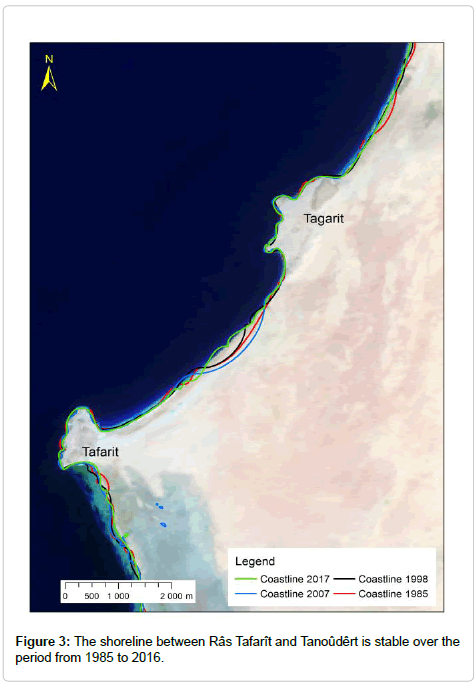
Stable coast: Râs Tagarît-Tanoûdêrt: This coastal segment doesn’t show much change in the period (Figure 3). Its orientation WSW-ENE represents a break in the southward sediment drift which is as a result of the hydrodynamic pressure. A deposit area is uploaded on the east in shallow waters.
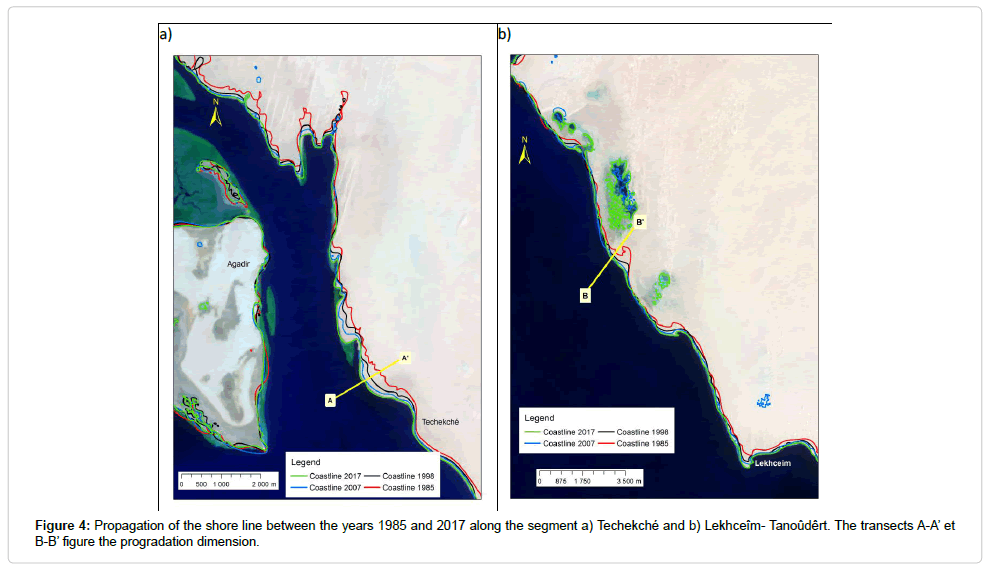
Continued progradation: Lekhceîm-Tanoûdêrt and Techekché coasts: These segments show a continued progradation over time, under the filling in of spits that have been periodically formed (Figure 4). The progradation is wider on the northern Techekché segment (Table 4). The geomorphology of the Arguin Gulf limits the development of the drift current with a southward direction. In consequence, the accretion of sediment is less relocated. In addition, the dynamics decrease over time.
| Period | Propagation (m) Lekhceîm | Propagation (m) Techekché |
|---|---|---|
| 1985-1998 | 163 | 300 |
| 1998-2007 | 72 | 146 |
| 2007-2017 | 65 | 43 |
Table 4: Evaluation of the shoreline shift along the transects A-A’ and B-B’ and over the three periods.
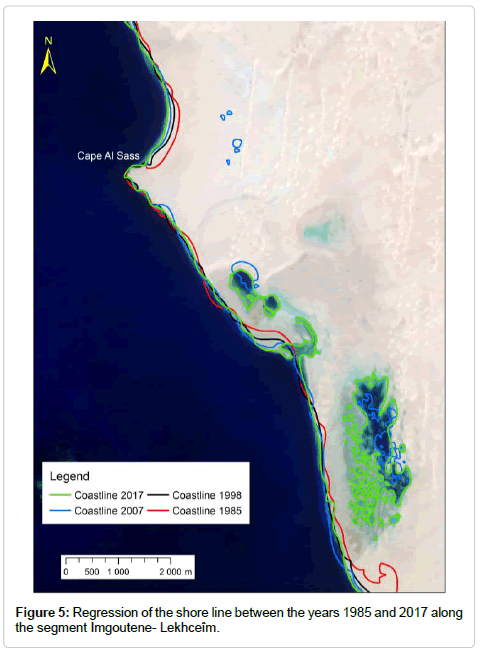
Regression with breach in the coastal dune system: Both segments on Imgoutene- Lekhceîm and Bellaa’t-West Tintan peninsula show a multi decadal cycle of breach in the coastal dune system. Each situation is detailed separately 274 because the dynamics and the underlying processes are quite different. Imgoutene- Lekhceîm . This segment is characterized by a progradation over the two early periods with accretion, split shaping and filling in. In 2007, two flooded areas persist not far from the shore. Finally, they are in connection with the sea across a channel that is located in the northern part of the segment and opened seaward with a breach into the east of the spit (Figure 5).
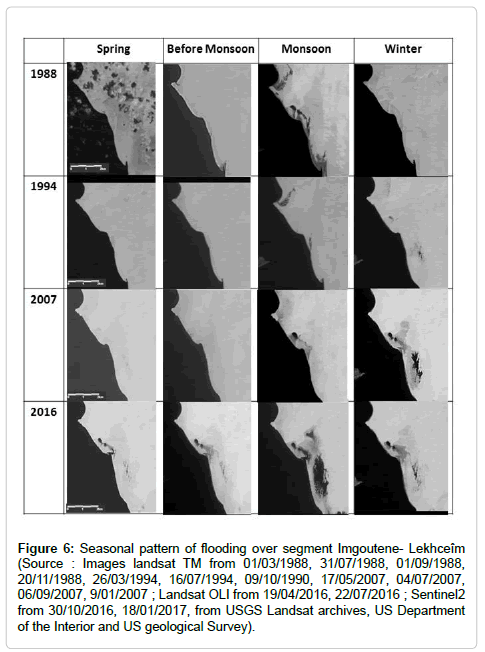
A more precise observation of the situation from 1984 to 2017, with the help of satellite imagery reveals two different timescales of variation: one seasonal and the second multi decadal (Figure 6). During the monsoon season, several areas were more or less flooded. In 1988, during the period just before the monsoon, some moisture and water patterns were also detected on the North of Ras El Sass and South of the area. These resurgences match ancient wadi mouths of the Chibka river system.
Figure 6: Seasonal pattern of flooding over segment Imgoutene- Lekhceîm (Source : Images landsat TM from 01/03/1988, 31/07/1988, 01/09/1988, 20/11/1988, 26/03/1994, 16/07/1994, 09/10/1990, 17/05/2007, 04/07/2007, 06/09/2007, 9/01/2007 ; Landsat OLI from 19/04/2016, 22/07/2016 ; Sentinel2 from 30/10/2016, 18/01/2017, from USGS Landsat archives, US Department of the Interior and US geological Survey).
Around 1988 and again from November 2011, a main channel does the connection between the flooded areas inland and the ocean. A breach opened north of the Cape in the 1980s and in the center of the segment later respectively. The lack of image earlier than 1988 doesn’t give the opportunity to assess the duration of the first breach. On the contrary, from November 2011, the one located in the center has been changing in shape but never fills in 294 totally. A flood area persists even when it isn’t the monsoon season.
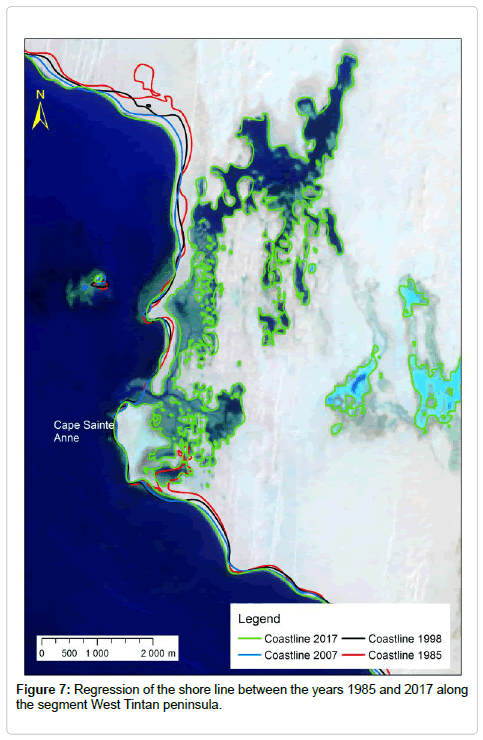
Bellaa’t around Cape Sainte-Anne on the west side of Tintan: The multi decadal dynamics detailed in the previous case is similar over this segment (Figure 7). No seasonal pattern is detected while it is the case in the center and on the southeast of the peninsula. A breach was opened on the South of the Cape in 1985. The main channel seems to be completely filled-in in the early 1990s. In October 2012, a new breach appeared on the North of the Cape. It was filled in and broke again around September 2013 to persist until now. The near sebkha is flooded and forms a lagoon over 1200 Ha in May 2016 (En Haut! Pers. Comm). Three branches are developing. Until now, the southward one doesn’t show a breach as it did in 1985.
Regression under erosion pressure: North and West of Tidra Island: The focus over this area lies in its ecological interest provided by the natural habitats that are developing over there. The geomorphological features are deeply complex; it looks like an estuary’s maze of marshes, tidal flats, islands and shelves. The channel network is shaped by currents. The delineation of the shore line through satellite imagery is very doubtful with the numerous tide pools and results showing a fragmented line. Like in the case of the Imgoutene- Lekhceîm segment, two timescales are interwovened.
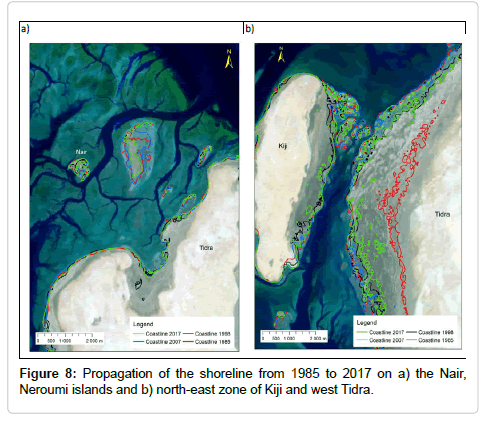
A multi decadal variability is illustrated by a regression prior 1985. Then, a fast progradation occurred until about the year 1998. Finally, a new regression phase is still on-going (Figure 8). Winter accretion alternates with marine submersion and erosion in spring and fall period. The accretion period could be interrupted by erosion events and the seasonal cycle is not regular.
The multi decadal variability in the sedimentary inputs that are easterly wind-driven, is again observed in this central and southern area of the Arguin Gulf. The sediment load looks very low on the images taken in 1972 and 1984. On the western plain of Tidra Island, the shore line moved landward about 2km from its location in 1998. In fact, the accretion reached a maximum around the year 1995. The western plain of Tidra was uploaded and series of sand banks which lied between the Kiji and Tidra Islands reduced the channel mouth less than 500m wide. During the following period to 2006, an unstable situation resulted from numerous hazards but the balance was a progradation. The Neroumi Islet looks like an exception with a regression phase that started as early as 1997 to 2006 on the other areas around. More and more frequent and extended submersion suggests a new regression phase is on-going.
Climate parameters linked with coastal landscape building
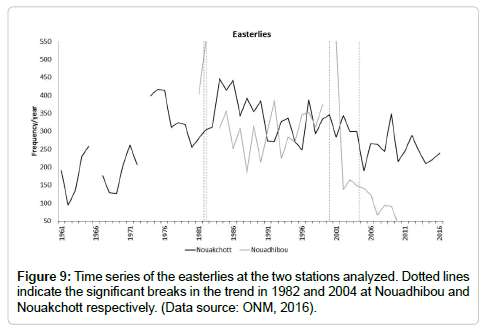
Wind pattern variability: Easterlies: The easterlies with a speed over 6 m.s-1 drive the soil particles shift coastward from the continental areas. Nouakchott station records more easterlies frequency than Nouadhibou station (Figure 9). In fact, the latter station is not situated in the main atmospheric easterly flow. Three multi-annual periods can be distinguished. The decade before 1972 is characterized by large negative anomaly in easterly frequencies at Nouadhibou station. Then, the easterlies increased to peak in 1984 at Nouakchott and 2000 at Nouadhibou 2004 marks a break toward a large deficit period. The year 2009 was an exception in the trend. At Nouadhibou, the easterlies deficit reached almost 75% between the two periods considered.
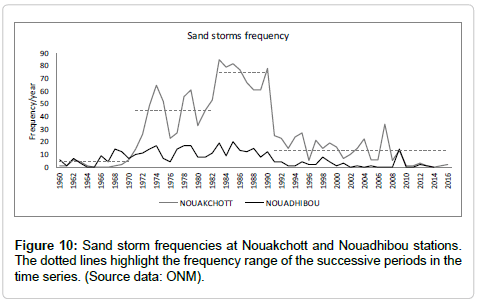
The sand storm frequency series shows a similar variability (Figure 10). The great drought period is characterized by easterly winds dominance and in consequence by the high occurrence of dust storms and sandstorms. A large deficit almost 82.7% and 75.5% has been recorded after 1991 at Nouakchott and Nouadhibou stations respectively when comparing with the previous period.
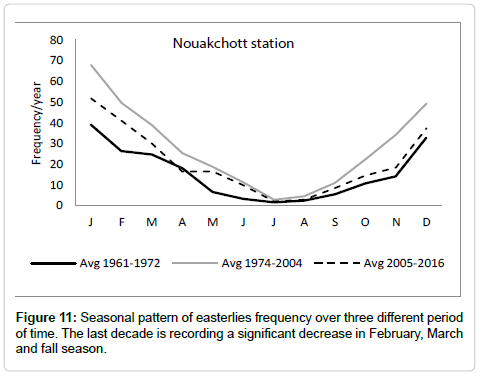
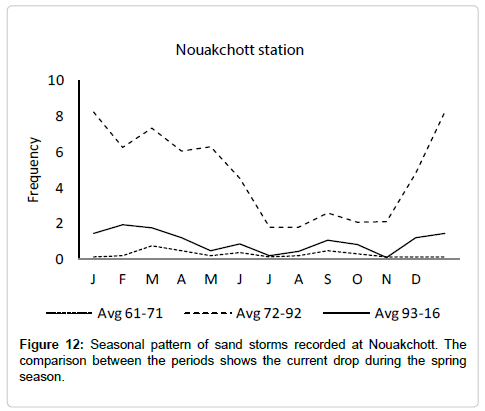
The season of easterlies extended from October to March during the period of high frequency from 1981 to 2000-2004 (Figure 11). In comparison, the easterly are limited to the winter season that corresponds to a significant decrease in March and fall during the current period. While the decrease in easterly frequency is higher in fall than in spring time, the seasonal pattern of sandstorm shows a large drop from December to April (Figure 12). Even in a period of monsoon, the humidity limits the resuspension of sediment and dust under wind pressure. This season is not particularly prone to sandstorm whatever the frequency of easterly, apart from the 1983 to 1990 period that corresponds to the great drought. This period gave cases of sand and dust storms in monsoon season while particles are trapped into squall lines.
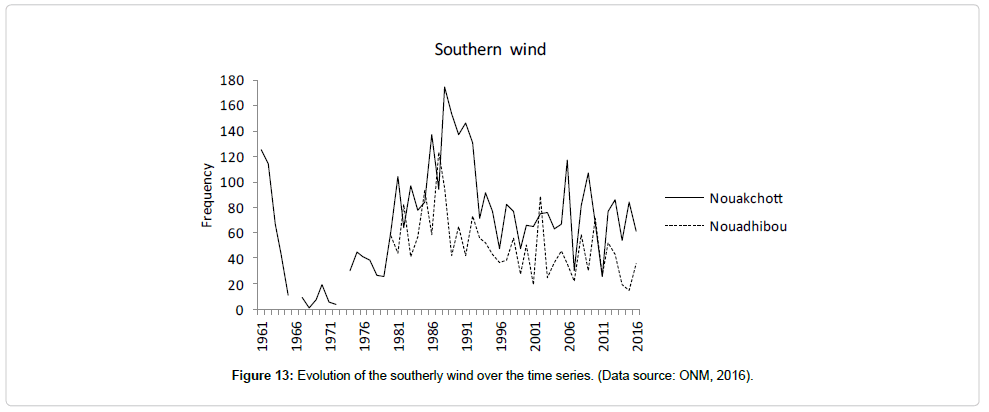
Southerly wind or monsoon storm: The time series show decreasing frequencies from 1994. This date isn’t a break with a statistical angle but it corresponds to a probability density; a high inter-annual variability remains the main pattern after this date (Figure 13).
The southerly wind impacts more the south part of the Mauritanian coast because they are linked with the ITCZ system as it is confirmed with the seasonal pattern. The seasonal peak has shifted from July to September over time (Figure 14a). But, the frequency and the peak month show a high inter-annual variability (Figures 14b and 14c). Some years are uncommon with repetition over several months like in 2007 or even over spring and fall like in 1988.
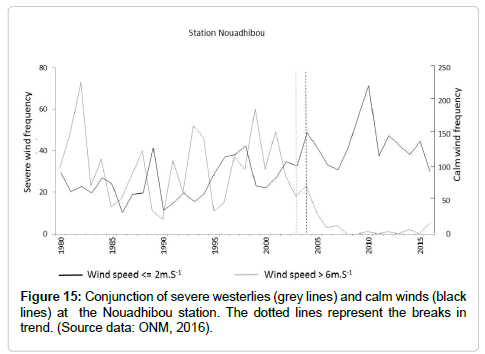
Westerlies and hydrodynamics: The severe westerlies with a speed over 8 m.s-1 are analyzed in conjunction with low wind which corresponds to speed rage less 2 m.s-1 whatever the direction of winds. Over the Nouadhibou data series, two periods show different westerlies patterns (Figure 15):
• The period 1980 to 2004 is characterized by a high frequency of severe westerlies.
• After 2004, the intensity of the westerlies felt down that is illustrated by a drop in severe westerlies frequencies (>8 m.s-1) but an abrupt increase in westerlies of a lesser intensity (>6 m.s-1) with a peak about 2012. In 2016, the frequency of severe westerlies (>8 m.s-1) reached a little peak. It is too early to suggest that corresponds to a new cyclic period.
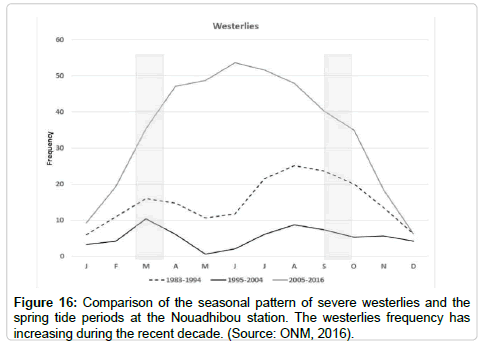
In opposite way, the calm wind frequency was gently increasing since 1980. A significant 388 break in trend is calculated in 2003 that it marks a greater increasing trend. Severe westerlies raise up waves and in consequence the sea level; the marine submersion is then eased to flood the low coastal plains whose altitude is no more than 1 to 3 meters high. These severe westerlies are linked with the ITCZ front and storms. From 2012, the frequency of severe westerlies has been rising up to twice the average over the period from 1980 to 2016. In addition, 40% of these hazards have been occurring during the fall season while 395 spring tides happen (Figure 16).
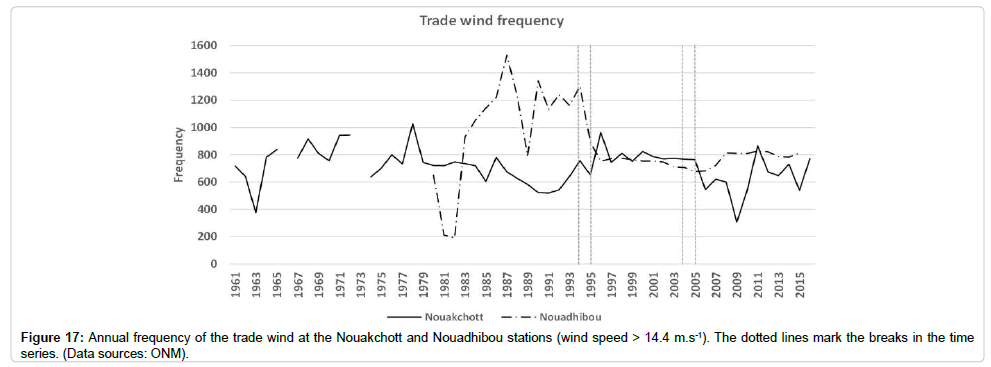
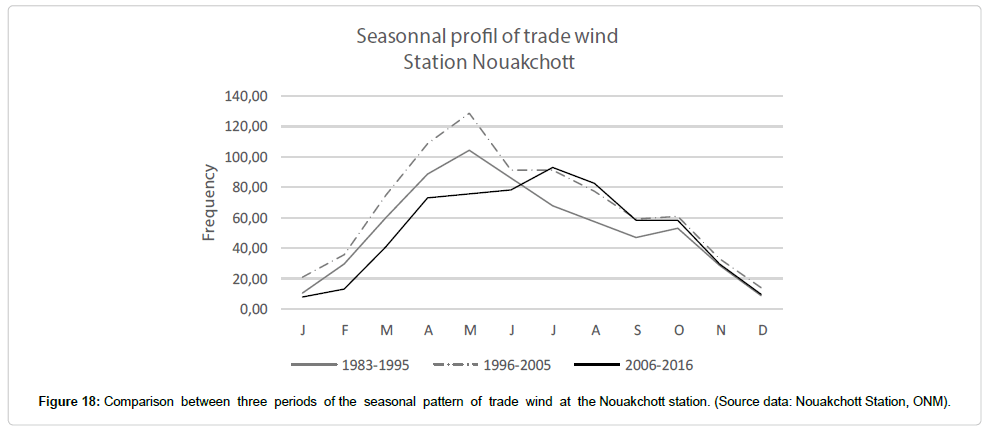
Trade wind as a driver of the coastal drift across the Arguin Gulf: The trade wind is the common picture of the north-western Mauritanian climate. This feature illustrates the effect of the Atlantic weather system on the climate of this zone. These winds settle around April, peak in the middle of the summer before decreasing to the end of October. The time series show a significant cyclic period of about nine years (confidence rate 90%). Successive multi annual periods interweave with this cycle without a long-term trend (Figure 17).
Two breaks in trend were detected in the years 1994 and 2004 at the Nouadhibou station. The years 1981 and 1982 show extreme values. A shift of the progress with break dates delayed to 1995 and 2005 at the Nouakchott station is observed. Notwithstanding this, the breaks are not significant and correspond to two peaks of probability densities.
Nevertheless the frequency decrease is significant from the two last decades, particularly at Nouadhibou that is more exposed to this trade wind. The speed of these trade winds also shows a noticeable decrease.
The comparison of the seasonal pattern between the three multi-year periods details the deficit that was recorded since 2005. The decrease is well distributed over the season at the Nouadhibou station while it affects Nouakchott mainly in April and May (Figure 11). At both station, the average intensity of the trade wind dropped, accurately at spring season over the last decade. The Nouakchott station is less exposed than Nouadhibou to this trade wind and then, the drop in frequency corresponds with a drop of intensity under 4 m.s-1 in numerous occurrences (Figure 18).
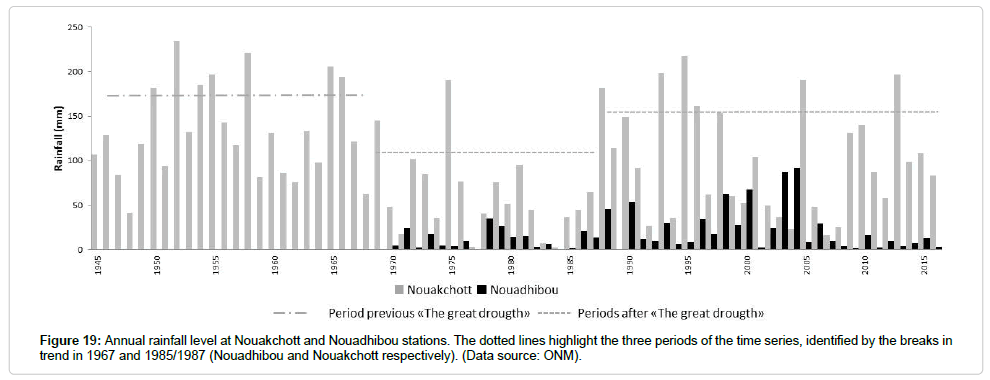
Rainfall: Annual precipitation levels: At each station, the annual precipitation levels show a wide and significant inconsistency which is specific to the Saharan climate. However, both stations reflect a specific multi- decadal variability (Figure 19). A cyclic period of about eleven years is detected on the Nouakchott series. This pattern isn’t significant in statistical terms over the period 1945 to 2016 while it is over the sub series from 1970 to 2016 with a confidence level of 99%. At Nouadhibou, a cyclic period seems to be around nine years but the statistical confidence is less than 90%. The tests applied reveal two breaks in trend on the Nouakchott station. The first one around 1967 to 1969 corresponds to the start date of the “Great drought” which severely affected all the Sahel - Saharan region. The rainfall level decrease reached 35% between 1945-1967 and 433 1968-1987.
The second noticeable change is marked with a probability density in 1987 (around 1985 to 1989) at Nouakchott and 1985 at Nouadhibou; this break is not statistically significant. The year 1988 had a specific pattern. It marked a period characterized by maximum rainfall levels such as those prior the Great Drought. Nevertheless, timely drought occurred again. The inter- annual variability has strengthened. The rainfall range has increased about 41% in average during the last decades from 1988 to 2016 in comparison with the earlier period.
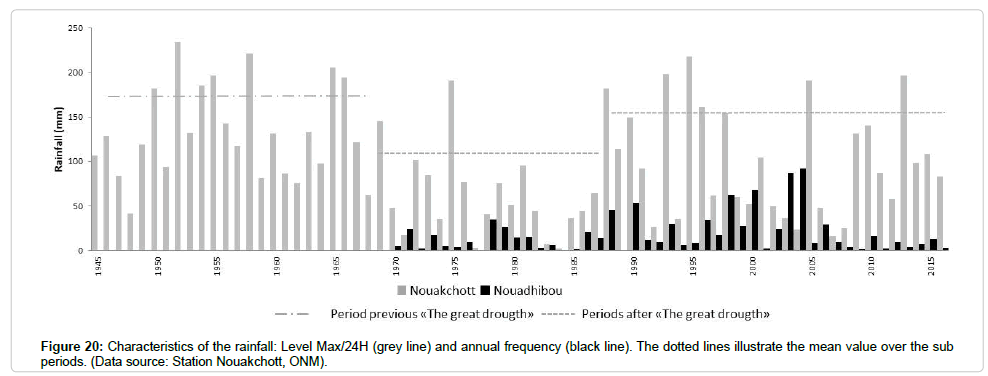
The rainfall frequency series shows a break in trend in 1981 which corresponds to a significant decrease. However, few years i.e., 1988, 1996, 2005 and 2014 recorded a high rainfall level in consequence of only one or two severe storms (Figure 20).
The level max parameter illustrates the large and significant variability of the rainfall. Neither trend nor break appears on the data series.
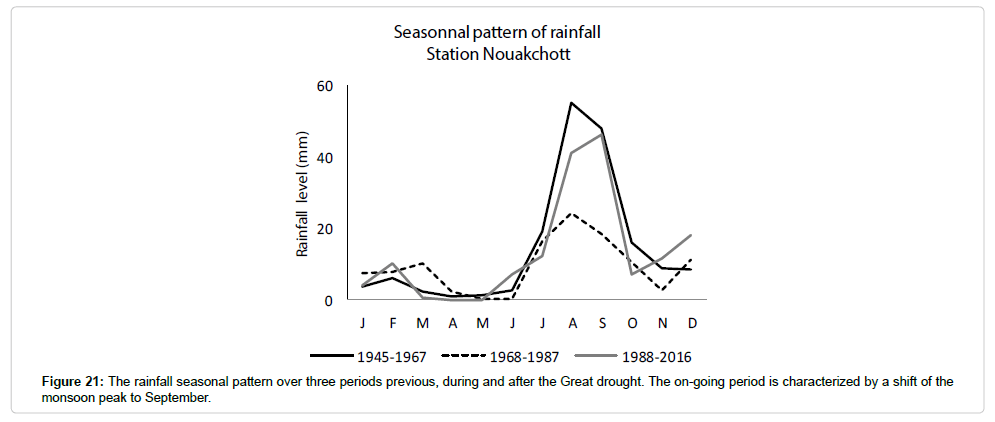
The seasonal pattern shows some changes. Variations in the level max of rainfall are detectable on a time scale as well as on the annual time scale which was detailed previously. But, the peak has shifted from August to September during the last decades from 1987 to 450 2016; in addition, some rainfall may be recorded in June when the monsoon process is 451 underway (Figure 21).
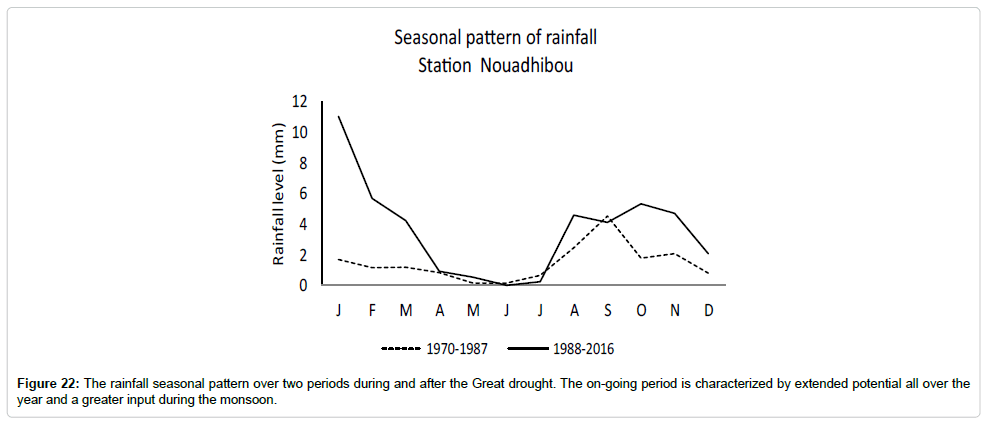
Another change is the increasing rainfall occurrence in winter time, outside of the monsoon; this change concerns mainly the December and February months. The latter was common with a lower level until the 1980s. This change is very relevant because of its effect on the green productivity and the sediment wind driven. The higher the frequency of rainfall, the higher the grass growth and the less the wind driving of the sediment is efficient. In addition, the vegetation captures the sediment and in consequence limits the shift toward the coastal zone. The humidity parameter wasn’t considered in the study. The comment related to this concern is less evaluated when regarding only the rainfall because the humidity could be high without it. The seasonal pattern recorded at the Nouadhibou station has also progressed over the last decades from 1985 to 2016 when increasing and potentially extending all over the winter and the monsoon months (Figure 22). During the earlier period, the rainfall was limited to September. The winter changes from 4.5 to 5.8 days per year are reflecting the annual level increase prior and after 1985.
Sea level rise: The sea level has been rising at around 2 to 4 mm/ year on average from 1993 to 2012 for the eastern tropical Atlantic (44). The monthly sea-level data available from the PSMSL repository for the two tide gauges in Dakar with associated linear trend (least-squares adjustment and formal uncertainties give an increase about 1.2mm/ year in average that doesn’t match the calculation done for Nouakchott from spatial data. Existing series at different places around the word allow for the detection of a speeding up of the trend that was around +1.6mm/year in average over the period 1880 to 2015 while +3.6mm/ year from 1993 to 2015 (Table 5). The projection of the rise around Nouakchott looks like the world average according to the scenario of the lowest greenhouse gas emissions as well as the highest one.
| Localization | Period | Increase (mm/year) |
|---|---|---|
| World Average | 1880-2015 | +1.6 |
| 1993-2015 | +3.6 | |
| Dakar | 1942-2012 | +1.2 +/- 0.2 |
| Near Nouakchott | 1993-2012 | +2 to +4 |
| World Projection | à2100 | +3.3 to +11.5 |
| Nouakchott projection | à2056 | Low +4 to +8.75 |
| High +5 to +10,5 | ||
| à2090 | Low +2.9 to +7.7 | |
| High +5 to +12.1 |
Table 5: : Increasing sea level rise and context of the world average rate and the projected value (Source: Dakar (Cozannet et al., 2015); World (IPCC et al., 2014); Near Nouakchott (GERICS, 2015).
Coastal natural habitats
Continental vegetation and halophyte During the 1990s, the cameleers’ pressure increased on the coastal halophyte vegetation in consequence of the global scarcity over the eastern land of the country. This coastal vegetation was considered as the last forage plant available. There is no up to date data on how sufficient the habitat regenerated. The marine submersion of the Bellaa’t lagoon led to a loss for the terrestrial plants along the north-east and north-west extensions.
Marine seagrass bed habitat
Over the central part of the study area, the seagrass bed has been gently increasing since 1985, especially on the lower tide level (A.O. Sidi Cheikh, Pers. comm.). However, local events of degradation were observed and could be linked with severe climate hazards that caused leaves desiccation when low tide occurred [45], (Littaye and Sidi Cheikh, in press, 2018). Over the two new developing lagoons, the persistent inundation creates the context required for the seagrass settlement along the Bellaa’t channels and north of the Lekhceîm channel. In the latter location, the seagrass is developing through a much localized patch in consequence of the large variability of the geomorphological context. The replacement of the natural habitat over these areas must be considered as an upgrading level of the ecosystem value. Unfortunately, such a seagrass development inside the Western Tintan lagoon was not observed when a lagoon already existed around the year 1972. Nevertheless, the knowledge of the biology of seagrass bed suggesting the water change rate under the tidal process is sufficient to maintain non-lethal temperature and salinity condition. This context may have been the case around the year 1972 as well as it is currently with the openness of the enduring barrier dune.
Mangrove swamp and wetlands
The successive monitoring of the Cape Timiris concluded that the mangrove swamp has remained stable between 1954, 1984, 2003 and 2008, even though different methods were used [46]. The Cape Timiris is outside the study area but this result is a good indicator of the soil and environmental conditions that seem to favour the maintainance of this species at the northern limit of its range. If the swamp localized between the Neroumi and Tidra Islands were not recently investigated, the Iwik bay swamps would have done as well as the El Aïn area at Mamghar. These two swamps are subject to natural regeneration of the mangrove and halophyte plants. A Zygophyllum plant development has been observed as well as along the southern channel of the new Bellaa’t lagoon. The revegetation of the wetland was undertaken around the low islands of Nair, Cheddid and Touffat in 2008 and 2009, which included the shoreline stabilization with sand bags. Various plant belts have been developed.
Summary of the results: Dynamics under several temporal scales
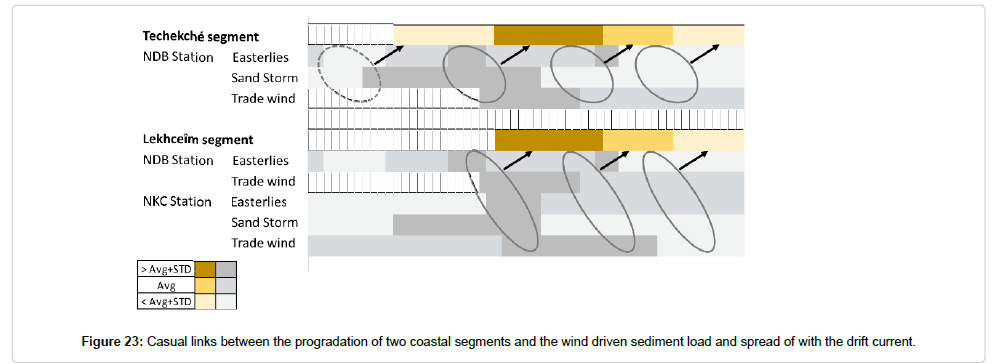
Several time frames of climate variation overlap and can explain the progresses of the coastal landscape of the north-western Mauritania. The progradation of certain coastal segments is controlled by the coastward wind driven sediment with easterlies (Figure 23).
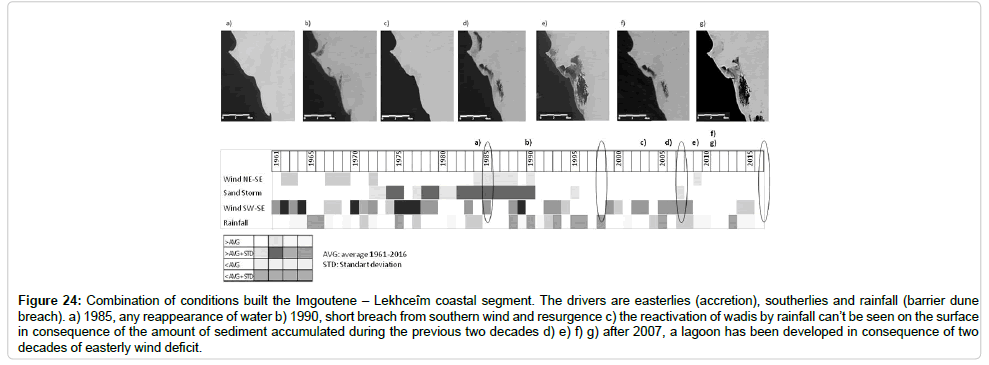
The segment where a regression is taking place at the northwestern Tintan peninsula could be shaped by the sediment load and the hydrodynamic pressure. These two drivers for change show interannual and multi-decadal variabilities. The same drivers are involved on the Imgoutene-Lekhceîm segment in addition of a third one that is the rainfall (Figure 24). The latter provides a seasonal dynamic and when it is added to the greater local sediment flow, it enlarges the interannual variability. Just as well, the seagrass bed development is limited with the higher degree of dynamic than the Tintan area. The vegetation is restricted to a patch over the mouth of the channel. North-east and east winds appear as the major driver of coastal dynamics. Winds from other angles and rainfall represent secondary parameters at the decadal time scale. The sea level rise is a driver that adds to the effects of previous parameters but it is sensitive at a higher time scale of the century or millennium in dynamic terms.
Figure 24: Combination of conditions built the Imgoutene – Lekhceîm coastal segment. The drivers are easterlies (accretion), southerlies and rainfall (barrier dune breach). a) 1985, any reappearance of water b) 1990, short breach from southern wind and resurgence c) the reactivation of wadis by rainfall can’t be seen on the surface in consequence of the amount of sediment accumulated during the previous two decades d) e) f) g) after 2007, a lagoon has been developed in consequence of two decades of easterly wind deficit.
Paleo-shoreline insights
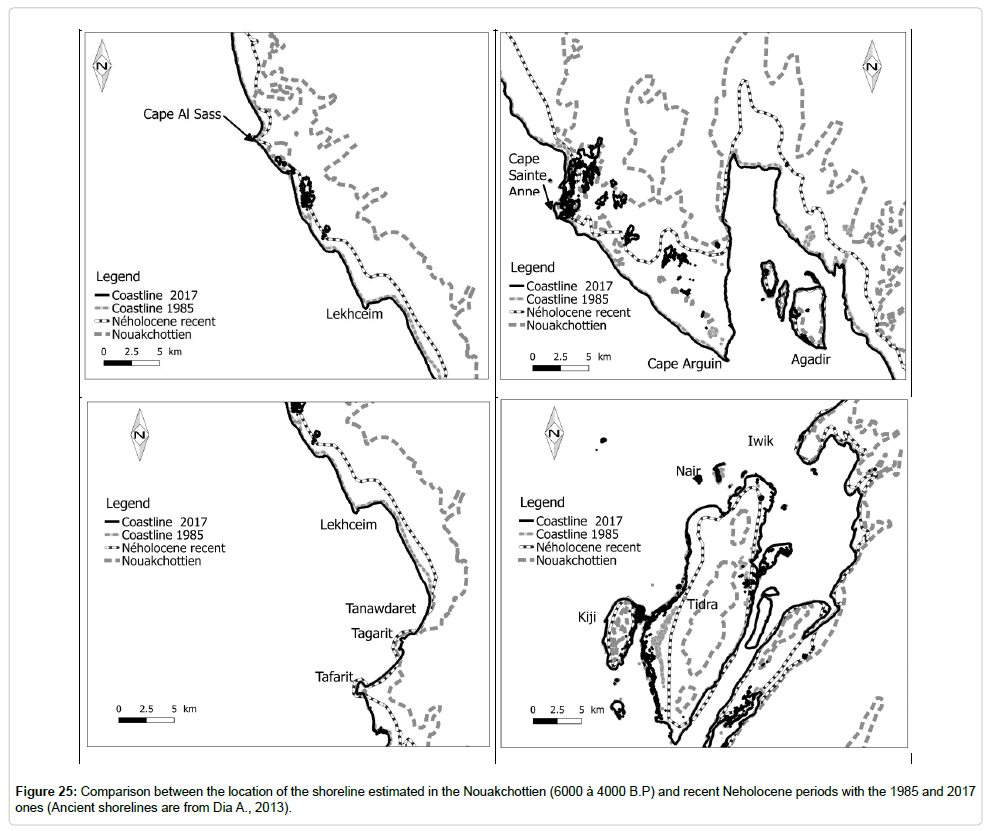
The thousand years’ time scale of the paleo-shorelines studies show the results of progresses which were aggregated from shorter time scales. The future development of the coastal landscape will be benefited through innovative insights. The latter is provided by comparing the under lying processes between various periods of time as ancient and as well as recent through the most demonstrative cases (Figure 25).
Discussion
Landscape drivers for building
According to the location all around the coast, the dynamic is differentiated. Two underlying hypothesis can be suggested, which explain the recent dynamics as well as the ancient. The first one can be the northward shift of the atmospheric flows and though hydrologic ones, which are involved as shapers. In consequence, the drivers for change have affected the landscape with a localized chronology whether north or south. The second hypothesis is the role of the geomorphological pattern inherited from the successive steps of the coastal building and shaping; it ca condition the range and the direction of the sediment processes [47].
Stable segments
The shorelines between Râs Tafarît and Tanoûdêrt stay stable during the study period as well as during the secular history from the Nouakchottien era. The existing narrow and submerged shoal along the current shoreline reinforces this view. It is located along a cliff. The western to eastern orientation suggests that its building was controlled by a western swell that created a sand tombolo on the east side of the rocky islets named Râs Tafarît and Râs Tagarît [48]. The beach accretion ran through the meso-neholocene period and extended to Tanoûdêrt. The sediment transit is always active but its direction was moved southward. The bathymetric map outlines an underwater basin that is located offshore between the two rocky Capes; this feature is connected through paleo valleys on one side with the beach and on the other side with a large central basin of the Arguin’s Gulf [2]. The sediment flows, whatever the volume over the last decades, would be washed down into the basins just in the frontline of the segment detailed. In addition, accretions have been uploaded on the eastern Tanoûdêrt bay and over the western area of the Cape Tafarît.
Segments under progradation near the coastal sebkhas
The segments which are located on the north of Techekché and the centre of Lekhceîm –Tanoûdêrt show a persistent progradation albeit a slower pace over the last decade. The comparison of the shoreline between few dates corroborates the accretion processes detailed to explain the building of these segments during the recent Holocene period [47].
The alternation of arid and humid episodes of climate conditions and the variation of high and low load of wind-driven sediment controlled the successive building phases such as spits, berms 583 and sediment barriers that have been extended seaward.
Such morphological features are visible through the satellite imagery used. The coastal dynamics over the last six decades could be explained by the chronology of the multi-decadal variations for the three drivers that are easterlies, sand and dust storms and trade winds. The largest extent of the progradation around Techekché may be the result of a lesser redistribution of sediment by the drift current that is limited considering the shape of the Arguin Bay.
The sediment volume measured by several authors are varied according the date and the field station; nevertheless, it records one of the highest flow of West Africa [49,50]. This sediment load defines the resilience degree to erosion as it is illustrated when the Imgoutene- Lekhceîm coastal segment is compared between the different periods identified.
At a secular time scale, the multi-decadal variations were smoothed and the observation at a given date represents the result after the previous period reshapes. In dynamics terms, the progradation along the PNBA coasts was around 1m/year in average between 3200-3080 BP and 2012 [47]. It reaches around 10m/year in a shorter period from 1985 to 2016. The on- going slowdown observed from 2008 to 2015 does an initial stage of a trend reverse as the deficit in sediment suggest with a speculative view.
Segments under regression
Many segments are affected by a regression after two decades of stable pattern from 1990 to 2010. Three different cases are detailed with regard to the underlying processes suggested.
Bellaa’t lagoon at the West of the Tintan peninsula: The two regression periods observed from 1973 to 1990 and then from the fall season 2013, are as a result of many years of easterlies and sand storm deficit. Under opposite climate context from 1991 to 2010, any marine intrusion was detected on the satellite imagery. More accurately, some resurgence or flooding has been occurring at the central area of the peninsula and the southeastern coast from 2006. Some reports were made in September 2009 and November 2011 [51].
The occurrence of resurgence in the central area starting in 2006 suggested a reduction in the sediment charge. From 2012, oceanic storms are twice frequent than the average from 1980 to 2016. In addition, 40% of these hazards happen when the spring tide period is running. In September 2013, a peak arose in severe trade wind (higher monthly frequency value of wind >8 m.s-1 from 2000-2016). The conjunction of this hazard and spring tide generated a sea level rise up and a swelling of the land resurgence eastward the Cape. The sand dune barrier broke at the end of the bay lying north the Cape. A channel has extending and the marine flooding has sunk three branches. In February 2014, the southeastern branch was filled then again submerged in fall. In May 2016, the new developing lagoon reached around 1200ha wide (En Haut! comm. Pers.).
In 1973, the coastal break happened in the South of the Cape while it occurred in the North in 2013. The southern storm frequency peaked from the 1980 to 1993 decade and the maximum was almost 22 days/ year around 1988 to 1991. The lack of complete available data over the period earlier than 1972 didn’t allow hypothesis on South wind but the period from 1962 to 1969 was characterized by a lower frequency range for easterlies [52]. In addition, the filling in of this southern break started around 1990. The sediment load balance should be enough to compensate for the resurgences and the severe southern wind pressure that has only dropped after 1994. On the contrary, the high level of easterlies from the 1970 to 1980 decade, particularly from 1978 to 1982 has not been sufficient to fill in the flooded areas. These delays reflect the resilience in terms of sediment volume required to resist the swelling erosion process. The decreasing load and subsequent resilience is also illustrated through the frequent flooding of the center and southeast areas of the peninsula without noticeable regression of the shoreline at the moment [1]. In the beginning of 2017, the north to northeastward extent of the developing lagoon has reached the paleo-shore estimated at the Nouakchottien time. The design and the location of this breach reminisce of the maps that have been drawn during the XVIII century by d’Anville [53]. Few years earlier, Bellin has noted on his map the location of salt ponds on the northeast of the Cape [54].
The observed dynamics over the six last decades corroborate the key role of easterlies in the coastal building of this peninsula marine plain that is on another side sheltered from the direct effect of the drift current by the Levrier Bay [47].
Lekhceîm recent lagoon: The dynamics of this area is marked by two time scales, one multi-decadal and the second one seasonal. Many indentations and a sand barrier breach on the north-eastern side of the Ras el Sass were shaped around 1990. The rainfall range and the max/24H reached a peak in 1988 and the lowest in 1989 and 1990. These extreme values are recorded both at Nouakchott and Nouadhibou stations. The reviving of the wadis under such conditions supports the seasonal dynamics of this phenomenon [4]. The process has been decreasing from 1991; in 1994, the monsoon flooding only affected the mouth channel and the northern resurgence. The rainfall has also reached significant levels from 1993 to 1998. However, the resurgences were very patchy in 1994 and were not visible after this date. The difference between 1988 and 1994 in the effect of such a climate parameter is suspected to arise from the sediment load and the intensity of the oceanic swell.
In fact, the sediment volume accumulated at the coast should be greater in 1994 because of the extraordinary wind driven sediment input that started in late 1970s, as well as at the North and the south of the Arguin Gulf. Over the latter area, additional inputs have been coming from the drift current. With a speculative view, the resurgence didn’t rise up to the land surface when raining because of the deposition of successive layers. At the same time, the second driver which is the oceanic severe winds peaked in 1988 at the Nouadhibou and Nouakchott stations. In 1994 and 1995, these hazards were also recorded but only at the Nouadhibou station. Such rainy and windy conditions emphasized at spring tide could have been generated enough rise in sea level to flood the area in 1988. After 1994, the beach dune was high enough to limit the impact even when extreme hazards occurred in 1999 to 2002. The resilience reached a strong level.
Five years after the easterlies drop, the seasonal resurgence has started to appear as patchy features and over the same locations. In 2007, the resurgence extended in the fall period, one in the south of Jerf Oustami and the second one near Lekhceîm. During the late monsoon season, a breach opened in the northern location and connected with the flood. In the previous case of lagoon development, oceanic winds are suspected to raise up the sea level and the breach opened at the north of the Ras El Sass Cape. In 2007 and the following years, the southern storms linked to the ITCZ system were suspected to affect the coast and the breach opened in the south of Jerf Oustami. The drift current direction could reverse under such pressure. After 2007, despite the seasonal process of sediment moving, the channel persists more or less. Then, in 2010, a third resurgence has been emerging at the south. The regression has so much progressed that in fall 2012 the three flooded areas were connected. These facts illustrate the deficit of sediment accumulation. Lower rainfall and swell affect the area.
The severe westerlies were more frequent during the period from 1997 to 2002 than from the 1983 to 1993 decade. Indeed the western wind built the tombolo eastward the Ras El Sass and later southward the Jerf Oustami. This chronology could give insight of the different location of the breaches around 1985 and then 2007 [4]. The eastern beach of the Ras El Sass doesn’t yet show any resurgence or breach on the contrary of 1988 situation.
Central area and Islands: The north and the west of the Tidra Island seem to be subject to a complex dynamic. The sediment transport is driven by currents through the Gulf and is also affected by local hydrodynamic processes. In fact, a different dynamic is observed on the three sub-segments which appear the most susceptible to the hydro-climatic conditions: the north and the western low plain of Tidra, the channel filled in multiple sand banks between the Kiji and Tidra islands. This central area reacts to the multi-decadal variations of sediment wind and current driven processes previously described in the cases of the other segments studied. Two types of accretion processes seem combined. Over the western plain of Tidra, series of dune crests with a northeast to southwest orientation are visible on satellite imagery when the area is totally submerged as it is the case prior 1985 and during severe events of the last decade. These groups of dunes are interspersed by cat-back patterns [15]. Their directions suggest a wind driven input of sediment that is mainly fine-grained sediment and dust material when regarding the great distance from the continent [16]. The sand spits extending from the south of the Neroumi Island and along the western Kiji coast as well as the main channels of the mudflat at the north of Tidra, show the same direction northeast to southwest direction. It corresponds to the easterlies upload with sediment and the main marine currents of the Arguin Gulf [15].
The second type of accretion is like a group of barchans that creates a kind of cork between the two islands. Their directions west to east, perpendicular to the flow suggest a marine accretion. The hydrologic study shows a higher turbidity of the water around Tidra than offshore [55].
Both processes have had minimum development prior the 1980s. The coastal sediment charge has dropped during the 1970 decade and the trade wind recorded at Nouadhibou has shows 710 abnormal low frequency. The regression over the western plain was the most extended situation of the study period. Then the drivers for accretion have increased again as well as the progradation. This dynamic shows a multi-decadal variation. At the seasonal time scale, the same climate drivers could explain the sediment accumulation in spring. The trade wind peak around April-May; they are supposed to strengthen the drift current along the continental coast that load the water in sediment and then the current deflects southwestward along Iwik peninsula [55].
The flow of the waters rushes through the mudflat. The deposition affects the bottom of the north Tidra Bay and the mouth of the main channels such as between Kiji and Tidra. This seasonal pattern was often disturbed for example as in May 1995 and it has been no more the case since 2013. In fact, the western low plain of Tidra was submerged in the spring of that year 1995 while it was considered a high deposition period. The eastern side wasn’t affected. The trade wind were extremely frequent and it was combined with severe oceanic 723 hazards (monthly speed >8 m.s-1). Such a value occurring in May has been recorded only 724 twice, ones in 1995 and a second time in 1996. This storm condition could have generated 725 swell fronts which swept the Gulf from north to south and did affected Tidra straight [56]. 726 The resulting sea level rise could explain the exceptional flooding.
For the spring tide, the tidal range is about 1.6 to 2m high in average [57]. The maximum wave range around the west Cape of Tintan can be about 3.6m at an inter-annual scale, 4.6m at a decadal scale and 5.7m at a secular scale [23]. These data give evidence of the shaping of the mudflats under the wave pressure in this area less than 10m deep.
A similar process controlled by the hydrodynamic could also operate in exceptional ways during winter as well as in January 2007. December 2006 to the beginning of January recorded the data peak series of southern wind while this direction commonly occurs in August to September. Unlike the previous case, all along the eastern coast of Kiji and the western as well as eastern coasts of Tidra were affected by the resulting swell. This fact would confirm a different origin of the front waves. Only two months after, in March, significant deposition is noticed over the previous flooded areas. While the sediment load along the continental coast is in deficit during this decade, the sediment input could reflect the deposition of material re suspended by severe conditions. Such sediment system during a storm was described at this most erosion prone areas located north Tidra [56]. In addition, if years 2006 and 2007 recorded the higher wind speed over the period whatever the origin north-west or south, they also showed the record of calm wind that helps the deposition.
The pre monsoon remains the most favourable season for the southern wind linked to thedevelopment of atmospheric instabilities at the ITCZ system. Submersions could affect all the areas of this central zone. During the monsoon, the spring tide range scales up the risk for sea level rise and submersion is common over the season whatever the period. These stronger tidal currents also contribute to local erosion and deposition mainly of fine material [58,59].
Along the continental coast and after 2004, the flooding has become more and more frequent because of the reshaping that occurred in the short period from 2005 to 2007, the low sediment load from the continent toward the Islands and the dust wind driven input. The west coast of Tidra shows a most extend offshore progradation in 2007 than in 1998 as it is along the continent and little islands. This specific character highlights the key role of the hydrodynamic and tidal current in the coastal building over this central zone. The easterlies dropped in 2001. The hydrodynamic is decreasing in average but severe conditions are more and more frequent even irregular while aggregating in all origins.
Coastal landscape adaptation
Mangrove swamp: The potential gain of a mangrove habitat is posed to face the climate change because it could be used as a bioindicator of coastal change as well as a natural barrier adaptation against flooding. The current conditions are not in theoretically favourable to the mangrove development with regards to the temperature, salinity and aridity prevailing in Mauritania and more specifically the shallow waters of the southwestern Arguin Gulf [60]. However, the comparison between worldwide mangrove areas doesn’t allow for a precise geographical threshold latitude for these parameters. It was suggested that the extreme air or water temperature could have a greater impact than the mean conditions [61,62].
The weak propagation observed at Cape Timiris albeit with a great seed production could support a salinity control hypothesis. Meanwhile, the mangroves have been evaluated to be in good physiological health and no degradation was recorded between 1954 and 2008 [13]. Yet, during this period the climate conditions exibited significant variations in rainfall, wind stress and temperature. In the same way, during the Quaternary period the mangroves showed a great resilience to the alternation of regression and transgression of the sea level and this vegetation was well developed in the north-western Mauritania lying all along the rivers [63,64]. Another hypothesis would be that the mangrove resilience depends on the dynamics of change in environmental conditions in terms of sea level rise and the beach’s resistance to erosion [65]. A rate in sea level rise about 9 to 12 cm/century has been suggested while the current projection indicates a rate around 100 cm in 2100 [66]. Any constraint in topography would limit the landward extent of mangrove if conditions are good [67].
Finally, the last set of environmental condition explored to explain the lack of mangrove extension would be salinity. In two cases of ongoing regression at the PNBA, the Tintan peninsula and the Leckhceîm segment show salty resurgences and in consequence the shift upward of the limit between aerobic and unaerobic layers. These processes could affect the proximal roots of the Avicennia species of mangrove; the other species, Rhizophora which is developing in the south of Mauritania is less sensitive to the variation of the ground water table [68]. The actual knowledge never detected any water table over the western plain of Tidra which actually also experiences a regression. A small mangrove patch exists on the north western part of this area. In 2015, the El Aïn wetland near Mamghar village has been subject to a permanent regulation to prohibit any access or anchorage of boats. The monitoring of this area demonstrates the benefit of such an action that is the regeneration of both halophyte plants and mangrove. Another good indicator for the conservation and the development of the species is the increase in the green shoot of the mangrove also reported at Iwik bay since the last three years.
This topic is probably more documented because the shift of latitudinal location of mangrove swamp at their biogeographical boundary has already been observed in some countries [69,70]. Either natural or artificial restoration of this habitat could ease the climate change adaptation of some species of breeding birds. In fact, the reproductive success of the white spoonbill (Platalea leucorodia) has deeply declined over the last two decades as a result of nest flooding in the low lying islands. The mangrove at the El Aïn recovered swamp has offered a temporary habitat during the breeding period for the African cormorant (Microcarbo africanus) and the reef heron (Egretta gularis) because of its height. This change in breeding behavior could illustrate a form of adaptation to avoid flooding and predation by jackals. This kind of observation may encourage the study of mangrove restoration.
Inter-tidal sand and mudflats: The inter-tidal and sub-tidal areas of the eastern part of the Arguin Gulf have experienced strong variations in environmental conditions at a geologic time scale [3]. This past explains the current unicity of the species community patterns that is composed of northern as well as southern origins. Part of them has survived until now [71]. A parallel can be drawn between past climate conditions estimated from the ark mollusk shell (Senilia senilis) studies and the present conditions [72]. Some changes in the relative abundance of few microbenthic species were observed recently [73]. The comparison between data from 1980 to 1986 and 2004 shows that ark abundance increased by a factor of 10. In addition, the total biomass (without the ark species) was dominated by the dosinia species (Dosinia hepatica) at the expense of the lucinia species (Loripes lacteus) [74]. The ark species is indeed euryhaline; the rainfall level quiet recovery for 2001 matches its current development and this causal link could have be proven by the past during humid periods [75].
The dosinia species is a filter feeder. The hydrodynamic affects the upper microlayer of the mudflat when the water turbidity increases. The consequences for the filter feeder are multiple: less efficiency in water filtration to capture organic matter as well as light reduction that affects the phytoplankton production [76]. Each organism gets a specific tolerance limit. Nevertheless the dosinia could be more affected than lucinia when the turbidity condition reached extreme value during the 1980s period. In fact the latter species is living with a symbiotic sulphate reducing bacteria and in this way the host is fed partly with matter provided by the symbiont [77,78]. The benefit of such inter-species relationship could have limited the dependence of lucinia on the phytoplankton supply during the 1980s period. The climate change could have affected the competition between the two mollusks and played a part in the reverse of their relative abundance. This fauna concern is relevant in the coastal landscape development because the ecosystem equilibrium is reflected in the organic matter production and the capture of sediments within seagrass [79]. The seagrass area has increased between 1985 and 2016. The paradox of this current development is that it could probably be as a result of a lower turbidity in the waters and a compensation system to the deficit in sediment flows [80].
Although the climate variations have always affected the coastal natural habitats whatever the period, the survival of certain species reflects a high resilience level. It is suggested that this resilience could be explained by the life cycle adaptation [73]. Nevertheless, the consequences of natural habitat variations are not considered in the same way at the current time. The concerns are now based on heritage or economic values. The seagrass bed could capture twice to triple the amount of carbon gas than dense woodlands and then it represents a way to limit this greenhouse gas [81]. In the same way, the Arguin Gulf contributes to the Mauritanian sea water productivity and the artisanal fishery [9].
Climate change concerns and the development strategy: role of natural habitat: A better understanding of the coastal landscape dynamics should help the national development strategies [82]. The future climate projection for the current century could be discussed in regard with the new results obtained (Table 6). The projections used are based on the global models for climate and must be considered with caution [25].
| Parameters | Likely | Very likely | Comments |
|---|---|---|---|
| Air temperature | |||
| Mean (T°C) | +1.8 to + 1.52 | + 1.3 to + 6.1 | Confidence is medium |
| Max (T°C) | +2 to +5.4 | -- | |
| Heat waves (days) | 10 to 56 | 6 to 79 | Dry season: Large change |
| Precipitation | -28 to + 16% | -44 to + 72% | Rainy season |
| ↘ June-August | |||
| ↗ September-October | |||
| Heavy rains | |||
| Intensity | -2 to -25% | -13 to + 48% | Change can be considered to be weak |
| Frequency | -19 to + 48% | -2 to-25% | |
| Wind speed | |||
| (Annual mean) | -2 to+ 3% | -4 to + 5% | Change can be considered to be weak |
| Sea level (m) | + 0.22 to +0,58 | + 0.38 to + 0,91 | -- |
| (Nouakchott) | (Low emission scenario) | (High emission scenario) | |
| Dry Spell (days) | -1 to + 53 | -9 to + 215 | Confidence is low |
Table 6: Projections of several parameters for 30 years period centered around 2085 and combined for all scenarios (from (GERICS, 2015).
The different models converge to the same air temperature increase and longer heat waves. These trends associated with a rainfall decrease during the hottest months should affect the inter-tidal natural habitat. Dryness conditions such as the situation observed in 2011 could increase. A sea surface warming is projected because of the tropical ocean circulation slow down, a trade wind decrease and upstream mechanisms involved and finally a Saharan dust output [83]. These climate changes may also result in a drop in the biochemical cycle process of the tropical marine waters and then in productivity [84]. This productivity also contributes to the tidal flat development and it is more crucial now because the wind driven sediment input dropped.
If the easterlies future level is not expressly stated, the study results may not suggest expedient return to a coastal sediment accumulation that represents the key context for coastal building and the coast resilience to erosion. The future projection of a boost of submerged areas is a consequence of the deficit; waves with a lesser height should be enough to flood the coast plains because the dune barrier is widely vulnerable whatever the sea level rise dynamics at a short term.
All the coastal areas built during the Neholocene age would be submerged; the future shoreline would align with the paleo line estimated under the transgressive maximum at the Nouakchottian period [51].
Several marine intrusions would fragment the coast along ancient wadis in addition of the on-going ones at the northwest of the Tintan peninsula and Leckhceîm. The northeastward intrusion could extend to around sixty km wide in average [85].
The dune erosion occurs under the severe storm events which generate swells of about few meters high. Any trend in storm frequency increase is now observed and any projection about this factor finds a consensus. Nevertheless, the erosion rate could be increased by a factor of 3 while the sea level rises up to + 1m and by a factor of 1.8 in case of a lesser sea rise of about 0.5m. These estimations were established for Nouakchott area but illustrate the current coastal vulnerability context [32]. The Arguin Gulf shallow waters would limit the wave range; indeed the erosion trend is underway.
The shoreline moving implies a loss in coastal terrestrial habitat and in the same way a gain in marine ecosystem. This kind of natural change is illustrated by the new lagoon around Bellaa’t. The future of the sand and mud flats mainly on the central area of the Gulf represents an issue and specific experiments are required. The loss at high tide of the low lying islands such as Nair and Neroumi may be confirmed because of persisting lack of wind driven 888 sediment input.
The above environmental changes should be considered in terms of ecological equivalent because the risks are mainly heritage conservation challenges and economic issues [86]. The population affected is reduced and the society change encourages migration and temporary settlement.
The opportunities for beach stabilization and erosion control have been demonstrated through the vegetation restoration operated on the islands in 2008 and 2009 then at Mamghar in 2015. If the benefit has not been the nesting conditions, the islands would still serve as a repository for birds and a feeding area at low tide. Maintaining the Arguin Gulf attractive is crucial to nutrient input on the flats particularly in the perspective of a decreasing input by wind driven dust from the Sahara. In addition, a healthy ecosystem could benefit the sub-regional birds as habitat degradation looks unfortunately global [87]. Positive changes illustrate some direction and offer hope for a potential scope for action. The first step is based on the identification of the origin in variation whether local climate or human.
The new lagoon developments represent a natural compensation for seagrass, bird feeding areas and larval habitats. The change in behavior of few cormorants may encourage the revegetation action as well as the beach stabilization.
The positive effect of the current climate change on crucial ecosystems such as seagrass and wetlands also encourage the enforcement of their conservation. In fact, the lack of control on some fishery practices could emphasize the negative aspects of climate change. For example, several ray and shark species have been overexploited for more than 20 years. Some of these species contribute to control the ark mollusk population [88]. The range of the competition towards dosinia and lucinia are currently studied to understand the nature of risk on the seagrass bed.
Conclusion
The analysis of the climate change through a multi-decadal and a seasonal scale supports the coastal landscape building processes over the northwest of Mauritania. Until now, these processes were studied mainly with a millennial scale. Easterlies and trade winds look like the key drivers for the continental coastal segments. The hydrodynamic drives the process over the island central zone. The time scaling down underlines the high variability as well as the resilience of the ecosystem concerned in short terms and the productivity of this Gulf. A decade of sediment deficit or accumulation brings out new ecosystem development or loss.
This temporality matches the natural area management time scale. The projection on a medium term stays a speculation for the wind direction and intensity as well as for rainfall which are the basis of the underlying process for change. The warming and the sea level rise leave no doubts. In the current situation of sediment load deficit, the trend of frequent flooding can only be expected to increase like in the 1970s and without added factors. However, in fifty years, the challenge has changed as well as knowledge on climate change effects even if it can never be considered as sufficient. The expected change in the coastal environment must be considered in terms of ecological equivalent and no more only as a loss.
The Arguin Gulf could represent a rare opportunity of positive balance because of its strong resilience of halophyte and relic plants and its prevailing healthy seagrass bed. The protected area status is not inconsistent with a controlled interventionism, since the area helps in sediment pattern stabilization, maintains a temporary habitat role and contributes to carbon storage. The limited human use of the area for several decades gives the opportunity to observe nature’s process. Over a so large an area of around 1000 Km2 the balance between wild and anthropic restoration is certainly possible to find. Whatever the management options, the unprecedented study focused on these time scales should also seek to encourage a strengthened and detailed monitoring while not forgetting the caution required in respect of a speculative estimation. The monitoring should focus on the sedimentary flow, the climate data availability and key ecosystem regular assessments.
Acknowledgement
This work was supported by the Deutsche Gesellschaft für Internationale Zusammenarbeit, GIZ, in the frame work of the Natural Resources Program and the National Park of the Arguin Bank, PNBA. The authors would like to thank Abdoul Dia from the Mauritanian Institute of Oceanography and Fishery, IMROP, for his wise comments and data sharing.
References
- Dia A (2013) Les plateformes littorales des marges stables désertiques: Etude sédimentologique, stratigraphique et morphologique des unités fini-holocènes (= Néholocène) du Banc d'Arguin (Mauritanie) (Doctoral dissertation, Perpignan).
- Aleman N, Certain R, Barusseau JP, Courp T, Dia A (2014) Post-glacial filling of a semi-enclosed basin:Â the Arguin Basin (Mauritania). Marine Geology 1: 126-135.
- Vernet R (2007) Le Golfe d'Arguin de la préhistoire à l'histoire: littoral et plaines intérieures. Parc national du banc d'Arguin
- Barusseau JP, Vernet R, Saliège JF, Descamps C (2007) Late Holocene sedimentary forcing and human settlements in the Jerf el Oustani-Ras el Sass region (Banc d’Arguin, Mauritania). Géomorphologie: relief, processus, environnement 13: 1.
- Maley J, Vernet R (2013) Peuples et évolution climatique en Afrique nord-tropicale, de la fin du Néolithique à l’aube de l’époque moderne. Afriques. Débats, méthodes et terrains d’histoire 4.
- DeMenocal PB (2014) Marine Sediment Records of African Climate Change:Â Progress and Puzzles. Treatise on Geochemistry (2nd edn):Â Module in Earth Systems and Environmental Sciences pp: 99-108.
- Wolff WJ, Van der Land J, Nienhuis PH, De Wilde PA (1993) The functioning of the ecosystem of the Banc d'Arguin, Mauritania:Â a review. Hydrobiologia 258: 211-222.
- De Boer WF (2007) Seagrass-sediment interactions, positive feedbacks and critical thresholds for occurrence:Â a review. Hydrobiologia 591: 5-24.
- Guénette S, Meissa B, Gascuel D (2014) Assessing the contribution of marine protected areas to the trophic functioning of ecosystems: A model for the Banc d’Arguin and the Mauritanian Shelf. PLoS One 9: 1-16.
- Hemminga MA, Nieuwenhuize J (1990) Seagrass wrack-induced dune formation on a tropical coast (Banc d'Arguin, Mauritania). Estuarine, Coastal and Shelf Science 31: 499-502.
- Hemminga MA, Nieuwenhuize J (1991) Transport, deposition and in situ decay of seagrasses in a tropical mudflat area (Banc d’Arguin, Mauritania). Netherlands J Sea Res 27: 183-190
- Clavier J, Chauvaud L, Carlier A, Amice E, Van der GM, et al. (2011) Aerial and underwater carbon metabolism of a Zostera noltii seagrass bed in the Banc d’Arguin, Mauritania. Aquat Bot 95: 24-30.
- Lamarche S (2008) Cartographie et répartition de la végétation du Cap Timiris. 38.
- Otero V, Quisthoudt K, Koedam N, Dahdouh-Guebas F (2016) Mangroves at their limits:Â Detection and area estimation of mangroves along the Sahara Desert Coast. Remote Sensing 8(6): 512.
- Michel J, Westphal H, Hanebuth TJ (2009) Sediment partitioning and winnowing in a mixed eolian-marine system (Mauritanian shelf). Geo-Marine Letters 29: 221-232.
- Hanebuth TJ, Lantzsch H (2008) A Late Quaternary sedimentary shelf system under hyperarid conditions:Â unravelling climatic, oceanographic and sea-level controls (Golfe d'Arguin, Mauritania, NW Africa). Marine Geology 256: 77-89.
- D'Almeida GA (1986) A model for Saharan dust transport. Journal of climate and applied meteorology 25: 903-916.
- Prospero JM (2002) Environmental characterization of global sources of atmospheric soil dust identified with the NIMBUS 7 Total Ozone Mapping Spectrometer (TOMS) absorbing 996 aerosol product. Rev Geophys [Internet] 40: 1002.
- De Lemps Alain H, Leroux M (1985) Le climat de l'Afrique tropicale. 1983. Cahiers d'outre-mer 38: 94-95
- Leroux M (1991) La spécificité climatique des montagnes sahariennes. Revue de géographie alpine 79: 23-42.
- Schepanski K, Tegen I, Laurent B, Heinold B, Macke A (2007) A new Saharan dust source activation frequency map derived from MSG-SEVIRI IR-channels. Geophys Res Lett 34: 1-5.
- Reyssac J (1977) Hydrologie, phytoplancton et production primaire de la baie du Lévrier et du 1006 Banc d’Arguin. Bull Inst fond Afrique noire 39: 487-554.
- Thomas YF, Senhoury AE (2007) La hauteur significative des vagues en Afrique de l'ouest, observation par altimetrie radar. Photo interpretation 43: 25-32.
- Littaye A, Sidi BM, Sidi CAM (2018) Temporal variability of the climate along the Mauritanian coast over the last decades. Anne. J earth Sci Clim Chang (in press)
- Barros VR, Field CB, Dokken DJ, Mastrandrea MD, Mach KJ, et al. (2014) Climate change 2014. Impacts, Adaptations and vulnerability:Â Part B:Â Regional aspects. Cambridge, UK.
- Revel M, Skonieczny C, Paillou P, Bory A, Bayon G, et al. (2015) African humid periods triggered the reactivation of a large river system in Western Sahara. Nat Commun 6: 6-11
- UNESCO W (1989). Report of the World Heritage Committee, XXIIIeme Session, Paris. SC-89/CONF.004/12, Paris: UNESCO/WHC.
- Xu H (2006) Modification of normalised difference water index ( NDWI ) to enhance open water features in remotely sensed imagery. Int J Remote Sens 27: 3025-3033
- Rokni K, Ahmad A, Selamat A, Hazini S (2014) Water feature extraction and change detection using multitemporal Landsat imagery. Remote Sens 6: 4173-4189
- Helgren DM, Prospero JM (1987) Wind velocities associated with dust deflation events in the western Sahara. Journal of climate and applied meteorology 26: 1147-1151
- Le Cozannet G, Raucoules D, Wöppelmann G, Garcin M, Da Sylva S (2015) Vertical ground motion and historical sea-level records in Dakar (Senegal). Environmental Research Letters p: 10
- Fröhle P, Shaikh S, Salecker D (2016) Changement climatique , érosion côtière et risques d ’ inondations à Nouakchott , Mauritanie Etat des lieux et options d ’ adaptation. Nouakchott, Mauritania.
- Lamarche B (1998) Atlas des espèces végetales. Fascicule 1: généralités et fiches spécifiques (1 à 100). Etudes Sah. D’Arguin PN du B, editor. Nouakchott, Mauritania p: 120.
- Diagana M (2005) Approche spatiale de la biodiversité (flore et végétation) dans une aire protégée saharienne : Le Parc National du Banc d’Arguin (Mauritanie). Développement d’un outil de gestion. Université d’Angers, France.
- Boumediana AI (2015) Flora of Mauritania. El-Wahat pour les Rech les Etudes 8: 73-83.
- Chery JP, Deshayes M, Taqarort M (2010) Cartographie et suivi par télédétection des herbiers marins du Parc national du Banc d’Arguin. Montpellier, France.
- Ardoin-Bardin S (2004) Variabilité hydroclimatique et impacts sur les ressources en eau de grands bassins hydrographiques en zone soudano-sahélienne. Thèse l’Université Montpellier II Sci Tech du Languedoc, Montpellier, France. p: 608.
- Pettit AN (1979) A Non-Parametric Approach to the Change-Point Problem. J R Stat Soc 28(2): 126-135.
- Lee AFS, Heghinian SM (1977) A shift of the mean level in a sequence of independant normal random variables. A Bayesian approach. Technometrics 19: 503-506
- Hubert P, Carbonnel JP (1987) Approche statistique de l’aridification de l’Afrique de l’Ouest. J Hydrol 95: 165-183.
- Winer BJ, Brown D, Michels KM (1991) Statistical Principles in Experimental Design. McGraw-Hil. McGraw-Hill (editor). Université du Michigan p: 1057.
- Ardoin-Bardin S, Lubès-Niel H, Servat E, Dezetter A, Paturel JE, et al. (2003) Analyse de la persistance de la sécheresse en Afrique de l’Ouest: caractérisation de la situation de la décennie 90. In: É. Servat, W. Najem CL et SA, (eds). Hydrology of the Mediterranean and Semiarid Regions (colloque IAHS, Montpellier). IAHS Publication pp: 223-228.
- Lubès-Niel H, Masson JM, Paturel JE, Servat E (1998) Variabilite climatique et statistiques. Étude par simulation de la puissance et de la robustesse de quelques tests utilisés pour vérifier I’homogénéité de chroniques. Rev des Sci L’eau 11: 383-408.
- Fouw JD, Govers LL, Koppel JVD, Leon PM, Gils JAV, et al. (2016) Drought , Mutualism Breakdown , and Landscape-Scale Degradation of Seagrass Beds. Curr Biol [Internet] Elsevier Ltd 26: 1051-1056
- Renou B (2003) La dynamique sol -végétation des zones humides du Sud du Parc National du Banc d’Arguin (Mauritanie) par télédétection satellitaire. Angers, France.
- Barusseau JP, Certain R, Vernet R, Saliège JF (2010) Geomorphology Late Holocene morphodynamics in the littoral zone of the Iwik Peninsula area (Banc d’Arguin — Mauritania). Geomorphology 121: 358-369.
- Giresse P, Barusseau JP, Gasse F, Hoang CT (1989) Pleistocene paleoenvironments of the Mauritanian shoreline from the study of the Cape Tafarit cross-section:Â suggestion to reconsider the Tafaritian classification as a marine stage. Comptes Rendus - Acad des Sci Ser II 309: 1377-1382.
- Senhoury EAO (2000) Influence d’un ouvrage portuaire sur l’équilibre d’un 1076 littoral soumis à un fort transit sédimentaire. Exemple du port de Nouakchott (Mauritanie). Université de Caen, France.
- Gassani J, Bent MA, Duchesne J, Ozer P (2005) Preliminary results of Saharan dust deposition during the rainy season 2005 in Mâle (Southern Mauritania). Geo Eco Trop 29: 69-76.
- Grivaud M (2012) Cartographie des zones submersibles du littoral du Parc National du Banc d Arguin, Mauritanie. Â
- Arfi R (1987) Variabilité interannuelle de l’hydrologie d’une région d’upwelling (bouée Bayadère, Cap Blanc, Mauritanie). Oceanol Acta 10: 151-159.
- Bourguignon D’AJB. Côtes d’Afrique aux environs d’Arguin, du Cap Blanc à la rivière de Saint Jean.
- Bellin JN. Plan de la Baye et isle d’Arguim / levé par un pilote françois.
- Sevrin-Reyssac J (1993) Hydrology and underwater climate of the Banc d’Arguin, Mauritania: a review. Hydrobiologia 258: 1-8.
- Proske U, Hanebuth TJJ, Meggers H, Leroy SAG (1993) Tidal flat sedimentation during the last millennium in the northern area of Tidra Island, Banc d’Arguin, Mauritania. J African Earth Sci 50: 37-48.
- Dedah SO (1993) Wind, surface water temperature, surface salinity and pollution in the area of the Banc d’Arguin, Mauritania. Hydrobiologia 258: 9-19
- Reynaud JY, Dalrymple RW (2011) Shallow-Marine Tidal Deposits. In:Â Davis RAJ, 1096 Dalrymple RW, editors. Principles of Tidal Sedimentology pp: 335-369.
- Fairley I, Masters I, Karunarathna H (2016) Numerical modelling of storm and surge events on offshore sandbanks. Mar Geol 371: 106-119
- Blasco F (2010) About the mangroves of Banc d’Arguin, Mauritania. ISME/GLOMIS Electron J 8: 13-15.
- Quisthoudt K, Schmitz N, Randin CF, Dahdouh-Geubas F, Robert EMR, et al. (2012) Temperature variation among mangrove latitudinal range limits worldwide. Trees 26: 1919-1931
- Krauss KW, Lovelock CE, McKee KL, Lopez-Hoffman L, Ewe SML, et al. (2008) Environmental drivers in mangrove establishment and early development:Â A review. Aquat Bot 89: 105-127.
- Mahé E (1985) Contribution à l’étude scientifique de la région du Banc d’Arguin. Peuplements avifaunistiques. Université des sciences et technique du Languedoc, Montpellier, France.
- Woodroffe CD (1990) The impact of sea-level rise on mangrove shorelines. Prog Phys Geogr 14: 483-520.
- Gilman E, Ellison J, Coleman R (2007) Assessment of mangrove response to projected relative sea-level rise and recent historical reconstruction of shoreline position. Environnemental Monitoring Assess 124: 105-130.
- Ellison J, Stoddart DR (1991) Mangrove Ecosystem Collapse during Predicted Sea-Level Rise:Â Holocene Analogues and Implications. J Coast Res 7: 151-165.
- Nitto DD, Neukermans G, Koedam N, Defever H, Pattyn F, et al. (2014) Mangroves facing climate change :Â landward migration potential in response to projected scenarios of sea level rise. Biogeosciences 11: 857-871
- Diagana M, Baum I (2009) Les mangroves de Mauritanie face aux défis des changements climatiques. In: Secretariat International francophone pour l’évaluation environnementale (Sifee), editor. Changements climatiques et évaluation environnementale : enjeux et outils pour l’évaluation des impacts et l’élaboration de plans d’adaptation. Niamey, Niger.
- Soares MLG, Estrada GCD, Fernandez V, Tognella MMPT (2012) Southern limit of the Western South Atlantic mangroves:Â Assessment of the potential effects of global warming from a biogeographical perspective. Estuar Coast Shelf Sci 101: 44-53
- Quisthoudt K, Adams J, Rajkaran A, Dahdouh- F, Koedam N, et al. (2013) Disentangling the effects of global climate and regional land-use change on the current and future distribution of mangroves in South Africa. Biodivers Conserv 22: 1369-1390
- Elouard P, Rosso JC (1982) Eléments de biogéographie et d’écologie des mollusques quaternaires et actuels du Banc d’Arguin (Mauritanie). Géobios 15: 105-110.
- Lavaud R, Thébault J, Lorrain A, Van der GM, Chauvaud L (2013). Senilia senilis (Linnaeu , 1758) a biogenic archive of environmental conditions on the Banc d’Arguin (Mauritania). J Sea Res 76: 61-72.
- Loeuff PLE (1999) La macrofaune d’invertébrés benthiques des écosystèmes à salinité variable le long des côtes atlantiques de l’Afrique tropicale : variations de la biodiversité en relation avec les conditions climatiques actuelles (précipitations) et l’histoire climatique. Zoosystema 21: 557-571.
- Honkoop PJC, Berghuis EM, Holthuijsen S, Lavaleye MSS, Piersma T (2008) Molluscan assemblages of seagrass-covered and bare intertidal flats on the Banc d’Arguin, Mauritania, in relation to characteristics of sediment and organic matter. J Sea Res 60: 235-243
- Vernet R, Tous P (2004) Les amas coquilliers de Mauritanie occidentale et leur context paléoenvironnemental(VIIe-IIe millénaires BP). Préhistoires Méditerranéennes 13: 55-69.
- Hawkins AJS, Bayne BL, Bougrier B, Héral M, Iglesias JIP, et al. (1998) Some general relationships in comparing the feeding physiology of suspension-feeding bivalve molluscs. J Exp Mar Bio Ecol 219: 87-103.
- Johnson MA, Fernandez C (2001) Bacterial symbiosis in Loripes lucinalis ( Mollusca :Â Bivalvia ) with comments on reproductive strategy. J Mar Biol Assoc UK 81: 251-257.
- Van der HT, Govers L, De Fouw J, Olff A, Van der GM, et al. (2012) A Three-Stage Symbiosis Forms the Foundation of Seagrass Ecosystems. Science 336: 1432-1434
- Bos AR, Bouma TJ, De Kort GLJ, Van Katwijk MM (2007) Ecosystem engineering by annual intertidal seagrass beds:Â Sediment accretion and modification. Estuar Coast Shelf Sci 74: 344-348.
- Cabaço S, Santos R (2007) Effects of burial and erosion on the seagrass Zostera noltii. J Exp Mar Bio Ecol 340: 204-212.
- Fourqurean JW, Duarte CM, Kennedy H, Marbà N, Holmer M, et al. (2012) Seagrass ecosystems as a globally significant carbon stock. Nat Geosci 5: 505-509
- Sherbinin AD (2013) Climate change hotspots mapping : what have we learned ? In: Gemenne F, Adger N, Barnett J, Dabelko G, editors. “Climate and Security: Evidence, Emerging Risks, and a New Agenda.†Springer S. Dordrecht, Netherlands. p: 15.
- Evan AT, Flamant C, Gaetani M, Guichard F (2016) The past, present and future of African dust. Nature  531: 493-495
- Westrich JR, Ebling AM, Landing WM, Joyner JL, Kemp KM, et al. (2016) Saharan dust nutrients promote Vibrio bloom formation in marine surface waters. Proc Natl Acad Sci [Internet] 113: 5964-5969
- World Bank (2016) Global assessment report on disaster risk reduction. Risk data platform.
- Quétier F, Quenouille B, Schwoertzig E, Gaucherand S, Lavorel S, et al. (2012) Les enjeux de l’équivalence écologique pour la conception et le dimensionnement de mesures compensatoires d’impacts sur la biodiversité et les milieux naturels. La Rev l’Irstea; Hors serie: 1-7.
- Diallo M, Lo PG (2010) The regional shoreline monitoring study and drawing up of a management scheme for the West Africa. Ouagadougou Burkina Faso:Â UEMOA p: 56.
- Diop M, Dossa J (2011) Trente années d’exploitation des Requins en Afrique de l’ouest. Dakar, Sénégal.
Citation: Littaye A, Quld Ahmed SC (2018) The Dynamics of the Coastal Land Scapes Over the Last Decades: Wind Drivers for Change Along the North Western Mauritanian Coast. J Earth Sci Clim Change 9: 450. DOI: 10.4172/2157-7617.1000450
Copyright: © 2018 Littaye A, et al. This is an open-access article distributed under the terms of the Creative Commons Attribution License, which permits unrestricted use, distribution, and reproduction in any medium, provided the original author and source are credited.
Select your language of interest to view the total content in your interested language
Share This Article
Recommended Journals
Open Access Journals
Article Tools
Article Usage
- Total views: 6860
- [From(publication date): 0-2018 - Dec 03, 2025]
- Breakdown by view type
- HTML page views: 5837
- PDF downloads: 1023

