The Influence of Al2O3- ZnO-H2O Nanofluid on the Thermodynamic Performance of Photovoltaic- Thermal Hybrid Solar Collector System
Received: 09-Feb-2018 / Accepted Date: 19-Feb-2018 / Published Date: 23-Feb-2018 DOI: 10.4172/2576-1463.1000187
Abstract
A thermodynamic analysis was conducted after testing two working fluids to particularly assess the effect of Nanofluid as heat transfer agent on improving thermal, electrical, and exergetic efficiencies of thermally biased solar photovoltaic/thermal (PV/T) hybrid collector system under State of Qatar climate, using experimentally and computationally obtained data. The investigated two fluids were water, and Al2O3-ZnO-H2O Nanofluid mixed with Ethylene Glycol as surfactant. Mass fractions of Nanoparticles were 0.05 wt.% Al2O3 with particle size of 5 nm and 0.05 wt.% ZnO with particles size of 10-30 nm. The results showed that in comparison between water as absorption medium and the mentioned Nanofluid, an increase in thermal and hence total efficiency of the system was recorded for the latter absorption medium scenario, despite considering concentrations of the Nanoparticles relatively low. A very general trend of dramatic decrease in the positive effect of Nanofluid in consistency with the ambient temperature increase was also observed after fitting the data to segments of straight lines. For 0.05 wt.% mass fraction of Nanoparticles the averaged increment in total efficiency was 4.1%, and in total useable energy (exergy) efficiency was 4.6%.
Keywords: Solar hybrid collector system; Nano fluidic; Photovoltaic
General Introduction
Hybrid photovoltaic/thermal (PV/T) technology, through photovoltaic and photo thermal interaction, generates electricity and thermal power simultaneously from absorbed solar energy. Besides the higher overall energy performance, the merit of a PV/T system lies in the reduction of the demands on physical space and the equipment cost through the use of common frames and brackets as compared to the separated PV and solar thermal systems placed side-by-side. Its façade integration provides architectural uniformity and facilitates building thermal load reduction [1].
The assessment of solar photovoltaic/thermal (PV/T) hybrid collector system performance is commonly tackled from viewpoint of thermodynamics, as [1] conducted a study of appropriateness of glass cover on a thermo syphon heating PV/T system from the first law point of view and from the exergy analysis point of view. Ozgoren M, et al. [2] concluded that the conversion efficiency of the photovoltaic (PV) system with water cooling might be improved by an average of 10%, while Debbarma et al. [3] studied the thermal, electrical and exergetic characteristics of PV/T hybrid air collector system.
Nanofluids are skillfully prepared colloidal suspensions of nanoparticles (which is of size 1–100 nm) dispersed in a base fluid [4]. Many authors investigated the effect of Nanofluids on the performance of solar collectors, such as Yousefi et al. [5] who experimentally studied the effect of Al2O3-water nanofluid on the efficiency of a flat-plate solar collector. Nagarajan et al. [6] prepared Nanofluids containing Al2O3, ZnO, and MgO nanoparticles. The amount of forced convective heat transferred through the as-prepared nanofluids in tubular solar collector showed ZnO-water nanofluid with 0.2% concentration by volume as the optimal option for the collector. Other authors like Li et al. [7] reviewed the fields of application for solar collectors using nanofluids as the working fluid. The effect of Nano fluids on PV/T hybrid collector performance was studied by Cui and Zhu [8] who applied the Nanosolution on top of the PV module. Although the electrical efficiency of the PV/T system was lower than the bare PV module, the overall energy conversion efficiency of the PV/T system was higher.
The use of finite element simulation is of interest in this study, so to simulate the temperature distribution on top of the solar collector or on the PV panel surface and then evaluate its performance. Yang et al. [9] followed the same path of investigation by measuring and simulating the temperature distribution, and the resulting data of experiments and simulation were very consistent. Analysis of a conceptual photovoltaic thermal (PV/T) solar panel design was performed by Fontenault and Gutierrez-Miravete [10] using COMSOL Multiphysics software and combinations of water flow rates and reservoir thicknesses were analyzed to determine which one produced optimal PV/T total efficiency. The work of Elmir et al. [11] included studying by numerical simulation the cooling of a solar cell by forced convection in presence of a nano fluid, and concluded to an increase in the rate of heat transferred in comparison with absence of nanoparticles.
In the present work, the effect of Nanofluid in the performance of thermally biased solar PV/T hybrid collector system is analyzed in terms of the relevant efficiencies and in comparison, with the normal water as working fluid, taking advantage of the collected experimental data from an available set of PV/T collectors at GORD’s Techno Hub research facility in Qatar and with the aid of finite element modeling COMSOL Multi physics software. It was of interest in this work to investigate a Nanofluid composed of two different nanoparticles with low mass fraction for each one dispersed by manual stirring in a mixture of distilled water and Ethylene Glycol serves as surfactant.
Materials and Set up
Experimental investigations were conducted on two working fluids: water and Al2O3-ZnO- distilled water (H2O) Nanofluid mixed with Ethylene Glycol. The Nanofluid composition is 0.05 wt.% ZnO 99+% purify nearly spherical Nanoparticles (particle size 10-30 nm), 0.05 wt.% Al2O3 99.99% purify nearly spherical Nanoparticles (particle size 5 nm) [12], ethylene glycol as natural surfactant for dispersion of Nano-powders, and a distilled water as the base fluid. Gentle stirring was applied to reassure dispersion of Nanoparticles in the base fluid. Figure 1 shows the prepared mixture.

Figure 1: Al2O3-ZnO distilled water with Ethylene Glycol Nanofluid.
The following Table 1 [13] summarizes thermo-physical properties and quantities of Nanofluid structural components.
| Substance | Density (kg/m3) | Specific heat (J/kg.K) | Thermal conductivity (W/m.K) | Dynamic viscosity (Pa.s) | Quantity (g or litrer) |
|---|---|---|---|---|---|
| Aluminum oxide nanopowder Al2O3 (“Aluminum Oxide Nanopowder / Nanoparticles (Al2O3, gamma, 99.99%, 5nm, Hydrophilic),” n.d.) | 3890 | 880 | 36.96 at 27°C (“Weblet Importer,” n.d.) | --- | 25g |
| Zinc oxide nanopowder ZnO (“Zinc Oxide Nanoparticles / Nanopowder (ZnO, 99+%, 10-30 nm),” n.d.) | 5610 | 504.7 | 54 at 27°C (Madelung et al., 1999) | --- | 25g |
| Water | 998 | 4186 | 0.58 | 0.7255×10⁻³ | 50 liters |
| Ethylene Glycol(Sigmund, 2009) | 1117 | 2470 | 0.25145 at 27°C | 0.0214 | 5 liters |
Table 1: Summary of thermo-physical properties and quantities of Nanofluid components.
Experiments were conducted on a ready setup consists of: an outdoor set of five solar PV/T hybrid collectors tilted 25°S and connected in series within a closed hydronic circuit in where the volumetric flow rate is maintained constant at 3.25 L/min, indoor 500 Liter storage tank with integrated heat exchangers in where the collectors’ hydronic circuit is connected, variable speed circulating pump, electromagnetic flow meter, and a simple ball valve to control the flow. The ball valve is connected to the inlet (downstream) of the collectors’ set. Two K-type Thermocouples and their data loggers were attached to the inlet and outlet pipes of the collectors’ set to record the relevant temperatures. The local weather data of ambient temperature and wind speed was provided by Vantage Pro 2 weather station model manufactured by Davis® weather monitoring. The solar irradiation at the plane of the PV/T collectors was measured using an ISO 9060 first class complaint Kipp & Zonen CMP 6 pyranometer. The following Figure 2 shows a schematic diagram of the full setup and Figure 3 shows the Photographic view of solar PV/T hybrid collector system.

Figure 2: Schematic drawing of the experimental setup.

Figure 3: Photographic view of solar PV/T hybrid collector system set connected in series within a closed hydronic circuit at the Techno Hub facility, Gulf organization for research and development, Qatar (latitude 25.3548° N).
The following Table 2 presents specifications of VOLTHER® POWERTHERM hybrid PV/T collector as provided by the manufacturer.
| Glazing | Low iron tempered glass, |
| Cell type | Monocrystalline silicon |
| PV module efficiency | 12 |
| Module area | 1.28 m2 |
| PV cell efficiency | 15.24 |
| Number of Cells | 12 × 6(72) |
| Cell Dimensions LW | 125 × 125 mm |
| Cell thickness | 200 μm |
| Nominal operating cell temperature (NOCT) | 37°C |
| Copper sheet thickness | 0.12 mm |
| Absorber material | Copper |
| Absorber tube external diameter | 8 mm |
| Absorber tube thickness | 0.45 mm |
| Thermal insulation | 50 mm (glasswool), 40 mm (EPS) |
Table 2: Specifications of the hybrid PV/T collector.
Test Procedure and Condition
The closed hydronic circuit of the solar PV/T hybrid collector was firstly injected with the Nanofluid, and a static pressure of 0.4 bar and flow rate of 3.25 L/min was maintained. Figure 4 shows a photographic view of Nanofluid insertion process. The experimental tests took place in March 2017, solar irradiation, wind speed, inlet, outlet, and ambient temperatures were all recorded on hourly basis starting from 9:00 AM till 15:00 PM. The experiments have been repeatedly conducted so to obtain nearly matching or fixed surrounding atmospheric conditions and hence the comparison analysis becomes as realistic and accurate as possible. Selected two days data representing each different heat carrier fluid scenario were used for the analysis. The following Figure 5 compares solar irradiation, wind speed, and ambient temperatures for the two days of interest climatic conditions.

Figure 4: Insertion of Nanofluid in the PV/T closed hydronic circuit.

Figure 5: Measured weather data during experimental test.
Methods
Thermo-physical properties of nano-fluid
The following available in the literature set of equations were utilized to quantify the thermo-physical properties of the resulting Nano-solution. Pak and Cho [14] mentioned in their work the wellknown equation of density which will represent the nano fluid as:
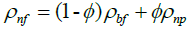 (1)
(1)
Where ρnf is density of nanofluid, ϕ is mass fraction of Nanoparticles, ρbf and ρnp are densities of base fluid and Nanoparticles respectively. Density of the base fluid ρbf represents the mixture of distilled water and Ethylene Glycol and is computed using the same Eqn (1).
For the heat capacity of the Nanofluid, Chow et al. [1] has quoted the following equation:
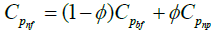 (2)
(2)
Where Cpnf is heat capacity of the Nanofluid, Cpbf and Cpbf are heat capacities of base fluid and Nanoparticles respectively. Heat capacity of the base fluid Cpbf represents the mixture of distilled water and Ethylene Glycol and is computed using the same Eqn (2).
Thermal conductivity of the Nanofluid knf is calculated from the empirical correlation derived by Corcione [15]
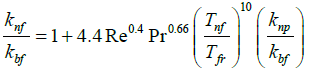 (3)
(3)
Where thermal conductivity of the base fluid kbf represents the mixture of distilled water and Ethylene Glycol and is computed by Jamieson et al. [16]:
 (4)
(4)
Where kw and kEth are thermal conductivities of water and Ethylene Glycol, ϕw and ϕEth. are mass fractions of water and Ethylene Glycol respectively.
Re is the Nanoparticles Reynold’s number and is defined by Corcione [15] as
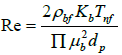 (5)
(5)
Where Kb= 1.38066 × 10⁻²³JK-1 is Boltzman constant, Tnf is the Nanofluid temperature, dp is the Nanoparticle diameter, and dynamic viscosity of the base fluid µbf represents the mixture of distilled water and Ethylene Glycol and is computed by Papaioannou et al. [17]:
 (6)
(6)
Where xi and µi are the component respective mole fraction and dynamic viscosity.
Pr is the base fluid Prandtl number  , Tfr is freezing point of the base fluid which is -3.2°C for the 10 wt.% of Ethylene Glycol aqueous solution [18], and knp , xnp are the thermal conductivity and volume fraction of the Nanoparticles respectively.
Eqn (3) strictly represents a Nanofluid that contains solely one Nanoparticle substance in its mixture, hence the effective thermal conductivity of the Nanofluid will be the averaged thermal conductivities calculated for each Nanoparticles substance.
Dynamic viscosity of the Nanofluid µnf is calculated from the empirical correlation derived by Corcione [15]:
 (7)
(7)
dbf is the equivalent diameter of the base fluid molecule given by Corcione [15]
 (8)
(8)
Where M is the molecular weight of the base fluid, N= 6.022 × 10⁻²³ mol-1 is Avogadro number, and ρbfo is the density of the base fluid calculated at To=293K.
Eqn (7) strictly represents a Nanofluid that contains solely one Nanoparticle substance in its mixture, hence the effective dynamic viscosity of the Nanofluid will be the averaged dynamic viscosities calculated for each Nanoparticles substance.
Computational model
Finite Element Modeling (FEM) and simulation was introduced in this work to help computing magnitudes of PV module surface temperature, structural part in the hybrid PV/T collector system, in accordance with day hours so to eventually evaluate thermodynamic and electrical efficiencies. Figure 6 illustrates a section drawing of Power Therm PV/T collector various components that are of interest in the computational analysis.

Figure 6: Power Therm Hybrid PV/T collector section drawing shows different layers used in the computational analysis.
The conjugate heat transfer, laminar flow interface built in COMSOL Multiphysics® FEM software allows analysis of the phenomenon of forced convection between a heat carrier fluid and the high-temperature PV cells as a heat source. The governing heat transfer equation for every previous and subsequent layer of the PV cells needs to be considered so to conclude to a model when entered and solved computationally by the software will accurately predict the PV cells temperature. Figure 7 shows the geometry considered for deriving the computational model and the major corresponding heat transfer modes in different directions.

Figure 7: Geometry of heat transfer analysis.
The general heat energy balance equation would be:
 (9)
(9)
QCOND = QT (10)
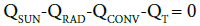
Heat transferred downwards in direction of thermal insulation layer Q = 0. The inward steady state heat transferred from the Sun is:
QSUN = GAc (11)
Where G is the solar irradiation and Ac is the PV/T collector surface area. The glazing radiated heat out of the system is formulated by [1] as:
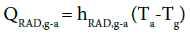 (12)
(12)
Where QRAD,g-a is the heat transferred by radiation from the glazing surface to the surroundings, hRAD,g-a= 4sTa3 (Ingersoll, 1986) is the radiative coefficient from the glazing, where s = 5.775×10⁻⁸W/m2K4 is the Stefan-Boltzman constant, Ta is the ambient temperature, and Tg is the glazing temperature.
The glazing will also radiate heat inside the system and towards the PV cells again according to the formula [1]:
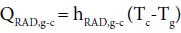 (13)
(13)
Where QRAD,g-c is the heat transferred by radiation from the glazing surface to the PV cell surface, and Tg is the PV cells surface temperature.
PV cells surface will by its turn radiate heat in the upwards direction, represented by the equation (Oruc et al., 2016):
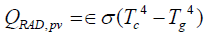 (14)
(14)
Where QRAD,pv is the upward heat transferred by radiation from the PV cells, and ϵ=0.85 is the average surface emissivity of silicon.
Summation of QRAD,g-a, QRAD,g-c, and QRAD,pv will give the total heat transfer by radiation of the system QRAD.
Heat transferred due to convection out of the system is [1]:
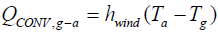 (15)
(15)
Where QCONV,g-a is the heat transferred by convection from the glazing surface to the surroundings, 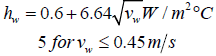 [19] where vw is the wind speed.
Heat transferred due to convection towards the PV cells surface [1]
 (16)
(16)
Where QCONV,g-c is the heat transferred by convection from the glazing surface to the PV cells surface.
Summation of QCONV,g-a, and QCONV,g-c will give the total convection heat of the system QCONV.
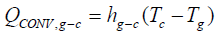
The general equation for steady state heat transfer within heat carrier fluid layer is stated by Yousefi et al.:
 (17)
(17)
Where m is the mass flow rate of the working fluid, Cp is the heat capacity of the working fluid, To and To are the inlet and outlet temperatures, respectively.
The forced convection is described using the continuity and momentum equations for laminar and incompressible fluid flow as follows [20]:
 (18)
(18)
The initial temperature of the PV cells was assumed to be derived from the equation [21]:
 (19)
(19)
So, to reduce number of iteration carried out by the software and to increase the accuracy of the resulting temperature.
Thermo-physical properties of each layer material and used in the COMSOL software are listed in Table 3.
| Layer | Material | Density (kg/m3) | Specific heat (J/kg.K) | Thermal conductivity (W/m.K) | Dynamic viscosity (Pa.s) |
|---|---|---|---|---|---|
| Glazing | Low iron tempered glass(ABRISA Technologies, 2014) | 2530 | 879.2 | 0.937 | --- |
| PV cells | Monocrystalline silicon(Yang et al., 2012) | 2330 | 700 | 130 | --- |
| Copper sheet and absorber pipe | Copper (Yang et al., 2012) | 8940 | 390 | 401 | --- |
| Nanofluid (at 35°C) | ZnO+Al2O3+water+Ethylene Glycol | 1013 | 4005.7 | 1.8312 | 8.1021× 10⁻⁴ |
| Water (at 35°C) | ------ | 993.95 | 4186 | 0.58 | 0.7255 × 10⁻³ |
| Thermal insulation | GLASSWOOL +EPS | --- | --- | --- | --- |
Table 3: Properties of solar PV/T hybrid collector layers used in COMSOL simulation.
Thermodynamic analysis
The conventional first law of thermodynamics thermal efficiency ητ as mentioned by Yousefi et al. [5] is:
 (20)
(20)
Where G is the solar irradiance and Ac is the collector’s surface area.
The electrical efficiency of the PV module mounted at the upper part of the PV/T hybrid collector can be represented by the simplified equation [22]:
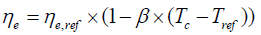 (21)
(21)
Where ηe,ref is the PV module electrical efficiency at standard testing condition (STC), ß temperature coefficient for cell efficiency and equals 0.0045°C-1 [23], and Tref is reference temperature at STC which is 25°C.
The total or overall efficiency of the PV/T hybrid collector ηPV/T then is the automatic linear combination of the thermal and electrical efficiencies of the collector system according to Fujisawa and Tani [24]:
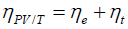 (22)
(22)
The exergy term represents the convertible amount of low grade energy into useful one, and hence the exergetic efficiency (second law of thermodynamics efficiency) equation for the predefined quasi-static process would be [1]:
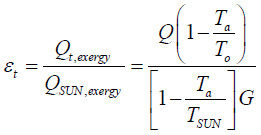 (23)
(23)
Where Ta is the ambient temperature, To is outlet temperature of the fluid medium, and TSUN is the solar radiation temperature at 6000K.
For the electrical exergetic efficiency εe of the PV part in the PV/T hybrid collector system the following equation is inclusive [1]:
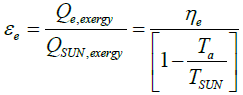 (24)
(24)
And the total exergetic efficiency is:
 (25)
(25)
Results
The following Figure 8 demonstrates magnitudes of PV cells temperature for each of the two heat transfer fluids obtained from the computational analysis.

Figure 8: Variation in PV cell temperature between heat carrier fluids during daytime.
Improvements in the cooling of PV cells due to use of Nanofluid is barely exists according to Figure 8 by an averaged reduction in temperature of 0.65°C. Figure 9 presents the electrical, thermal, and total efficiencies of the PV/T hybrid system for the heat transfer fluids used in this study.

Figure 9: Efficiencies comparison for the two heat carrier fluids.
Figure 10 presents the electrical, thermal, and total exergetic efficiencies of the PV/T hybrid system for each of the two heat transfer fluids used in this study.

Figure 10: Exergetic efficiencies comparison for the two heat carrier fluids.
Figures 9 and 10 illustrates the variation in different efficiencies between the two heat transfer fluids. The effect of Nanofluid in the electrical efficiency is trivial when compared with the effect in the thermal efficiency, which complies with the general benefit of Nanofluid utilization which is the increase of thermal capability of the system at the first place. The following Table 4 summarizes the averaged increment in the relevant efficiencies.
| Efficiency | Averaged increasment |
|---|---|
| Thermal | 4.053604873 |
| Electrical | 0.038064214 |
| Total | 4.091669087 |
| Thermal exergetic | 4.588498137 |
| Electrical exergitic | 0.04388059 |
| Total exergetic | 4.632378727 |
| Efficiency | Averaged increment (%) |
| Thermal | 4.054 |
| Electrical | 0.038 |
| Total | 4.092 |
| Thermal exergetic | 4.588 |
| Electrical exergitic | 0.044 |
| Total exergetic | 4.632 |
Table 4: Averaged increment while using the Nanofluid.
Curve fitting was applied to experimental and computational data so to define the behavior of Nanofluid in compliance with the ambient temperature. Figure 11 plots the difference in PV cells temperature between the two working fluids against the averaged ambient temperature for each test during daytime, and shows the fitted curves.

Figure 11: Trend of PV cells temperature against the ambient temperature.
The observed trend from Figure 11 after splitting the plot into two regions and fitting the data to descending lines, the general statement is a decrease in the Nanofluid effect of reducing the PV cells temperature. The following two possibilities are suggested to explain the illustrated behavior:
1. Either the function of temperature difference against ambient temperature is a discontinuous function as shown in Figure 11, therefore the effect of the Nanofluid is fluctuating with ambient temperature according to that function.
2. Or it is a linear descending function, with some outlier points which caused that noise in the graph.
Conclusions
PV module surface temperature distribution was obtained as an average surface temperature by means of finite element modeling software COMSOL Multi physics for each working fluid scenario. The average increase in the electrical efficiency was less than 0.1% which is rational as it complies with the low concentrations of the Nanoparticles but at the same time could be considered neglectable. The traceable effect of Nanoparticles appeared in the average increase of the thermal efficiency around 4.1%. The increase in total exergy efficiency was also detectable by 4.6%, which presents a typical increase in the use of low grade energy.
Abstractly, it is concluded that the effect of Nanofluid in hot climate has been reduced while the ambient temperature increases.
References
- Chow TT, Pei G, Fong KF, Lin Z, Chan ALS, et al. (2009) Energy and exergy analysis of photovoltaic-thermal collector with and without glass cover. Appl Energy 86: 310-316.
- Ozgoren M, Aksoy MH, Bakir C, Dogan S (2013) Experimental Performance Investigation of Photovoltaic/Thermal (PV–T) System. EPJ Web Conf 45: 1106.
- Debbarma M, Rawat P, Mehrotra S, Lata S, Sudhakar K (2014) Energy and Exergy Analysis of Solar Photovoltaic/Thermal Hybrid Air Collector System.
- Thaker R, Patel J (2016) Application of Nano fluids in Solar Energy. J Altern Energy Sources Technol 6: 0-11.
- Yousefi T, Veysi F, Shojaeizadeh E, Zinadini S (2012) An experimental investigation on the effect of Al2O3-H2O nanofluid on the efficiency of flat-plate solar collectors. Renew Energy 39: 293-298.
- Nagarajan PK, Subramani J, Suyambazhahan S, Sathyamurthy R (2014) Nano fluids for solar collector applications: A review. Energy Procedia 61: 2416-2434.
- Li Y, Qing Xie H, Yu W, Li J (2011) Investigation on Heat Transfer Performances of Nano fluids in Solar Collector, Materials Science Forum.
- Cui Y, Zhu Q (2012) Study of Photovoltaic/Thermal Systems with MgO-Water Nanofluids Flowing over Silicon Solar Cells.
- Yang DJ, Yuan ZF, Lee PH, Yin HM (2012) Simulation and experimental validation of heat transfer in a novel hybrid solar panel. Int J Heat Mass Transf 55: 1076-1082.
- Fontenault B, Gutierrez-Miravete E (2012) Modeling a Combined Photovoltaic-Thermal Solar Panel. COMSOL Conf Boston, USA.
- Elmir M, Mehdaoui R, Mojtabi A (2012) Numerical simulation of cooling a solar cell by forced convection in the presence of a nanofluid. Energy Procedia 18: 594-603.
- Madelung O, Rossler U, Schulz M (1999) Zinc oxide (ZnO) thermal conductivity BT- II-VI and I-VII Compounds; Semi magnetic Compounds.
- Pak BC, Cho YI (1998) Hydrodynamic and heat transfer study of dispersed fluids with submicron metallic oxide particles. Exp Heat Transf 11: 151-170.
- Corcione M (2011) Empirical correlating equations for predicting the effective thermal conductivity and dynamic viscosity of nanofluids. Energy Convers Manag 52: 789-793.
- Jamieson DT, Irving JB (1974) Thermal Conductivity of Binary Liquid Mixtures, NEL report. National Engineering Laboratory, Department of Trade and Industry.
- Papaioannou D, Panaylotou C, Evangelou T (1991) Dynamic Viscosity of Multicomponent Liquid Mixtures. J Chem Eng Data 36: 43-46.
- Ingersoll JG (1986) Simplified Calculation of Solar Cell Temperatures in Terrestrial Photovoltaic Arrays. J Sol Energy Eng 108: 95-101.
- Oruc ME, Desai AV, Kenis PJA, Nuzzo RG (2016) Comprehensive energy analysis of a photovoltaic thermal water electrolyzer. Appl Energy 164: 294-302.
- Mattei M, Notton G, Cristofari C, Muselli M, Poggi P (2006) Calculation of the polycrystalline PV module temperature using a simple method of energy balance. Renew Energy 31: 553-567.
- Du Y, Tao W, Liu Y, Jiang J, Huang H (2017) Heat transfer modeling and temperature experiments of crystalline silicon photovoltaic modules. Sol Energy 146: 257-263.
- Evans DL (1981) Simplified method for predicting photovoltaic array output. Sol Energy 27: 555-560.
- Fujisawa T, Tani T (1997) Annual exergy evaluation on photovoltaic-thermal hybrid collector. Sol Energy Mater Sol Cells 47: 135-148.
Citation: Younis A, Onsa M, Alhorr Y, Elsarrag E (2018) The Influence of Al2O3-ZnO-H2O Nanofluid on the Thermodynamic Performance of Photovoltaic- Thermal Hybrid Solar Collector System. Innov Ener Res 7: 187. DOI: 10.4172/2576-1463.1000187
Copyright: © 2018 Younis A, et al. This is an open-access article distributed under the terms of the Creative Commons Attribution License, which permits unrestricted use, distribution, and reproduction in any medium, provided the original author and source are credited.
Select your language of interest to view the total content in your interested language
Share This Article
Recommended Journals
Open Access Journals
Article Tools
Article Usage
- Total views: 6362
- [From(publication date): 0-2018 - Dec 23, 2025]
- Breakdown by view type
- HTML page views: 5247
- PDF downloads: 1115