The Most Dangerous Subsidence Detecting of Mosul Dam by Multi-Pass Differential SAR Interferometry using Sentinel 1A Satellite Images from 2014 to 2016
Received: 22-Sep-2017 / Accepted Date: 14-Nov-2017 / Published Date: 18-Nov-2017 DOI: 10.4172/2157-7617.1000422
Abstract
This paper presents the first comprehensive high deformation map for the Mosul dam which is located on the Tigris river in the western governorate of Ninawa, North West of Iraq from 2014 to 2016. This map generated from space-based multi-pass differential SAR interferometry (DInSAR) measurements which reveal that parts of the dam are undergoing rapid subsidence. (DInSAR) technic has been applied to review the vertical surface movement (movement of the dam body to downward), because an interferogram provides information about height variations present on the imaged surface Furthermore, the information obtained from phase difference in an interferogram can be adjusted to compensate for topography, resulting in information that can be related to very small relative movements of the dam body (centimeter or millimeter scale). Three datasets of SAR images, provided by sentinel 1A Mission, are acquired from October 16, 2014, November 28, 2015 and February 08, 2016. DInSAR data show a subsidence rate largely located within of the Dam body, with a subsidence rate from about 7–14 mm/yr within the period 2014–2015. Also, DInSAR data show a subsidence rate largely located within the Dam body for the period between 2015 and 2016 and a subsidence rate from about 9–20 mm/yr. This result encourages us that DInSAR which is successor of sentinel 1A/SAR that allows measuring surface and dam’s deformations up to millimetre accuracies and must be more useful tool for detecting and monitoring dam subsidence on long time scales when used in conjunction with geotechnical measurements and other geologic information.
Keywords: Sentinel 1A; DInSAR; Interferometry; Subsidence; Geotechnical
Introduction
It is well known that building a largest dam which holds about 11.1 cubic kilometres (2.7 cu mi) of water on soft gypsum rock, which is constantly eroding leads to catastrophic' collapse of the dam and an enormous wall of water that might sweep downstream anything in its path, together with bodies, buildings, cars, unexploded ordnances and dangerous chemicals with probably killing many thousands of people. Differential InSAR, DInSAR, provides important way to detect ground surface movements. The advantage of DInSAR over different ways is that the continuous coverage of the measurements area. Within the previous few years' differential interferometry of radar images has become one of the foremost accurate remote sensing techniques in assessing throughout natural or anthropically induced landslide activity associated with natural hazard or natural resources studies [1,2]. Strozzi used differential InSAR to measure the elevation distinction of Mexico [3]. Fernandez used differential InSAR to detect vertical ground deformations within the guadalfeo stream valley and metropolitan area (Granada, south of Spain) [4].
During recent years, many landslides affecting the water dam surroundings had been reported within the area. There is the main problem: it's engineered on soft mineral rock that is continually eroding. The dam has suffered issues since its 1st constructed. according to the middle east seismological forum special coverage of the Mosul dam issue get into 2007 reported by Hamed Saeedy the continued method of grouting seems has ne'er solved the matter that means that it's ineffective and should push matters to additional deterioration of the foundation layers of rocks beneath the lake similarly because the dam itself [5] (Figure 1).
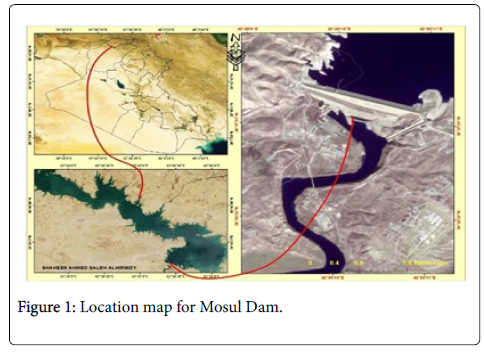
Figure 1: Location map for Mosul Dam.
Technical Review and the Geologic Setting of Mosul Dam
Engineering geology point
From engineering geology point, the area which dam located wasn't to be an acceptable site, as a result of the dam was constructed on a foundation of soluble gypsum, anhydrite, marl, and limestone, each of that is soluble in water and extending to a great depth (Figure 2). The unfavorable results of this action are obviously noted throughout the town of Mosul shortly, when the construction of the lake and also the dam completed. Water began to run through and washout those mineral vanes. Engineers suggested thorough grouting at intervals the foundation before the construction was engineered (Figure 2). Thousands of tons of material are injected into the dam since leaks began forming shortly when the reservoir was filled in 1986, and twenty-four machines unendingly pumped grout into the dam base. Between 1992 and 1998 four swallow holes shaped downstream of the dam and a fifth sinkhole developed east of the dam in Febraury 2003 that was stuffed many times. In August 2005 another swallow hole developed to the east [6]. A Sep 2006 report by the U. S. Army Corps of Engineers noted, "In terms of internal erosion potential of the foundation, Mosul Dam is that the most dangerous dam within the world." The report more outlined a worst-case scenario, during which a fast collapse of the dam would flood Mosul beneath sixty-five feet (20 m) of water and Baghdad, a town of seven million, to fifteen feet (4.6 m), with a calculable death toll of 500,000. A report on thirty Oct 2007 by the United States Special inspector general for Iraq Reconstruction (SIGIR) aforementioned that the dam's foundations may collapse at any moment.
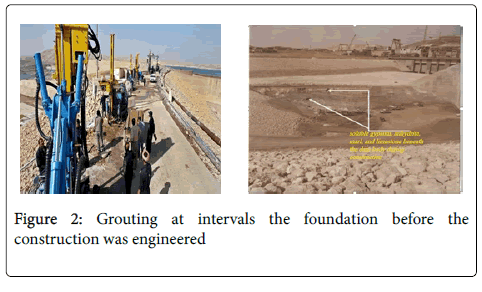
Figure 2: Grouting at intervals the foundation before the construction was engineered.
Geological point
The sedimentary rock units within the area are shaped by processes of evaporation, precipitation and alteration and when deposition, the rock units were subjected to regional crustal movement that horizontal layers which folded into many anticlines and exposed steeply dipping, weathered beds as seen in recent images taken at the dam site. Northern Iraq lies inside the unstable shelf of the Arabian plate and is split into 3 tectonic zones [7]. The High folded Zone on the eastern border of Iraq includes the Zagros vary (4300-m elevation). To the west and parallel to it zone is that the foothill Zone, a 200-km-wide northwest-to-southeast-trending belt consisting of low anticlinal ridges. These foothills area unit separated by broad, shallow synclines full of recent (Quaternary Period) clastic sediments. The Mesopotamian Basin Zone lies to the south and west and contains the alluvial deposits of the Tigris River and also the Euphrates River floodplains [8].
Compressional forces throughout the Pliocene epoch (5.3 to 1.8 Ma) created these tectonic zones. With the closing of the Neo-Tethys Ocean, sedimentation modified from marine to marginal-marine and, finally, to clastic throughout the Miocene epoch (23.8 to 5.3 Ma). As a result, several of the exposures within the hill Zone area unit of late Miocene age (11.2 to 5.3 Ma) or younger and are described by the Jeribe limestone Formation (locally stated as Euphrates-Jeribe limestone Formation; Late Miocene) and also the upper and Lower Fars Formations (Middle Miocene) [9].
The active-fault-bounded Mosul Block has influenced deposit within the area close to Mosul Dam since the first Cretaceous period (144 to 5 Ma) [10]. The Mosul Block (also referred to as the Mosul Uplift) created a ridge and divided the substance basin throughout the Miocene into two parts—the western Sinjar Basin, extending into Syria, and also the eastern basin, extending to the southeast towards Iran [10]. The Lower Fars Formation is that the predominant sedimentary unit within the Mosul Dam area. A lagoon-and-sabkha environment existed within the Miocene (23.8 to 5.3 Ma) wherever evaporites, marls, carbonates, and clay stones of the Lower Fars Formation were deposited. The Lower Fars Formation {is close toly|is almost|is sort of} 250 m thick near Mosul (directly over the Mosul Uplift area) and is 600 m thick in Sinjar (in the basin), to the west [11]. The name Fatha formation was introduced by Jassim et al. [9] to interchange the designation Lower Fars formation. The Fatha formation is up to 350 m thick at the dam and is delineated within the area by Jassim et al. [10]. Original deposition of the Fatha formation followed the standard cyclic pattern of sabkhas and resulted in alternating layers of marl, gypsum, and carbonate. The formation has an upper and lower member. The lower member is dominated by carbonate in its lower part (locally known as “chalky series”) and gypsum in its upper part, and is capped by a rock marker bed. It’s a thickness of 352 m close to Mosul Dam. The upper member, a green and red claystone with gypsum, is found within the synclines of the foothill Zone and in thin outcrop belts round the Butmah (locally known as Dar Maleh) anticline that comprises the west (right) abutment of the dam and adjacent components of the reservoir floor. Gypsum breccia layers exist within the Fatha Formation and have proved to be the foremost problematic rocks within the foundation. Breccia is proof of a underground dissolution zone at intervals a layer of gypsum. Pieces of partly dissolved rock might collect on the ground of a void area as a layer of debris within) [12,13].
DInSAR for dam body subsidence detecting
The Differential Synthetic Aperture Radar Interferometry (DInSAR), has proven to be the effective approaches to detect and monitor ground surface subsidence Compared to conventional terrestrial methods of measurement (GNSS, levelling) its advantages are: the time saved; the possibility of studying large areas; and the ability to look back in time thanks to data archives from several satellites. Many experiments have demonstrated that DInSAR is very useful in such fields like deformation caused by earthquake, volcanic activity motion, ice-sheet shift [14,15]. The effective way to measuring surface deformation with millimeter accuracy at high resolution is a microwave remote sensing technique Differential Synthetic Aperture Radar Interferometry [16]. This technique uses the phase difference (inerferogram) between two temporally separated SAR acquisitions to provide a measure of the ground deformation along the radar Line of Sight (LOS). Initially applied to characterize sizeable deformation events [15,17-22].
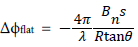
Phase signatures related to the flat-earth and topography must be removed in order to get accurate results for DInSAR technique, and so isolating the ground displacement c and topography component. The ϕflat can be extracted using baseline based on the interferometric geometry or the satellite state vectors data, and then subtracted from the initial interferogram [13]. In order, to derive dam body vertical displacement maps at last year’s Repeat-pass space-borne DInSAR has been used. Two SAR images acquired from two distinctive positions, at different revisit times, are used to measure the phase difference, or socalled interferogram, between the two acquisitions. The only depending factor for the interferometric phase of each SAR image pixel is the resolution cell. The phase difference can have contributions from five different sources: Δøflat is the flat Earth phase this kind of the phase which is introduced by the earth curvature.
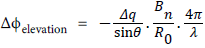
Δøelevation is the topographic this kind of the phase introduced by the interferometric phase. Δødisplacement is the surface deformation this kind of the phase introduces by the interferometric phase. Δøatmosphere is the atmospheric contribution to the interferometric phase. It is introduced due to the atmospheric humidity, temperature and pressure change between the two acquisitions. Δønoise is the kind of the phase noise introduced by temporal change of the scatters, different look angle, and volume scattering.

Results and Discussion
This paper process 6 images acquired in a descending geometry by the European Space Agency (ESA) Sentinel-1A sensor starting from October 2014, November 2015 and February 2016 three Interferograms from Sentinel-1A sensor, from descending geometries, were computed for monitoring the dam body subsidence during the period 2014–2016.
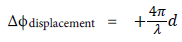
(DInSAR) technic has been applied to review the vertical surface movement (movement of the dam body to downward). The Sentinel-1A dataset provides a High deformation map (Figure 3A), showing a subsidence rate largely located within of the Dam body, with a subsidence rate from 7–14 mm/yr within the period 2014–2015. Figure 3B shows a subsidence about 9–20 mm/yr within the period 2015-2016. The Mosul dam is subsiding at a linear rate of ~17 mm/ 2010. The observed subsidence is likely caused by two reasons first one is related to engineering geology problems, the soluble gypsum, anhydrite, marl, and limestone beneath the dam body, each of that is soluble in water and extending to a great when Water began to run through and washout those mineral vanes after the construction of the dam, and the second reason is related to engineering problems, the continued method of grouting beneath dam body seems has never solved the matter that means grouting ineffective and should push matters to additional deterioration of the foundation layers of rocks beneath the lake similarly because the dam itself. This deterioration is probably created by the continuing grouting, which is inflicting the gypsum vanes to get larger with time, this is often an obvious by the generation of underground cavities in situ of the dissolved gypsum and therefore the movement of the big quantities of the grouting materials Figure 4A, wherever ground surface is showing subsidence all around the dam. According to these results this paper detects the possible collapse location within dam body according to DINSAR results. This result encourages us that DInSAR which is successor of sentinel 1A/SAR by comparing data from past satellite radar missions – ERS and have shown the drastic improvement in mapping surface deformation (Figure 4B). That allows to measure surface and dam’s deformations up to millimeter accuracies and must be more useful tool for detecting and monitoring dam subsidence on long time scales when used in conjunction with geotechnical measurements and other geologic information.
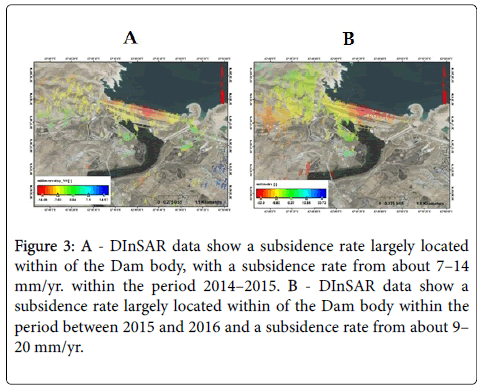
Figure 3: A - DInSAR data show a subsidence rate largely located within of the Dam body, with a subsidence rate from about 7–14 mm/yr. within the period 2014–2015. B - DInSAR data show a subsidence rate largely located within of the Dam body within the period between 2015 and 2016 and a subsidence rate from about 9– 20 mm/yr.
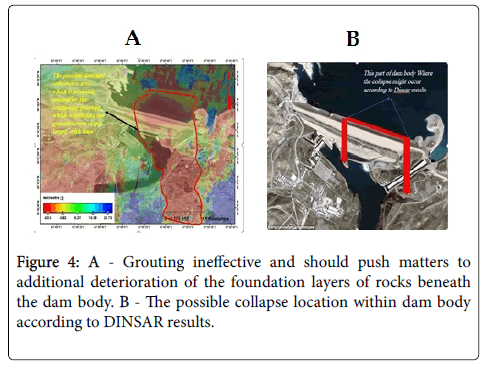
Figure 4: A - Grouting ineffective and should push matters to additional deterioration of the foundation layers of rocks beneath the dam body. B - The possible collapse location within dam body according to DINSAR results.
Comparison study
After comparison study between subsidence of the period 2014– 2015 and the period 2015_2016 (Figure 5). DInSAR data show a subsidence of 20 millimetres of settlement and lateral movement within 2015-2016. This may seem to be very large subsidence, but for a dam of such significant size—and the largest in Iraq—such a move over a short period of time may be a tell-tale sign of an upcoming disaster while the subsidence of the period 2014-2015 is 14 millimetres which is also sign of dangerous This large difference in subsidence rate is due to the continued method of grouting beneath dam body.
Figure 5: Comparison between subsidence for 2015-2016 and 2014-2015.
Conclusion and Recommendations
Based on interferometric results and geological/geotechnical observations, the explanation of the detected subsidence permits to confirm the collapse at any time so as to warn the Iraqi government and all worlds for creating the most effective steps to stop this ruinous and dramatic collapse.
This paper provides comprehensive Recommendations to Iraqi Government and United Nations:
1. Design radar remote sensing tools for the Mosul Dam subsidence detecting using new NASA and European Space Agency satellites.
2. An international panel of remote sensing experts must be called to study this very large subsidence rate using machine learning algorithms in order to get more results.
2. An international panel of remote sensing experts must be called to study this very large subsidence rate using machine learning algorithms in order to get more results.
4. Advise Baghdad government to stop grouting to save money and the dam exactly it has given a $300 million contract to an Italian firm to introduce new grouting technology.
References
- Massonnet D, Feigl KL (1998) Radar interferometry and its application to changes in the earth's surface. Reviews of Geophysics 36: 441-500.
- Crosetto M, Crippa B, Biescas E, Monserrat O, Agudo M, et al. (2005) Land deformation measurement using SAR interferometry: State-of-the-art, Phogrammetrie Fernerkundung Geoinformation 06: 497-510.
- Strozzi T, Wegmuller U (1999) Land subsidence in Mexico city mapped by ERS differential SAR interferometry. IEEE Trans Geosci. Remote Sensing 1940-1942.
- Fernández P (2014) DinSar interferometry of radar satellite images: Quantitative assessment of vertical ground deformations in the guadalfeo river valley and metropolitan area (Granada, South of Spain). ESA project Cat-1 N 1382, the Special Action REN 2002-1276E, the projects P06-RNM-02125 (Andalusian Government) and CGL2005-03332 (BTE) of the Spanish Ministry of Education and Science.
- Saeedy H (2007) The middle east seismological forum special reporting of the Mosul dam issue file.
- Kelley JR, Wakeley LD, Seth W (2007) Geologic setting of Mosul dam and its engineering implications.
- Buday T (1980) The regional geology of Iraq. Stratigraphy and Palaeogeography p: 445.  Â
- Jassim SZ, Karim SA, Basi M, Al-Mubarek MA, Munir J (1984) Final report of the regional geological survey of Iraq. In: Geological Survey of Iraq. p: 3.
- Jassim SZ, Hagopian D, Al-Hashimi H (1986) The geologic map of Iraq (scale 1:100,000,000). Geologic Survey of Iraq.
- Jassim SZ, Jabril AS, Numan NMS (1997) Gypsum karstification in the Middle Miocene Fatha formation, Mosul area, Northern Iraq. Geomorphology 18: 137-149
- Jassim SZ, Raiswell R, Bottrell SH (1999) Genesis of the Middle Miocen estratabound sulphur deposits of northern Iraq. Journal of the Geological Society, London 156: 25-39.
- Paley AR (2007) Iraqi dam seen in danger of deadly collapse. The Washington Post.
- Fang M (2008) The International Archives of the Photogrammetry: Remote Sensing and Spatial Information Sciences. p: 37.
- Massonet D, Feigl KL (1998) Radar interferometry and its application to changes in the earth’s surface. Reviews of Geophysics. 36: 441-500.
- Rosen PA, Hensley S, Joughin IR, Li FK, Madsen SN, et al. (2000) Synthetic aperture radar interferometry. Proceeding of the IEEE. 88: 333-382.
- Amelung F, Galloway DL, Bell JW, Zebker HA, Laczniak RJ (1999) Sensing the ups and downs of Las Vegas: InSAR reveals structural control of land subsidence and aquifersystem deformation. Geology 27: 483–486.
- Gabriel AK, Goldstein RM, Zebker HA (1989) Mapping small elevation changes over large areas: Differential interferometry. J Geophys Res 94: 9183–9191.
- Massonnet D, Rossi M, Carmona C, Adragna F, Peltzer G, et al. (1993) The displacement field of the Landers earthquake mapped by radar interferometry. Nature 364: 138–142.
- Massonnet D, Briole P, Arnaud A (1995) Deflation of Mount Etna monitored by spaceborne radar interferometry. Nature 375: 567–570.
- Rignot E (1998) Fast recession of a west Antarctic glacier. Science 281: 549–551.
- Peltzer G, Rosen PA (1995) Surface displacement of the 17 May 1993 Eureka Valley earthquake observed by SAR interferometry. Science 268: 1333–1336.
Citation: Ahmed SMS (2017) The Most Dangerous Subsidence Detecting of Mosul Dam by Multi-Pass Differential SAR Interferometry using Sentinel 1A Satellite Images from 2014 to 2016 . J Earth Sci Clim Change 8: 422. DOI: 10.4172/2157-7617.1000422
Copyright: © 2017 Ahmed SMS. This is an open-access article distributed under the terms of the Creative Commons Attribution License, which permits unrestricted use, distribution, and reproduction in any medium, provided the original author and source are credited
Select your language of interest to view the total content in your interested language
Share This Article
Recommended Journals
Open Access Journals
Article Tools
Article Usage
- Total views: 4381
- [From(publication date): 0-2017 - Dec 19, 2025]
- Breakdown by view type
- HTML page views: 3460
- PDF downloads: 921