Research Article Open Access
The Volumetric Changes of the Lips in Orthodontic Patients with Bonding or Debonding Labial Fixed Orthodontic Appliances
Hyun-Tae Yook, Insan Jang*, Dong-Soon Choi, Kiyong An and Bong-Kuen Cha
Department of Orthodontics, College of Dentistry, Gangneung-Wonju National University, Gangneung, South Korea
- Corresponding Author:
- Insan Jang
Associate Professor
Department of Orthodontics
College of Dentistry
Gangneung-Wonju National University
120 Gangneung Daehangno
Gangneung City, Gangwon Province
210-702, South Korea
E-mail: insan@gwnu.ac.kr
Received date: October 13, 2014; Accepted date: November 7, 2014; Published date: November 11, 2014
Citation: Yook HT, Jang I, Choi DS, An K, Cha BK (2014) The Volumetric Changes of the Lips in Orthodontic Patients with Bonding or Debonding Labial Fixed Orthodontic Appliances. J Interdiscipl Med Dent Sci 3:159. doi:10.4172/2376-032X.1000159
Copyright: © 2014 Yook HT, et al. This is an open-access article distributed under the terms of the Creative Commons Attribution License, which permits unrestricted use, distribution, and reproduction in any medium, provided the original author and source are credited.
Visit for more related articles at JBR Journal of Interdisciplinary Medicine and Dental Science
Abstract
Objective: The aim of this study was to evaluate volumetric change in the lips after placement or removal of labial fixed orthodontic appliances using three-dimensional (3D) surface scanning system.
Materials and methods: Bonding group is composed of 30 patients who planned to start orthodontic treatment, and debonding group is another 30 patients who had been treated successfully with Class I normal occlusion and planned to remove the brackets. Three-dimensional facial scanning was performed before placement (T1), immediately after placement (T2) of the labial orthodontic appliances, and before removal (t1), immediately after removal (t2), 3 to 6 months after removal of the appliances (t3). The volumetric differences of the lips were calculated.
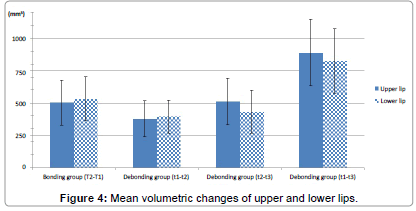
Results: The volume of lips increased after bonding the brackets 502 mm3 in the upper lip and 534 mm3 in the lower lip on average. In debonding group, the volume in the upper and lower lips decreased 376 mm3 and 394 mm3 respectively immediately after debonding, and more decreased 513 mm3 and 431 mm3 for the 3-6 months of retention period on average. Comparison between volumetric changes during t1-t2 and t2-t3 showed no significant differences. In the comparison between bonding and debonding groups, the volumetric differences between T1 and T2 in bonding groups were not significantly different with those between t1 and t2 in debonding group, but significantly different with those between t1 and t3.
Conclusion: The upper and lower lips were protruded immediately after bonding the brackets, and retruded immediately after debonding them. The lips were retruded more during the retention period.
Keywords
Lip; Bracket; Bonding; Debonding; Surface scanner; Volumetric analysis
Introduction
Great concern has been drawn toward facial esthetics as one of the major goals of orthodontic treatment [1,2]. Profile of lips or facial soft tissue could be changed by orthodontic treatments [3-6] and some investigators suggested a close relationship between the position of the lips and incisors [7-9]. Retraction ratios of incisors to the upper lip in four first premolar extraction cases have been reported to range from 3.2:1 to 1.5:1 [10,11] and for the lower lip from 1.8:1 to 0.4:1 [10,12].
Fixed orthodontic appliances are usually placed on the labial surfaces of teeth, which might affect the position of the lips. Orthodontic patients would feel their lips protruded with bonding labial brackets at the beginning of treatment, and also expect their lips to be retruded after removal. However, the effect of labial attachments on the posture of the lip had a little been investigated [13,14]. Lee et al. [14] evaluated the lip and facial soft tissue after removal of brackets by lateral cephalograms, and Abed et al. [13] assessed lip posture after debonding brackets by conventional photographs. However, they used two-dimensional (2D) images which three-dimensional (3D) structure was projected on, so that the assessment was based on the linear and angular measurements. The development of 3D surface scanning system allows us to record 3D facial images and to evaluate the volumetric changes of facial soft tissue. The aim of this study was to evaluate the volumetric change of the lips after placement or removal of labial fixed orthodontic appliances using 3D images acquired by a surface scanning system.
Materials and Methods
Two groups were included in this prospective study. Bonding group consisted of 30 patients who planned to start orthodontic treatment (18 females, 12 males, mean age 22.3 years), and debonding group was another 30 patients who had been treated successfully with Class I normal occlusion and planned to remove the brackets (18 females, 12 males, mean age, 22.5 years). All the patients were (1) older than 16 years of age in female, and 18 years of age in male, (2) with no history of congenital deformity in craniofacial region, (3) planned to be treated or had been treated with metal MBT Victory Series 0.022 inch brackets (3M Unitek Dental Products, Monrovia, Calif). Ethical approval was obtained from the ethics committee of Gangneung-Wonju National University Dental Hospital (IRB 2010-1-7) and informed consent forms were signed by the patients.
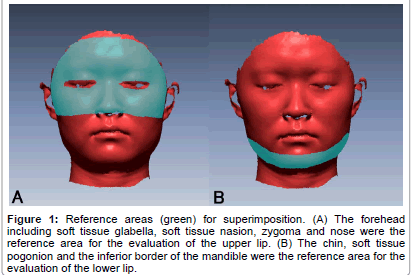
Three-dimensional facial scannings were performed before placement (T1), immediately after placement of the labial orthodontic appliances (T2) for the bonding group, and before removal (t1), immediately after removal (t2), and 3 to 6 months after removal of the appliances (t3) for the debonding group. The patients were instructed to lean back in their chairs with facial muscles relaxed, teeth in occlusion, lips in slight contact, and the eyes lightly closed. Their faces were scanned by Rexcan III 3D scanner (Solutionix Corp., Seoul, Korea). The scanning system consisted of 2 high resolution CCD cameras with 0.8 Mega resolution. Each camera emits a white light, halogen lamp 250W, and scan time of 0.7 seconds. Facial scanning was conducted from frontal, right and left directions of patients and these three images were merged to produce one 3D facial image by ezScan software (Solutionix Corp., Seoul, Korea). Three-dimensional facial images were transferred to reverse modeling software program, Rapidform XOR/REDESIGN 3 (INUS Technology Inc, Seoul, Korea) for superimposition and measuring the volume. Each set of images was registered initially at 5 points; the outer and inner canthus of the eyes and the nasal tip. Final regional registration was performed by the best-fit method on the following reference area (Figure 1); the forehead included soft tissue glabella, soft tissue nasion, zygoma and nose were the reference area for the evaluation of the upper lip (Figure 1A), and the chin, soft tissue pogonion and the inferior border of the mandible were for the lower lip (Figure 1B).
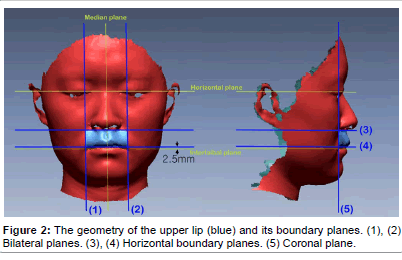
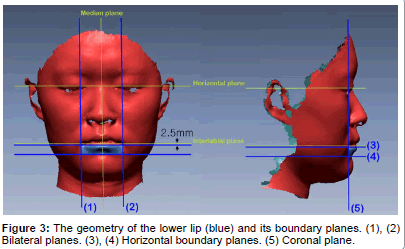
The horizontal reference plane was defined as a plane 7 degrees inferior to the cantion-superaurale lines [15,16], and registered on the cantion. The median plane was defined as a plane perpendicular to the horizontal plane and through the bilateral pupils. The interlabial plane was defined as a plane parallel with horizontal plane and through the midpoint of bilateral chellions. Additionally, 7 boundary planes were created to construct the 3D geometries of upper and lower lips on the 3D facial images of T1 and t1 (Figure 2 and 3). Bilateral planes were parallel with the median plane and through the bilateral chellions. The coronal plane was perpendicular to the horizontal plane and median plane through the chellions. The two horizontal boundary planes in the upper lip were through the subnasale or 2.5mm higher than the interlabial plane. The other two horizontal boundary planes in the lower lip were through the soft tissue B point and 2.5mm lower than the interlabial plane. The volumes of the geometries of upper and lower lips, which were surrounded by these boundary planes, were calculated.
Error test and statistical analysis
Three-dimensional facial scanning of 10 people was conducted twice with an interval of 30 minutes to assess method error. The method error was calculated by Dahlberg’s formula: mean square error (SE2) = Σd2/2n (where d is the difference between repeated measurements and n is the number of scans recorded) [17]. The volumetric differences were 198 mm3 for upper lip, 197 mm3 for lower lip.
Mann-Whitney U test was performed to calculate the statistical differences between male and female, and there was no statistically significant difference. Therefore, the measurement of male and female were combined for subsequent analysis. The Kolmogorov-Smirnov test showed lack of normality of distribution for most measurements used in this study. Comparisons of the measurements at 2 time periods were carried out with nonparametric statistics with Wilcoxon test. Differences between bonding and debonding groups were evaluated by Mann-Whitney U test. All statistical analyses were performed using the Statistical package program (PASW Statistics 18, SPSS Inc, Chicago III).
Results
As shown in Table 1, the volumes of upper and lower lips between 2 time intervals were significantly different in bonding and debonding groups. The volume of upper and lower lips in bonding group increased 502 mm3 and 534 mm3 on average, respectively. On the other hands, the volume of upper and lower lips decreased 376 mm3 and 394 mm3 immediately after debonding the brackets, and 513 mm3 and 431 mm3 more for the 3 to 6 months of retention periods in debonding group (Table 1 and Figure 4). In the comparison between bonding and debonding groups, the volumetric differences between T1 and T2 in bonding groups were not significantly different with those between t1 and t2 in debonding group, but significantly different with those between t1 and t3 (Table 2).
Discussion
We measured the volumetric differences of the lips on the superimposition of 3D facial images to evaluate the positional change of lips by labial orthodontic appliances. Our results suggest that lip posture is changed by placement or removal of labial appliances. As the volume of lips increased after bonding brackets and decreased after debonding, it is considered that upper and lower lips were protruded after bonding brackets and retruded after removal the appliances. Interestingly the volume of the lips continued decreasing during the retention period in deboding group. Our results were consistent with the previous study [14] that the lips was retruded immediately after debonding and retruded more during the retention period of 1.5 months. This longitudinal change may indicate adaptation of the lip and perioral muscle to the new position after orthodontic treatment. On the other hand, Abed et al. [13] evaluated lip posture on the conventional photographs and reported that no significant differences were found in the lip posture between before and immediately after debonding of brackets.
Figure 1:Reference areas (green) for superimposition. (A) The forehead including soft tissue glabella, soft tissue nasion, zygoma and nose were the reference area for the evaluation of the upper lip. (B) The chin, soft tissue pogonion and the inferior border of the mandible were the reference area for the evaluation of the lower lip.
| Bonding group (n=30) | Debonding group (n=30) | |||||||||||
|---|---|---|---|---|---|---|---|---|---|---|---|---|
| MC � (T2-T1) | SD | P | MC (t1-t2) | SD | P | MC (t2-t3) | SD | P | MC (t3-t1) | SD | P | |
| Upper lip | 502 | 347 | 0.000 | 376 | 281 | 0.000 | 513 | 360 | 0.000 | 889 | 512 | 0.000 |
| Lower lip | 534 | 338 | 0.000 | 394 | 259 | 0.000 | 431 | 330 | 0.000 | 825 | 504 | 0.000 |
| Wilcoxon test | ||||||||||||
MC= Mean Change
Table 1: Mean volumetric changes in bonding and debonding groups.
| Bonding group (T2-T1) vsDebonding group (t1-t2) | Bonding group (T2-T1) vsDebonding group (t1-t3) | |||
|---|---|---|---|---|
| P | sig | P | sig | |
| Upper lip | 0.117 | NS | 0.001 | * |
| Lower lip | 0.092 | NS | 0.014 | * |
| Mann-Whitney U test | ||||
Table 2: Comparison of volumetric changes between bonding and debonding groups.
We had taken 3D facial scanning of patients with the lips in slightly closed position to capture a relaxed lip posture repeatedly. Oliver7 concluded that the instruction to “bring the lips lightly closed” would allow the subject to facilitate positioning the lips in a repeatable manner. We superimposed each set of 3D facial images twice on different reference areas for the evaluation of the upper and lower lips respectively. Upper third of face including the forehead, zygoma and nose were the reference area for the evaluation of the upper lip, because these areas were not considered to be affected by orthodontic treatment. For the evaluation of lower lips, however, the soft tissue including chin, pogonion, and the inferior border of the mandible were used as reference area instead of upper face to rule out the effect of mandibular deviation on superimposition. Lower lip is subject to be affected by unexpected movement of mandible. According to the study of Choi et al. [18], the validity of superimposition of facial images becomes weakened as reference area is reduced. They reported that significant differences were found in the measurements of landmarks of lower face such as pogonion and gonion, when 3D facial images were superimposed on the upper half of the face and nose.
Conclusion
• The upper and lower lips are protruded immediately after bonding the labial fixed orthodontic appliances and retruded backward after removal of them.
• Lips have been retruded not only immediately after removal of the labial appliances, but also during the retention period of after orthodontic treatment.
Acknowledgements
This study was supported by 2011 Research-year system of Gangneung- Wonju National University.
References
- Holdaway RA (1983) A soft-tissue cephalometric analysis and its use in orthodontic treatment planning. Part I. Am J Orthod 84: 1-28.
- Arnett GW, Bergman RT (1993) Facial keys to orthodontic diagnosis and treatment planning. Part I.Am J OrthodDentofacialOrthop 103: 299-312.
- Talass MF, Talass L, Baker RC (1987) Soft-tissue profile changes resulting from retraction of maxillary incisors.Am J OrthodDentofacialOrthop 91: 385-394.
- Drobocky OB, Smith RJ (1989) Changes in facial profile during orthodontic treatment with extraction of four first premolars.Am J OrthodDentofacialOrthop 95: 220-230.
- Moseling KP, Woods MG (2004) Lip curve changes in females with premolar extraction or nonextraction treatment.Angle Orthod 74: 51-62.
- Wholley CJ, Woods MG (2003) The effects of commonly prescribed premolar extraction sequences on the curvature of the upper and lower lips.Angle Orthod 73: 386-395.
- Oliver BM (1982) The influence of lip thickness and strain on upper lip response to incisor retraction.Am J Orthod 82: 141-149.
- Hershey HG (1972) Incisor tooth retraction and subsequent profile change in postadolescent female patients.Am J Orthod 61: 45-54.
- Rains MD, Nanda R (1982) Soft-tissue changes associated with maxillary incisor retraction.Am J Orthod 81: 481-488.
- Diels RM, Kalra V, DeLoach N Jr, Powers M, Nelson SS (1995) Changes in soft tissue profile of African-Americans following extraction treatment.Angle Orthod 65: 285-292.
- Le TN, Sameshima GT, Grubb JE, Sinclair PM (1998) The role of computerized video imaging in predicting adult extraction treatment outcomes.Angle Orthod 68: 391-399.
- Caplan MJ, Shivapuja PK (1997) The effect of premolar extractions on the soft-tissue profile in adult African American females.Angle Orthod 67: 129-136.
- Abed Y, Har-Zion G, Redlich M (2009) Lip posture following debonding of labial appliances based on conventional profile photographs.Angle Orthod 79: 235-239.
- Lee JS, Choy K, Park YC, Kim KH (2007) Changes in lip and perioral soft tissue after bracket removal. The Korean Journal of Orthodontics 37:125-136.
- Swennen GRJ, Schutyser F, Lemaitre A, Malevez C, De Mey A (2005) Accuracy and reliability of 3-D CT versus 3-D stereo photogrammetry based facial soft tissue analysis. Int J Oral MaxillofacSurg34:73.
- Plooij JM, Swennen GRJ, Rangel FA, Maal TJ, Schutyser FA, et al (2009) Evaluation of reproducibility and reliability of 3D soft tissue analysis using 3D stereophotogrammetry. Int J Oral MaxillofacSurg38:267-273.
- Dahlberg G (1940) Statistical methods for medical and biological students. Statistical Methods for Medical and Biological Students. Br Med J 2: 358–359.
- Choi HH, Cho JH, Park HJ, Oh HK (2009) Validity of Superimposition Range at 3-Dimensional Facial Images. Journal of the Korean Association of Maxillofacial Plastic and Reconstructive Surgeons. 31:149-157.
Relevant Topics
- Cementogenesis
- Coronal Fractures
- Dental Debonding
- Dental Fear
- Dental Implant
- Dental Malocclusion
- Dental Pulp Capping
- Dental Radiography
- Dental Science
- Dental Surgery
- Dental Trauma
- Dentistry
- Emergency Dental Care
- Forensic Dentistry
- Laser Dentistry
- Leukoplakia
- Occlusion
- Oral Cancer
- Oral Precancer
- Osseointegration
- Pulpotomy
- Tooth Replantation
Recommended Journals
Article Tools
Article Usage
- Total views: 15056
- [From(publication date):
February-2015 - Aug 18, 2025] - Breakdown by view type
- HTML page views : 10401
- PDF downloads : 4655
