Turbidity and Suspended Solids Characteristics of River Elemi and Ureje, Ado Ekiti, Nigeria
Received: 07-Apr-2017 / Accepted Date: 29-Apr-2018 / Published Date: 05-May-2018
Abstract
Suspended solid transport plays a key role in the transport of contaminants in rivers; hence, quantifying suspended solid concentration (SSC) is essential to understanding contaminant transport. This study presents the turbidity and suspended solids characteristics of River Elemi and Ureje, Ado Ekiti by establishing a relationship between suspended solids concentration (SSC) and turbidity to quantify the suspended solids concentration (SSC) in the rivers. The results indicate positive correlation R2=0.86 and R2=0.97, respectively between suspended solids concentration (SSC) and turbidity suggesting turbidity as a satisfactory parameter to monitor suspended solid concentration (SSC) in the river. The turbidity and suspended solid concentration (SSC) for sets of samples from river Elemi and Ureje show different values, the average SSC in Elemi river samples are 1.2 times higher than SSC in Ureje river samples. The study assessed human activities as a factor impacting turbidity and suspended solids concentration with the spatial variation of the parameters.
Keywords: Turbidity; Suspended solid; Concentration; Transport; Contaminants
Introduction
Accurate measure of suspended solid transport processes is essential for predictions of the behaviours of rivers. Scalar transport and deposition rates depend upon accurate specification of the suspended solid concentration in the flow. Determining the nature, characteristics and distribution of suspended solids in a river is important for several reasons. Suspended solids affect light penetration through the water column causing water to be turbid. It influences the physical and chemical processes in water column. They can also influence the propagation of momentum and solutes thereby affecting turbulence characteristics. Suspended solids are a global pollutant as the distribution of pollutants is directly affected by the distribution of suspended solids which aid the transport of micro pollutants. Many pollutants attach to the surface of suspended solid particles are therefore distributed in the same way as the solid particle, also suspended solids form a potential source of pollution as heavy metals and pesticides may be absorbed by the solids. Musy and Higy [1] suggest suspended solids probably act as the primary transport mechanism for pollutants and nutrients in streams through flocculation, adsorption and colloidal action. The measurement of TSS is time consuming, and much research has been done to correlate secondary parameters to TSS, such as discharge turbidity and water density [2-8]. Each surrogate has limitations in statistical certainty, predictive power and logistical coordination [9,10]. As one of the least expensive and easiest to measure methods, turbidity has been utilized extensively in many environments [11,12].
The study area
River Ureje lies on longitudes 005°18.653”E and latitudes 07°37.674”N (Table 1) and River Elemi comes from the mountainous sides which flow through Afe Babalola University, Ado-Ekiti and across Ado-Ikare road. Elemi River lies on longitudes 005°18.683”E and 07°36.603”N. The area is underlain by Precambrian basement complex rocks (Figure 1).
| Sampling Station | Elevation (ft) | Longitude and latitude |
|---|---|---|
| Ureje River | 451 | N07°37.674”, E005°18.653” |
| Elemi River | 357 | N07°36.603”, E005°18.683” |
Table 1: Table showing the location of the study area.
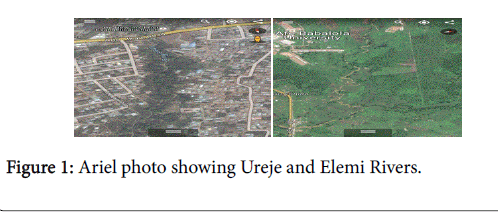
Figure 1: Ariel photo showing Ureje and Elemi Rivers.
Materials and Method
Samples were taken at the study areas to the Ekiti State University laboratory for testing. Many factors have been considered to obtain accurate readings. Among the factors considered are the time and duration of sampling, weather, equipment, methods to be used as well as testing materials as recommended by the World Health Organization (WHO) on sampling procedure. For each river, five samples denoted L1-L5 traversing the section of the river was collected at an interval of 5 m from the river banks. This was to investigate the spatial variation of turbidity and suspended solid concentration in the rivers. Preservation of samples was carried out to protect and ensure the samples to be tested in the laboratory has a quality of originality in any case similar to the site for a period of time specified by WHO standard. Water samples from both rivers were taken to the laboratory for turbidity and suspended solids concentration (SSC) measurements.
Turbidity measurement
Turbidity was measured using a turbidity meter which measures the amount of light that is scattered at 90° angle to the incident beam in NTU (Nephelometric Turbidity Units). The meter was standardized using the 0.02 NTU Reference Standards. Samples were mixed to thoroughly disperse the solids. A cleaned indexed sample cuvette was filled to within approximately 50 mm from sample bottle and aligned with the locator pin on the optical well. NTU readings were directly taken from the display. Turbidity was read within 3-5 s of display which formed a suitable display range for best resolution.
Suspended solid concentration (SSC) measurement
SSC was measured using filtration method in line with the American Society for Testing and Materials. The porcelain with membrane cellulose filter was dried at 103°C to remove water vapour. A well shaken 25 ml of each river water sample was filtered through membrane cellulose filter with pore size of 0.22 μm using vacuum filter pump. The filter paper was dried in 103°C oven for 60 min and later transferred to desiccators for another 60 min to avoid water vapour absorption from surrounding environment. The filter from the desiccators was removed and weighed. After zeroing the balance, the filter was placed on the scale and until reading stabilizes for taking results before removing the filter from the scale.
The SSC reading was measured by the difference between the total mass of dried porcelain crucible, membrane filter and its filtrate and the empty dry crucible with membrane filter over the volume of 25 ml river water sample as follows:
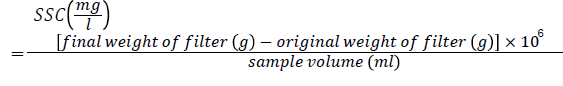
The laboratory results were statistically analyzed for spatial variations and correlation analysis.
Results and Discussion
The turbidity and suspended solid concentrations (SSC) for sets of sampling from river Elemi and Ureje show different values. The average SSC in Elemi river samples are 1.2 times higher than SSC in Ureje river samples (Table 2) in locations L1-L4.
| River Elemi | River Ureje | |||
|---|---|---|---|---|
| Sampling Location | Turbidity (NTU) | SSC (mg/L) | Turbidity (NTU) | SSC (mg/L) |
| L1 | 2.74 | 6.34 | 2.4 | 3.9 |
| L2 | 2.48 | 5.48 | 1.36 | 2.84 |
| L3 | 1.67 | 3.72 | 2.63 | 5 |
| L4 | 2.42 | 4.68 | 2.54 | 4.67 |
| L5 | 1.8 | 3.1 | 2.43 | 3.2 |
Table 2: Turbidity and SSC values for River Elemi and Ureje.
Locations with highest SSC also recorded the highest turbidity. Location 1 (L1) recorded the highest SSC value of 6.34 mg/L with corresponding 2.74 NTU for turbidity in Elemi river. Samples at Ureje river show maximum SSC 5.0 mg/L and turbidity 2.63 NTU at location 3 (L3).
A comparative distribution of Turbidity is shown in Figure 2; for more comparative assessment of the data set, a similar distribution for SSC is presented in Figure 3. Turbidity measures show similar trends in distribution except at the location L3 (Figure 2) whilst SSC estimates demonstrate uniform trend of occurrence with the exception at the location L2 and L3 for both rivers. The results suggest high turbidity subsequent to high suspended solids at locations L1-L2 in Elemi River and L3-L4 at Ureje River. The results demonstrate the catchment land use and associated human activities in the study areas. The variation and distribution of these parameters is attributed to the characteristic of suspended solids, river flow and transport processes of the catchment areas.
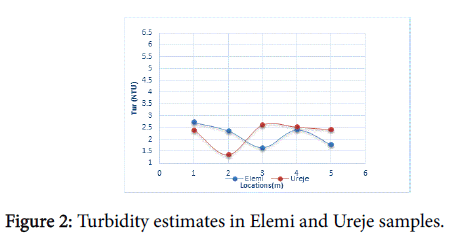
Figure 2: Turbidity estimates in Elemi and Ureje samples.
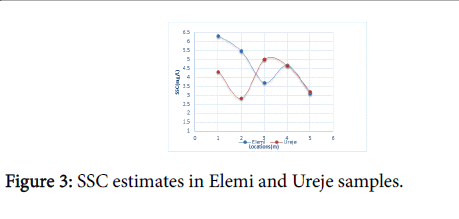
Figure 3: SSC estimates in Elemi and Ureje samples.
Analysis of correlation
Using a linear regression equation, the final linear regression equations are presented in Table 3. Figures 4 and 5 indicate that there is a direct relationship between SSC and turbidity with R2=0.86 and R2=0.97 for Elemi and Ureje Rivers respectively. Correlation coefficients in the regression models developed previously have been ranging between 0.85-0.99 producing comparable results to the present study.
| River | Regression model |
|---|---|
| Elemi River | SSC=0.320(TUR)+0.709 |
| Ureje River | SSC=0.487(TUR)+0.194 |
Table 3: SSC/turbidity linear regression models.
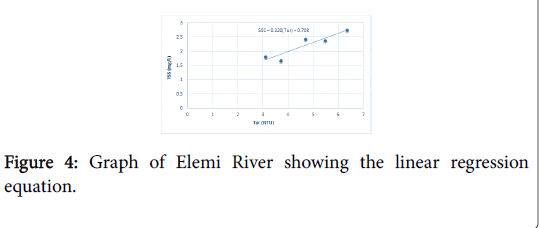
Figure 4: Graph of Elemi River showing the linear regression equation.
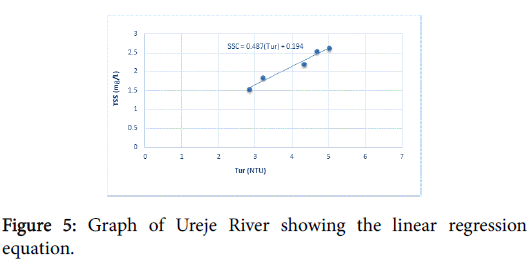
Figure 5:Graph of Ureje River showing the linear regression equation.
To validate the regression equations in Table 3, different water samples were collected at a varying reach from the river bank of Elemi and Ureje River at distances 2 m, 5 m, 10 m and 15 m, respectively. Turbidity values of those samples were established and new corresponding values of SSC were established using the linear equation from the analysis of Turbidity and SSC in Table 3. Using the linear equation developed, the corresponding SSC were calculated for the turbidity measurements. Figures 6 and 7 shows the estimated SSC for the models. The estimated SSC values are consistent with the model input turbidity values thereby validating the relationship models for turbidity and SSC.
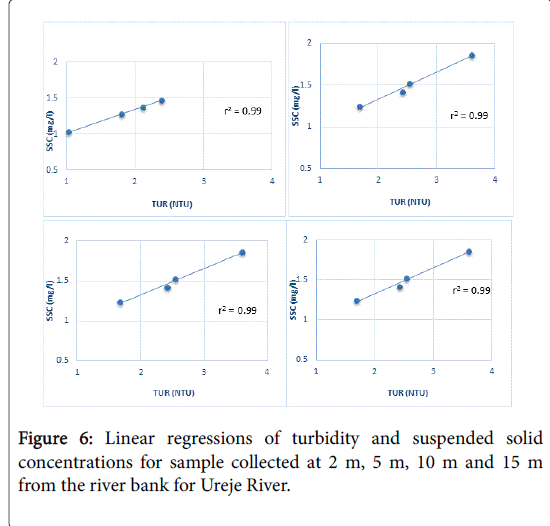
Figure 6:Linear regressions of turbidity and suspended solid concentrations for sample collected at 2 m, 5 m, 10 m and 15 m from the river bank for Ureje River.
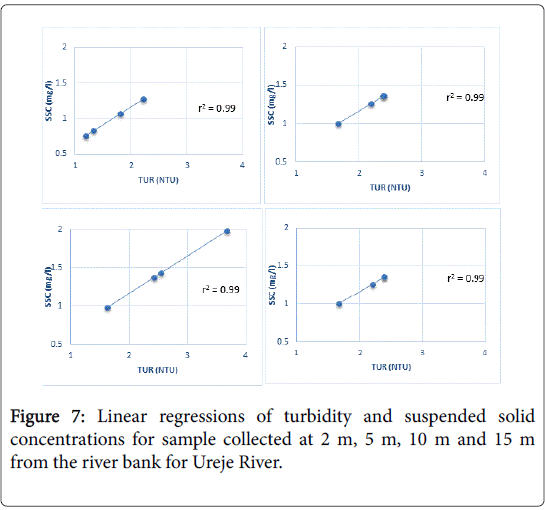
Figure 7:Linear regressions of turbidity and suspended solid concentrations for sample collected at 2 m, 5 m, 10 m and 15 m from the river bank for Ureje River.
Conclusion
The results of this study demonstrate turbidity as potentially viable surrogate measurement for determining suspended solids concentration (SSC) in rivers. The correlation analysis shows strong positive relationship between Turbidity and SSC for both sets of sampling. Data collected from both Elemi and Ureje river show a strong positive linear relationship (r2=0.99) between turbidity and SSC. The models were used in predicting SSC levels from continuously measured turbidity in the rivers. Models established to correlate turbidity and SSC in Elemi and Ureje Rivers can be used to estimate SSC for any period under consideration with adequate samples collection and analysis. Results of the study is suitable for better understanding the variation and fluctuation of turbidity and SSC in Elemi and Ureje Rivers for prevailing water conditions of both rivers and to provide information for the river management.
References
- Musy A, Higy C (2011) Hydrology: A science of nature. Sci Pub 2: 228-231.
- Juazo DVH, Martinez FJR, Tejero GI, Pleguezo RR, Raya AM, et al. (2012) Runoff and sediment yield from a small watershed in southeastern Spain, implications from water quality. Hydrol Sci J 57: 1610-1625.
- Gilvear DJ (1988) Suspended solids transport in the regulated river Blithe, Staffordshire, UK. River Res Appl 2: 117-129.
- Gippel CJ (1989) The use of turbidimeters in suspended sediment research. Hydrobiol 176: 465-480.
- Oluwafemi OK, Oluwadare O, Temidire D (2015) Water quality assessment of river Elemi and Ureje in Ado Ekiti, Nigeria. J Civil Environ Eng 5: 2015.
- Arthur CB, Ragsdale LH (2010) Surface water and climate: Hydrochemistry and water chemistry. CRC (Cooperative Research Centre), Water Quality and Treatment.
- Lewis J (1996) Turbidity-controlled suspended sediment sampling for runoff-event load estimation. Water Resour Res 32: 2299-2310.
- Paul JF, Kasprzyk R, Lick, W (1982) Turbidity in the western basin of lake Erie. J Geophys Res 87: 5779-5784.
- Suk NS, Guo Q, Psuty NP (1998) Feasibility of using a turbidimeter to quantify suspended solids concentration in a tidal saltmarsh creek. Estuar Coast Mar Sci 46: 383-391.
- Ragsdale LH (2013) Physical and chemical treatment of surface water. New Mexico.
- Sigler JW, Bjornn TC, Everest FH (1984) Effects of chronic turbidity on density and growth of steelheads and Coho salmon. Trans Am Fish Soc 113: 142-150.
- Christensen VG, Ziegler AC, Jian X (2001) Continuous turbidity monitoring and regression analysis to estimate total suspended solids and fecal coliform bacteria loads in real time. Proceedings of the Seventh Federal Interagency Sedimentation Conference 1: 94-101.
Citation: Folorunso OP, Aribisala JO (2018) Turbidity and Suspended Solids Characteristics of River Elemi and Ureje, Ado Ekiti, Nigeria. J Mater Sci Nanomater 2: 107.
Copyright: © 2018 Folorunso OP, et al. This is an open-access article distributed under the terms of the Creative Commons Attribution License, which permits unrestricted use, distribution, and reproduction in any medium, provided the original author and source are credited.
Select your language of interest to view the total content in your interested language
Share This Article
Recommended Journals
Open Access Journals
Article Usage
- Total views: 4820
- [From(publication date): 0-2018 - Dec 08, 2025]
- Breakdown by view type
- HTML page views: 3897
- PDF downloads: 923