Viral Dynamics and Ct Value Distribution with Age and Gender of COVID-19 Patients in a Tertiary Care Hospital Lahore, Pakistan
Received: 22-Mar-2021 / Accepted Date: 05-Apr-2021 / Published Date: 12-Apr-2021
Abstract
This was a retrospective study of 2,956 cases detected positive by RT-PCR to observe the viral dynamics in different age groups and gender using Ct value of COVID-19 patients, 78% cases were detected positive for ORF1ab and E gene, 15% cases were positive for ORF1ab and N gene while 8% cases were positive only for ORF1ab. The mean, median and 95% CI of Ct for ORF1ab were all numerically higher than the comparative value of E gene (mean, 27.26 vs. 26.31; median, 27.51 vs. 26.93 and 95% CI 26.92-27.60 vs. 25.98-26.63) p-value <0.0001 and N gene (mean, 35.22 vs. 29.58; median, 36.86 vs. 29.55 and 95% CI 34.65-35.0 vs. 29.33-29.82) p-value <0.0001. Nonparametric t-test showed no statistical difference in the viral load or density between male and female patients. When comparing different age groups, viral load at the age of 45-55 years and >65 years was quantitatively higher in female as compared to male patients with p-value 0.0399 and 0.0328 respectively. In conclusion, more men (65%) were infected as compared to female patients. Also the viral load or disease was more severe in male patients than female (36% vs. 24%) at the reproductive age group of 25-34 years.
Keywords: COVID-19; Viral dynamics; Cycle threshold; OPR1ab; N gene
Introduction
The novel coronavirus disease (COVID-19) emerged in 2019 that shake out the whole world and created an alarming situation [1]. World Health Organization (WHO) declared it as Pandemic in March 2020. The cause of this disease with Pneumonia like presentation was revealed through High throughput sequencing to be a novel -coronavirus. This virus is named as severe acute respiratory syndrome coronavirus 2 (SARS-CoV2) similar to severe acute respiratory syndrome coronavirus (SARS-CoV) [2,3]. By 19th September, 2020 30 million cases has been reported to suffer from this virus. In Pakistan, till date 304 thousand cases has been reported as COVID-19 with 292 thousand (96%) recoveries and 6408 deaths (2%) [4].
According to WHO guidelines, the reliable tool for diagnosis, screening and surveillance of COVID-19 cases is Reverse Transcriptase- Quantitative Polymerase Chain Reaction (RT-qPCR) test that detects RNA of SARS-CoV-2 in respiratory samples [3]. The results of the RT-qPCR are reported as either positive or negative [5]. The RT-PCR provides a measure for the viral load on the samples which is reported as Cycle Threshold (Ct) value.
It is important to know that RT-PCR test gives a value called the Cycle Threshold (Ct) value that measure of the viral load in the sample, and the reading is called It has been reported that Ct value (calculated viral load) can provide a useful insight to interpret the disease condition as clinical decision support tool [6,7]. Disease severity, prolong and worse course of illness and outcomes may be associated with the Lower Ct values which can provide useful information to predict the clinical course and prognosis of patients [8]. Active virus replication has been observed and measured from tissue samples and is used widely to observe various viral respiratory tract infections, their clinical progression, treatment response, cure, and relapse [9].
Amid uncertainties around COVID-19, a persistent pattern of age groups has been observed in various countries, male patients are at higher risk of mortality as compared to female patients, once infected with COVID-19 [3,10]. Like various infectious diseases, this gender-imbalanced fatality has been reported for COVD-19 as well. In contrast, data of over 40 countries with an apparently gender-neutral dispersion of COVID-19 cases: on normal, men account for 49.5% with total information on sex-specific infections and deaths [11].
The current study has been performed to observe the viral dynamics variation in different age groups and gender by using Ct value. Currently, in Pakistan, no study has been performed to report Ct value distribution in correlation with age and gender among symptomatic patients.
Materials and Methods
Study design
This was a retrospective cohort study of patients who were tested for COVID-19 at Jinnah Hospital, Lahore, Pakistan from March to September 2020. Jinnah Hospital, Lahore is a tertiary care hospital in the capital of largest province; Punjab. It is the pioneer hospital which is conducting large scale screening and diagnosis of CODI-19 by using RT-PCR in specialized healthcare. All the patients included were symptomatic and diagnosed as having COVID 19 infection according to WHO guidelines through RT-PCR.
Sample collection
All the patients tested for PCR were recruited after obtaining the written consent form. Nasopharyngeal swabs samples were collected according to WHO protocols [12]. Demographic data of patients including age and gender was taken. Information regarding clinical symptoms such as fever, sore throat, cough, loss of smell, loss of taste, shortness of breath, co-morbid condition, contact with COVID-19 patients and history of travel was noted. A commercially available plastic swab with a polypropylene fiber head was used to collect the nasopharyngeal samples. The swab was gently passed up the nostril to the posterior wall of the nasopharynx, held for approximately 3 seconds, rotated 2 or 3 times, withdrawn gently, and placed in 3 mL of virus transfer medium. Samples were immediately stored at 4-8˚C and transported on ice to the laboratory where they were analyzed for PCR within 24 hours of collection.
Inclusion criteria
During the whole study period, we included the patients who were diagnosed with SARS-CoV-2 infection via RT-PCR of nasopharyngeal swab samples according to the WHO interim guidance. Patients with other pulmonary disorders, former or current diabetes, cardiovascular disease, malignant tumor were identified as the underlying disease group.
Exclusion criteria
Patients with negative results SARS-CoV2 infection via a qualitative PCR of nasopharyngeal swab sample or with incomplete test results recorded were excluded from the study.
Viral extraction and real-time qualitative polymerase chain reaction
Viral extraction was performed by using Lab-aid Virus RNA extraction kit (Xiamen Zeesan Biotech, China. Catalog no.606104) using Lab-Aid 808/824/824s instrument according to manufacturer’s protocol. Samples were tested by PCR amplification using three commercial real-time PCR kits to detect SARS-CoV-2 RNA in nasopharyngeal swab specimens collected according to the Standard Operating Procedures (SOPs) established by National Institute of Health (NIH) and WHO [13]. The Open Reading Frame Lab (ORF1ab) and Nucleocapsid protein (N) genes were targeted and amplified simultaneously and tested by using Nucleic Acid Diagnostic kit from Sansure Biotech. ORF1ab and E-Gene were simultaneously detected using Bosphore Novel coronavirus (2019-nCoV) detection kit V2 (Anatolia Genework). Quantification of clinical samples was done and the results were expressed as Ct values for each target gene and Internal Control (IC). Ct is defined as the number of cycles required for the fluorescence signal to cross the threshold (i.e., exceed the background level).
Samples with the Ct-value of ≤ 40 were considered positive. The viral load of patient in the nasopharyngeal swab samples was estimated by Ct value of the N and E gene. Ct value is inversely proportional to the viral load, lower the Ct value, higher is the viral load and higher the Ct, lower the viral load in the sample.
Data collection and data analysis
Data were expressed as mean ± SD, median [interquartile range (IQR)], 95% Confidence Interval (CI) or percentages, as appropriate. Mean values and percentages were used to compare the difference between the two or more groups by using Mann-Whitney U-test and one way ANOVA. Pearson’s coefficient correlation was performed for the correlation between age, gender and Ct value. All the analysis was done on Graph Pad Prism (Prism 8.0, Graph Pad; SPSS 25.0, IBM).
Ethical approval
This study was approved by Institutional Ethical Review Board of Allama Iqbal Medical College/Jinnah hospital, Lahore (Ref No. 3/24/11/2020/S2/ERB) in 77th meeting of the board. To all study participant the objectives of the study were explained in their native language. A written consent was obtained from all those participants who agreed to participate in the study. The individuals who didn’t give consent, were not included in the study but this decline of consent had no effect on their diagnosis and treatment regimen. After the written consent, nasopharyngeal swab samples was obtained according to the Standard Operating Procedures (SOPs) approved by the ethical review board of the institution and the guidelines of NIH.
Results
PCR testing capacity at jinnah hospital
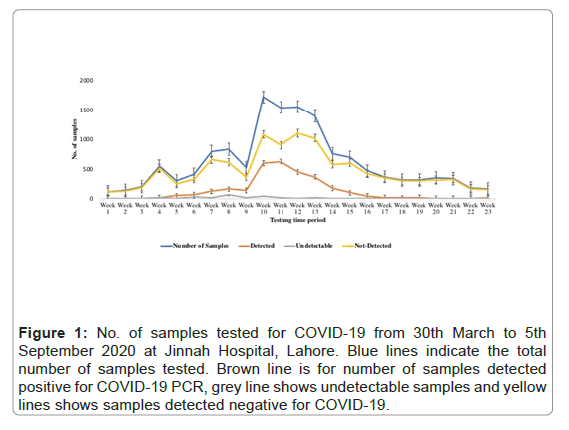
From 30th March to 5th September 2020, a total of 13680 individuals were tested for COVID 19 at Jinnah hospital, Lahore. Out of 13,680, 2,956 (22%) cases were detected positive by PCR while 10,724 (8%) cases were detected negative for COVID-19. Total number of cases tested on weakly basis during five months of study period showed a peak of cases in the month of June (week 10-13), few days after the lockdown was partially lifted in middle of May (Figure 1).
Figure 1: No. of samples tested for COVID-19 from 30th March to 5th September 2020 at Jinnah Hospital, Lahore. Blue lines indicate the total number of samples tested. Brown line is for number of samples detected positive for COVID-19 PCR, grey line shows undetectable samples and yellow lines shows samples detected negative for COVID-19.
Patient characteristics
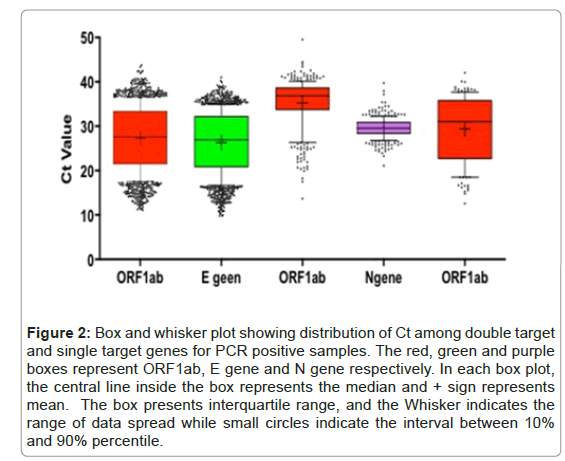
Out of 2956 cases detected positive, PCR data for 2279 cases was available while data for 677 cases could not be found. Out of 2279, 1725 (78%) cases were detected positive for ORF1ab and E gene, 348 (15%) cases were positive for ORF1ab and N gene while 141 (8%) cases were positive only for ORF1ab. The distribution of Ct values positive for ORF1ab, E and N gene showed that Ct values for ORF1ab were higher as compared to E and N gene (Figure 2). All the cases that were tested positive were symptomatic experiencing one or more symptoms like fever, sore throat, shortness of breath, cough, headache, loss of smell and loss of taste etc. The median age of the patients was 28 years (interquartile range [IQR], 26-97 years; rang, 3 months to 117 years). The proportion of males was 65% (n=1124) and female was 35% (n=601). Among both male and female, minimum number of cases were reported from the age group of 0-14 years and maximum number of positive cases were reported at the age of 25-34 years (Table 1).
| Patient Characteristics | Total N=2279 (%) | PCR Positive cases (%) | ||||||
|---|---|---|---|---|---|---|---|---|
| Double target (ORF1ab & E gene) N=1725 (78%) |
Double target (ORF1ab &N gene) N= 348 (15%) |
Single target (ORF1ab) N = 142(8%) |
||||||
| Gender Total samples | M | F | M | F | M | F | M | F |
| 1432(65) | 783(35) | 1124(78) | 601(77) | 218(15) | 130(7) | 90(6) | 52(7) | |
| Age Group | ||||||||
| 0-14 Years | 20(1) | 14(2) | 17(2) | 10(2) | 3(1) | 4(3) | 0(0) | 0(0) |
| 15-24 Years | 154(11) | 106(14) | 121(11) | 86(14) | 27(12) | 14(11) | 6(7) | 6(12) |
| 25-34 Years | 396(28) | 330(42) | 286(25) | 241(40) | 78(36) | 57(44) | 32(36) | 32(62) |
| 35-44 Years | 299(21) | 260(33) | 241(21) | 240(40) | 44(20) | 13(100 | 14916) | 7(13) |
| 45-54 Years | 228(16) | 94(12) | 175(16) | 72(12) | 33(15) | 15(120 | 20(22) | 7(13) |
| 55-65 Years | 151(11) | 68(9) | 124(11) | 46(8) | 17(8) | 13(10) | 10(11) | 9(17) |
| >65 Years | 82(6) | 58(7) | 61(5) | 51(8) | 14(6) | 3(2) | 7(8) | 4(8) |
Table 1: Characteristics of COVID-19 patients.
Figure 2: Box and whisker plot showing distribution of Ct among double target and single target genes for PCR positive samples. The red, green and purple boxes represent ORF1ab, E gene and N gene respectively. In each box plot, the central line inside the box represents the median and + sign represents mean. The box presents interquartile range, and the Whisker indicates the range of data spread while small circles indicate the interval between 10% and 90% percentile.
Viral dynamics among samples positive for double target (ORF1ab and E gene)
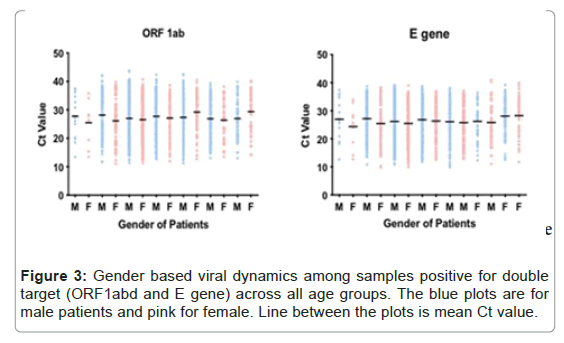
In total, 1725/2279 (78%) cases have reportable Ct for both the targets of ORF1ab and E gene. The mean, median and 95% CI of Ct for ORF1ab were all numerically higher than the comparative value of E gene (mean, 27.26 vs. 26.31; median, 27.51 vs. 26.93 and 95% CI 26.92-27.60 vs. 25.98-26.63). The difference in mean Ct value between ORF1ab and E gene was statistically significant (p-value <0.0001). In comparing male patients with female patients, the difference of mean Ct value of male patients was numerically higher than that of female patients with a statistical difference of p-value <0.02. When stratified by age, the mean Ct value for each group were statistically equivalent for both targets except one age group of 25-34 years (Figure 3). The mean of Ct value of this age group were numerically lower as compared to the samples of all other age groups for both the targets. Also, for the same age group, mean Ct value of ORF1ab was higher from E gene with a statistical difference (p-value <0.03) (Table 2).
| ORF1ab | E gene | ||||||||
|---|---|---|---|---|---|---|---|---|---|
| Groups | No. of samples | Mean | Median | 95% CI Lower-upper | p-value | Mean | Median | 95% CI Lower-upper | p-value |
| All cases | 2215 | 27.26 | 27.51 | 26.92-27.60 | <0.0001 | 26.31 | 26.93 | 25.98-26.63 | <0.001** |
| Gender | |||||||||
| Male | 1432 | 27.34 | 27.57 | 26.91-27.76 | <0.02 | 26.36 | 27.14 | 25.96-26.77 | <0.02* |
| Female | 783 | 27.12 | 27.34 | 26.54-27.69 | <0.02 | 26.2 | 26.62 | 25.66-26.74 | <0.02* |
| Age Group | |||||||||
| 0-14 Y | 27 | 26.92 | 27.75 | 23.99-29.85 | 0.5 | 26.02 | 26.15 | 23.12-28.92 | 0.5 |
| 15-24 Y | 202 | 27.34 | 27.43 | 26.31-28.38 | 0.24 | 26.46 | 26.53 | 25.48-27.45 | 0.24 |
| 25-34 Y | 611 | 26.84 | 26.69 | 26.26-27.41 | 0.03 | 25.92 | 26.08 | 25.38-26.46 | 0.03* |
| 35-44 Y | 326 | 27.53 | 28.54 | 26.76-28.31 | 0.08 | 26.66 | 28.08 | 25.95-27.38 | 0.08 |
| 45-54 Y | 245 | 27.9 | 28.73 | 27.00-28.81 | 0.05 | 26.68 | 27.69 | 25.82-27.54 | 0.05 |
| 55-64 Y | 167 | 26.76 | 27.16 | 25.72-27.80 | 0.24 | 25.89 | 26.83 | 24.90-26.89 | 0.24 |
| >65 Y | 111 | 28.08 | 28.94 | 26.80-29.36 | 0.23 | 26.95 | 27.41 | 25.67-28.22 | 0.23 |
Table 2: Distribution of Ct value among COVID-19 positive samples positive for ORF1abd and E gene.
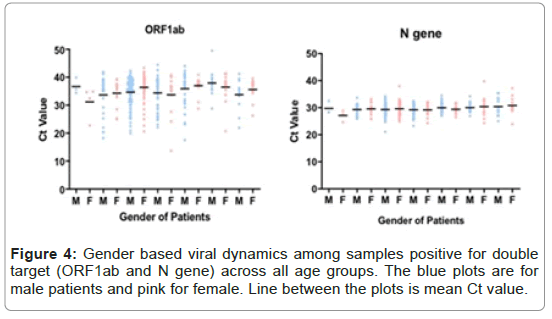
In total 348/2215 (15%) samples were detected positive for ORF1ab and N gene. The mean Ct value for all cases was numerically higher for ORF1ab as compared to respective Ct values of N gene. The mean, median and 95% CI of Ct for ORF1ab were all numerically higher than the comparative value of N gene (mean, 35.22 vs. 29.58; median, 36.86 vs. 29.55 and 95% CI 34.65-35.0 vs. 29.33-29.82). The difference in mean Ct value of ORF1abd and N gene was statistically significant (p-value <0.0001). When stratified by age and gender, the difference in mean Ct value of ORF1ab and N genes was statistically significant for both male and female patients and among all age groups (Figure 4 and Table 3).
| ORF1ab | N-Gene | ||||||||
|---|---|---|---|---|---|---|---|---|---|
| Groups | No. of samples | Mean | Median | 95% CI Lower-upper | p-value | Mean | Median | 95% CI Lower-upper | p-value |
| All cases | 348 | 35.22 | 36.86 | 34.65-35.0 | <0.0001 | 29.58 | 29.55 | 29.33-29.82 | <0.0001 |
| Gender | |||||||||
| Male | 218 | 34.89 | 36.37 | 34.13-35.65 | <0.0001 | 29.51 | 20.49 | 29.22-29.80 | <0.0001 |
| Female | 130 | 35.76 | 37.15 | 34.89-36.62 | <0.0001 | 29.66 | 29.65 | 29.22-30.10 | <0.0001 |
| Age Group | |||||||||
| 0-14 Y | 7 | 33.56 | 34.67 | 28.67-38.44 | 0.02 | 28.22 | 28.26 | 26.07-30.38 | 0.02 |
| 15-24 Y | 41 | 33.91 | 36.09 | 31.94-35.87 | <0.0001 | 29.41 | 29.64 | 28.80-30.03 | <0.0001 |
| 25-34 Y | 136 | 35.4 | 36.68 | 34.56-36.23 | <0.0001 | 29.43 | 29.34 | 29.05-29.81 | <0.0001 |
| 35-44 Y | 58 | 34.26 | 36.52 | 32.58-35.94 | <0.0001 | 29.2 | 29.69 | 29.64-29.77 | <0.0001 |
| 45-54 Y | 48 | 36.25 | 37.85 | 34.68-37.62 | <0.001 | 29.81 | 29.6 | 29.33-30.30 | <0.001 |
| 55-64 Y | 30 | 37.3 | 37.82 | 35.51- 39.09 | <0.0001 | 30.19 | 29.82 | 29.12-31.25 | <0.0001 |
| >65 Y | 28 | 34.66 | 35.31 | 32.86-36.46 | <0.0001 | 30.58 | 30.35 | 29.37-31.80 | <0.0001 |
Table 3: Distribution of Ct value among COVID-19 positive samples positive for ORF1ab and N gene.
Viral dynamics of samples positive for single target of ORF1ab
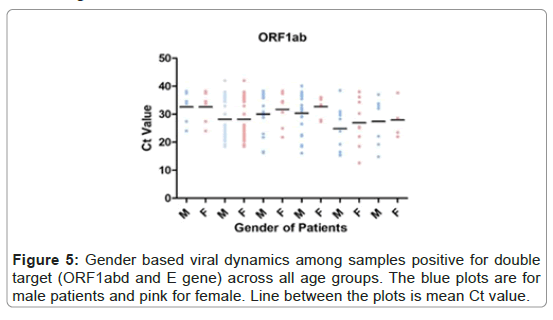
Out of 2215, 141 (8%) samples had a reportable Ct value for single target of ORF1ab. In general the mean Ct value of male patients was numerically lower than that of female patients (mean, 28.85 vs. 30.38; median, 30.13 vs. 33.19; 95%CI 27.26-30.44 vs. 28.45-32.30). However, this difference in mean Ct value was not statistically different (p-value 0.26), (Figure 5).
Correlation of viral load (Ct value) with age
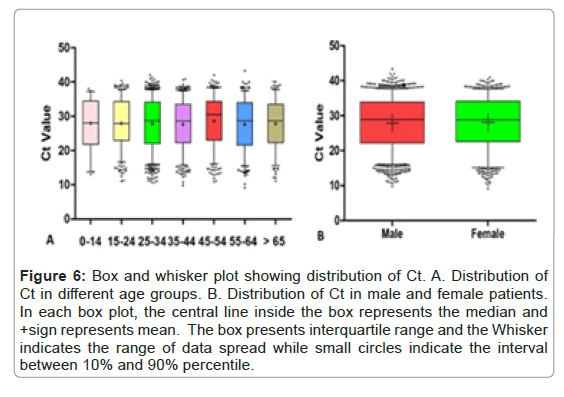
Spearman correlational analysis was performed to see the correlation of Ct value with different age groups among male and female patients. Pearson correlation coefficient factor R with p-value was calculated. No significant correlation of Ct value of ORF1ab was observed with the patients of any age group across both genders (Figure 6 and Table 4).
| Age Group | Male | Female | ||||
|---|---|---|---|---|---|---|
| N | R | p-value | N | R | p-value | |
| 0-14 Y | 20 | 0.14 | 0.556 | 14 | -0.398 | 0.158 |
| 15-24 Y | 154 | -0.131 | 0.105 | 106 | 0.0465 | 0.631 |
| 25-34 Y | 495 | -0.024 | 0.594 | 300 | -0.003 | 0.95 |
| 35-44 Y | 293 | -0.015 | 0.798 | 113 | 0.0796 | 0.401 |
| 45-54 Y | 228 | 0.0416 | 0.531 | 93 | -0.0579 | 0.581 |
| 55-64 Y | 150 | 0.023 | 0.779 | 68 | 0.0456 | 0.711 |
| >65 Y | 83 | -0.089 | 0.423 | 68 | -0.0541 | 0.663 |
Table 4: Pearson’s correlational analysis of different age groups across male and female patients.
Figure 6: Box and whisker plot showing distribution of Ct. A. Distribution of Ct in different age groups. B. Distribution of Ct in male and female patients. In each box plot, the central line inside the box represents the median and +sign represents mean. The box presents interquartile range and the Whisker indicates the range of data spread while small circles indicate the interval between 10% and 90% percentile.
Quantification of viral load for prediction of disease severity
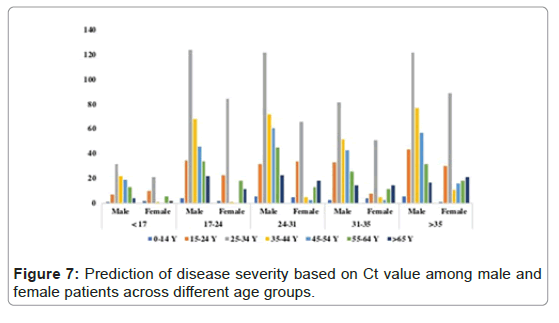
Viral load quantification was performed by using standard curve equation derived from the serial dilution of the known concentration of the RNA and the Ct value of ORF1b. Non parametric t-test was performed to see the difference in viral load of different age group between male and female patients. In total, among male and female patients there was no statistical difference in the viral load or density. When comparing different age groups, viral load at the age of 45-55 years and >65 years was quantitatively higher in female as compared to female patients with a significant statistical difference of p-value 0.0399 and 0.0328 respectively, (Figure 7 and Table 5).
| Male | Female | |||||||||
|---|---|---|---|---|---|---|---|---|---|---|
| Groups | Total | N | Mean | Median | 95% CI Lower-upper | N | Mean | Median | 95% CI Lower-upper | p-value |
| 0-14 Y | 34 | 20 | 1.46 | 1.464 | 1.439-1.482 | 14 | 1.449 | 1.456 | 1.423-1.475 | 0.4571 |
| 15-24 Y | 260 | 154 | 1.461 | 1.474 | 1.454-1.468 | 106 | 1.452 | 1.461. | 1.443-1.461 | 0.1863 |
| 25-34 Y | 809 | 496 | 1.45 | 1.456 | 1.445-1.455 | 313 | 1.457 | 1.459 | 1.452-1.462 | 0.1997 |
| 35-44 Y | 404 | 293 | 1.459 | 1.468 | 1.454-1.464 | 111 | 1.544 | 1.459 | 1.446-1.462 | 0.2637 |
| 45-54 Y | 321 | 228 | 1.459 | 1.467 | 1.453-1.465 | 93 | 1.47 | 1.48 | 1.462-1.479 | 0.0399 |
| 55-64 Y | 218 | 150 | 1.453 | 1.46 | 1.446-1.461 | 68 | 1.455 | 1.462 | 1.446-1.461 | 0.7274 |
| >65 Y | 151 | 83 | 1.455 | 1.461 | 1.446-1.464 | 68 | 1.469 | 1.477 | 1.439-1.482 | 0.0328 |
Table 5: Difference in viral load (log 10 copy number) between male and female across different age groups.
Discussion
Real Time (RT-PCR) assays have been recommended by WHO for screening and diagnosis of COVID-19 infection. Four structural proteins are encoded by SARS-CoV-2 genome [14]. In majority of commercial RT-PCR assays, N and E genes are for the amplification in combination of the Open Reading Frame 1 (ORF1) ab, and the RNA-Dependent RNA Polymerase (RdRP) gene [15]. The diagnosis of COVID-19 based RT-PCR methods is classified as positive or negative based on the Cycle Threshold (Ct) value which in indirect quantification of the viral load [16].
Viral dynamics in infected or symptomatic patients are yet to be fully understand. Relationship of viral load with age and gender can provide useful insight of disease progression and severity. In this study, we have analyzed the dynamics of viral load in patients with COVID-19 among male and female patients across different age groups based on the Ct values obtained from RT-PCR. This study was performed in the peak season from March to September, 2020. Our data shows the Ct value of ORF1ab, in general, was higher in male patients as compared to female patients. Comparing the Ct distribution of ORF1ab and E gene, there was no significant difference in mean Ct values at any age group in both the genders except the patients at the age of 45-54 years (p-value 0.05), with higher Ct value in male patients as compared to female patients. As the Ct value is inversely proportional to the viral load, thus in female patients, viral load was higher at the age of 45-54 years. But, if we compare the difference of ORF1ab and N gene, interestingly, we found a significant difference among male and female patients across all age groups (Table 3). Thus it can be concluded that COVID-19 patients responded differently to E and N genes. This need to be investigated further for clear description or reason behind the difference.
We also tried to observe a correlation b/w Ct value and age using spearman correlation 24% (183/and found no significant correlation between Ct value and age or gender) (Table 4). Based on categorization of the disease severity of the infection, we observed that in male patients, 31% of the patients (431/1401) had a reportable Ct values below 24 suggesting high viral load and 58% of which belong to the age group of 25-34 years. Similarly, in female patients, 24% (183/611) had a reportable Ct value below 24. In total, 794 cases (39%) had more sever disease with high viral load as compared to other patients at the age of 24-35 years (Figure 7).
Conclusion
This is the first preliminary study on the data from Pakistani population to see the viral dynamics among male and female COVID-19 patients of different age groups. We observed that more men (65%) were infected as compared to female. Also, the viral load or disease was more severe in male patients (36% vs. 24%) than female patients at the reproductive age group of 25-34 years. This imbalance of gender and age distribution in COVID-19 need to be investigate in detail and should be considered while making policy strategies.
Limitations of the Study
This study has several limitations. Firstly, the clinical data of the patients was not available in a comprehensive format due to urgency of testing and screening a larger population with limited resources. Secondly, there was incomplete information regarding onset of symptoms to specimen collection and diagnosis therefore our conclusions may not be applicable to asymptomatic patients or patients with short term symptoms. Thus, it is suggested that test results should be interpreted in the light of clinical symptoms and other laboratory tests. More clinical and basic research is needed to better understand the epidemiology of the disease.
Acknowledgment
Conflict of Interest
None
Funding
This study received no formal funding for data acquisition and interpretation.
Autor Contribution
Conceptualization: AK, FA, HA
Dafta Curaftfion: AK, FA, HA, ST, SJ, SS
Formafl Anaflysfis: AK, HA, SS
Invesftfigaftfion: AK, FA, HA, ST, SJ, SS
Methodology: AK, FA, HA, ST, SJ
Project Administration: AK, FA, HA, ST, SJ
Resources: AK, FA, HA, ST, SJ
Supervision: AK, FA
Validation: AK, FA
Visualization: AK, FA
Wrfiftfing-orfigfinafl draft: AK, FA, HA, SS
Writing review and editing: AK, FA
References
- Jin J, Bai P, Wei He, Fei Wu, Liu X, et al. (2020) Gender differences in patients with covid-19: Focus on severity and mortality. From Publ Heal 8: 152.
- Zhu N, Zhang D, Wang W, Li X, Yang B et al. (2020) A novel coronavirus from patients with pneumonia in China, 2019. N Engl J Med 382: 727-733.
- Buchan BW, Hoff JS, Gmehlin CG, Perez A, Faron AL, et al. (2020) Distribution of SARS-CoV-2 PCR cycle threshold values provide practical insight into overall and target-specific sensitivity among symptomatic patients. Am J Clin Pathol 154: 479-485.
- Health NIO (2020) Confirmed cases of corona virus in pakistan.
- Xia X, Wu J, Liu H, Xia H, Jia B, at al. (2020) Epidemiological and initial clinical characteristics of patients with family aggregation of COVID-19. J Clin Virol 127: 104360.
- He X, Lau EHY, Wu P, Deng X, Wang J, et al. (2020) Temporal dynamics in viral shedding and transmissibility of COVID-19. Nat Med 26: 672-675.
- Yuan C, Zhu H ,Yang Y, Cai X, Xiang F, et al. (2020) Viral loads in throat and anal swabs in children infected with SARS-CoV-2. Emerg Microbes Infect 9: 1233-1237.
- Rao SN, Manissero D, Steele VR, Pareja J (2020) A systematic review of the clinical utility of cycle threshold values in the context of COVID-19. Infect Dis Ther 9: 573-586.
- Zheng S, Fan J, Yu F, Feng B, Lou B, et al. (2020) Viral load dynamics and disease severity in patients infected with SARS-CoV-2 in Zhejiang province, China, January-March 2020: retrospective cohort study. BMJ 369: m1443.
- Sobotka T, Brzozowska Z, Muttarak R, Zeman K, Lego VD (2020) Age, gender and COVID-19 infections. Med Rxiv 24: 20111765.
- Alkhouli M, Nanjundappa A, Annie F, Bates MC, Bhatt DL (2020) Sex differences in case fatality rate of COVID-19: Insights from a multinational registry. Mayo Clin Proc 95: 1613-1620.
- CDC. (2020) Interim Guidelines for Collecting, Handling, and Testing Clinical Specimens from Persons for Coronavirus Disease 2019 (COVID-19).
- National Institute of Health (2020) Protocol for Nasophrangeal swab smaples for COVID-19.
- Chan JF, Kok K, Zhu Z, Chu H, Kai-Wang K, et al. (2020) Genomic characterization of the 2019 novel human-pathogenic coronavirus isolated from a patient with atypical pneumonia after visiting Wuhan. Emerg Microbes Infect 28: 221-236.
- Chang MC, Hur J, Park D (2020) Interpreting the COVID-19 test results: A guide for physiatrists. Am J Phys Med Rehabil 99: 583-585.
- Kawase J, Asakura H, Kurosaki M, Oshiro H, Etoh Y, et al. (2018) Rapid and accurate diagnosis based on real-time PCR cycle threshold value for the identification of campylobacter jejuni, asta gene-positive escherichia coli, and eae gene-positive E. coli. Jpn J Infect Dis 71: 79-84.
Citation: Khaliq A, Ashraf F, Tahir S, Javed S, Shahid S, et al. (2021) Viral Dynamics and Ct Value Distribution with Age and Gender of COVID-19 Patients in a Tertiary Care Hospital Lahore, Pakistan. Epidemiol Sci 11: 403.
Copyright: © 2021 Khaliq A, et al. This is an open-access article distributed under the terms of the Creative Commons Attribution License, which permits unrestricted use, distribution, and reproduction in any medium, provided the original author and source are credited.
Select your language of interest to view the total content in your interested language
Share This Article
Recommended Journals
Open Access Journals
Article Usage
- Total views: 2831
- [From(publication date): 0-2021 - Dec 10, 2025]
- Breakdown by view type
- HTML page views: 1990
- PDF downloads: 841

