Special Issue Article Open Access
Removal of Nitrogen, Phosphorus and Prodiamine from a Container Nursery by a Subsurface Flow Constructed Wetland
| G. Kim Stearman*, Dennis B. George and Lisa D. Hutchings | |
| Center for the Management, Utilization and Protection of Water Resources, Tennessee Technological University, USA | |
| Corresponding Author : | G. Kim Stearman Center for the Management Utilization and Protection of Water Resources Tennessee Technological University, Cookeville, TN 38505, USA Tel: 931-372-3528 Fax: 931-372-6346 E-mail: gkstearman@tntech.edu |
| Received March 24, 2012; Accepted May 07, 2012; Published May 09, 2012 | |
| Citation: Stearman GK, George DB, Hutchings LD (2012) Removal of Nitrogen, Phosphorus and Prodiamine from a Container Nursery by a Subsurface Flow Constructed Wetland. J Bioremed Biodegrad S7:002. doi: 10.4172/2155-6199.S7-002 | |
| Copyright: © 2012 Stearman GK, et al. This is an open-access article distributed under the terms of the Creative Commons Attribution License, which permits unrestricted use, distribution, and reproduction in any medium, provided the original author and source are credited. | |
Related article at Pubmed Pubmed  Scholar Google Scholar Google |
|
Visit for more related articles at Journal of Bioremediation & Biodegradation
Abstract
Plant nurseries apply large amounts of agricultural chemicals that may run off causing problems to surface water. Constructed wetlands have been used to treat agricultural chemical runoff. A 128 m2 gravel subsurface flow constructed wetland was designed and installed at Pirtle’s Nursery in Smithville, TN. The wetland was 46 cm deep and contained an estimated 16.5 m3 of water. Softstem bulrush (Scirpus validus), cattails (Typha latifolia L.) and juncus (Juncus spp.) were planted in the wetland. A standpipe controlled water level in the wetland, and a bypass pipe averted heavy flow. Total nitrogen (N), phosphorus (P) and the pesticide prodiamine were measured from the influent and effluent water during daily irrigation events. A valve controlled flow into the wetlands to produce computed nominal hydraulic retention times of 0.7, 1.2 and 1.9 d. A Stevens Chart Recorder measured the influent water level to develop a flow versus water stage correlation at specific valve settings. Mean N removal was 70 to 72% of total influent N. Mean P removal varied from -2 to 10% of total influent P. Mean prodiamine removal ranged from 49 to 65% of total influent prodiamine. The wetland required little maintenance other than occasional sediment removal after heavy rain and occasional sediment flushing of the inflow pipe to maintain flow.
| Keywords |
| Subsurface Flow Constructed Wetland; Nitrogen; Phosphorus; Pesticide |
| Introduction |
| Nurseries apply large amounts of agricultural chemicals to sloping terrains that are highly susceptible to soil erosion. Pesticides and fertilizers may run off into surface water and cause detrimental effects on non-target organisms. Container nurseries apply pesticides and nutrients at various times throughout the year. Overhead irrigation systems are commonly used to water the plants daily. As much as 70 to 75% of this irrigation water runs off the packed gravel beds on which the container plants rest [1,2]. This runoff may have significant concentrations of nutrients and pesticides [3-5]. Runoff of nutrients, especially N and P, from nursery sites has detrimental environmental effects on draining waterways, including eutrophication and the creation of toxic levels of nitrate. Several researchers have reported runoff of a variety of pesticides from container nurseries [6-9]. Mahnken et al. [10] showed that the herbicides simazine and metolachlor were present in runoff from container nurseries, which may cause pollution of receiving water bodies or plant damage as water is reused. Pesticide and nutrient runoff from containerized nurseries must be determined, and treatment methods to contain, reduce or eliminate these potential contaminants must be evaluated. |
| Identification and implementation of best management practices, including constructed wetlands that reduce agricultural chemicals in waterways, are essential in reducing agricultural chemical pollution of water resources. Nitrogen (N) and phosphorus (P) removal in constructed wetlands has been reported in a few studies while pesticide removal has seldom been studied in constructed wetlands [11,12]. Constructed wetlands are treatment methods used to contain and remove runoff chemicals by various processes including microbial degradation, plant uptake, sorption, chemical reactions and volatilization. Constructed wetlands, using Subsurface Flow (SF) gravel media, have recently been used to clean wastewater, primarily to remove N and P [13-18]. Tanner et al. [17] examined maturation in an SF constructed wetland. As SF gravel constructed wetlands matured, chemical removal changed, especially for phosphate where sorption was the primary means for removal. As wetland sorption sites were saturated, phosphate removal was reduced. Debing et al. [13] showed that SF gravel constructed wetlands removed more N and P when vegetated. Nitrogen and P removal were approximately 47% and 81% with planted wetlands, respectively. Chung et al. [14] showed N removal in vegetated SF constructed wetlands of 65 and 62%, at 10 and 5 d Hydraulic Retention Times (HRTs), while P removal was 67% and 52%, at 10 and 5 day HRTs, respectively. Akratos and Tsihrintzis [15] showed mean N and P removal of 65% and 60%, respectively in an SF gravel constructed wetland at 6, 8 14 and 20 HRTs. Shannon et al. [16] showed that removal of N increased the second year and removal of P decreased the second year in an SF constructed wetland system. They attributed increased N removal to increased plant density the second year in the SF constructed wetland. Decreased P removal the second year was attributed to partial saturation of the sorption sites resulting in less available sorption sites for P removal from solution. |
| Central Illinois SF wetlands that intercepted subsurface tile drainage water removed 28% of total N and 2% of total P during a 3-yr period. Results were highly variable for P removal [11]. In a study using a gravel, recirculating vertical SF system, McKinlay and Kasperek [19] concluded that microbial degradation rather than plant uptake was the dominant process for atrazine decomposition. At HRTs of 2 d SF wetland cells in middle Tennessee removed more than 60% of pesticides simazine and metolachlor from runoff of a container nursery and at HRTs of 5 d or more removed more than 80% of the pesticides [20,21]. |
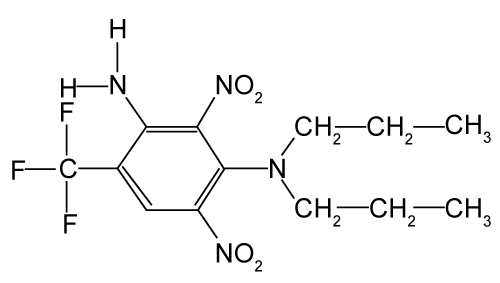
| There have been no known published studies on the herbicide prodiamine in constructed wetlands. Prodiamine is commonly used in the nursery industry and is a dinitroaniline, selective, preemergent herbicide controlling broadleaves and grasses (Figure 1). Prodiamine has a reported half-life of 69 to 120 d in nursery production systems [22]. Its primary means of removal are microbial and photodegradation [23]. |
| The objective of this study was to determine the removal of N, P and the herbicide prodiamine from irrigation runoff water at Pirtle’s Nursery through the use of a vegetated SF gravel constructed wetland. HRTs of 0.7, 1.2 and 1.9 d were studied in the wetland. |
| Materials and Methods |
| Constructed wetlands |
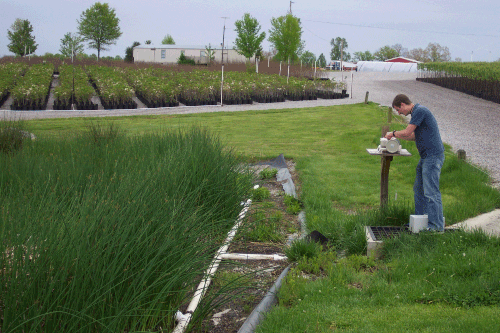
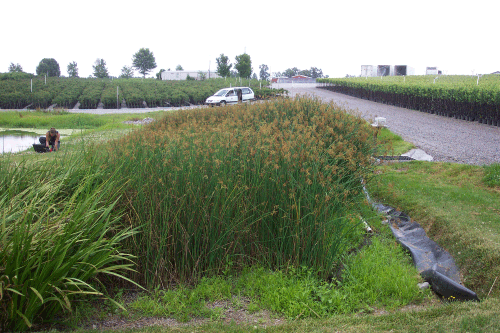
| The constructed wetland is located at Pirtle’s Nursery in Smithville, TN. Irrigation runoff water from a 1.0-ha container nursery pod flows into the wetland. The wetland is 46 cm water depth and approximately 21 m wide and 6.1 m long. The pore volume was estimated to be 16.5 m3 based on 28% porosity of the gravel wetland. The media consists of a 23 cm (9 in) depth of limestone gravel (diameter size is 2.5-5.0 cm) overlain by 23 cm (9 in) of finer gravel (diameter size is 0.63-1.88 cm). The inlet section of the wetland was filled with coarse gravel to increase initial water flow distribution to the wetlands. The wetland was planted primarily with softstem bulrush. Cattails and juncus were planted on the back edge (Figures 2,3). The SF system was constructed in the winter of 1999/2000 and has been operational since Spring 2000. |
| Sampling for N, P and Prodiamine analysis |
| Water samples were collected from May 16 through August 2, 2002. Effluent water samples were collected in a 1-L amber bottle each day prior to irrigation at 1230 h at the wetland outlet pipe. Influent water samples were collected at the concrete weir inlet box to the wetland in a 1-L amber bottle each day at 1300 h, 30 min after irrigation began. Fifty-four water samples from the influent and corresponding samples from the effluent were analyzed for N, P, and prodiamine. Water samples were transported to the Environmental Quality Laboratory at the Center for the Management, Utilization and Protection of Water Resources at Tennessee Technological University for analysis of N, P and the herbicide prodiamine according to methods presented in Standard Methods, 1998. Total N was measured using the persulfate digestion method (SM 4500-N) and analyzed on a TRAACS 800 Auto Analyzer using the cadmium reduction method [24]. Total P was digested by a mild acid hydrolysis and analyzed using the ascorbic acid colorimetric method (Murphy-Riley technique SM 4500-P) [24]. Prodiamine was extracted with isooctane and analyzed using a 6890 gas chromatograph (Agilent Technologies, Wilmington, DE) with an electron capture detector using EPA Method 505 [25]. Water influent and effluent pH was measured once a week on site with an Orion pH meter. |
| Plant removal of N and P |
| Bulrush plant density was determined by counting bulrush plants within a wooden square (0.31 m2) over a section of bulrush. This was repeated five times to determine mean bulrush density. Total bulrush plants were determined by multiplying bulrush density in the wooden square by the wetland area planted in bulrush. Bulrush plants were sampled, weighed, dried at 105°C for 16 hr, ground in a Wiley Mill, and digested and analyzed for N and P. The plant digestion for N was conducted by weighing 0.5 g of dried bulrush, transferring into a 50 mL boiling flask, adding 10 mL of digestion solution (85% methanol, 10% H2SO4 and 5% perchloric acid) and 3 mL of hydrogen peroxide. The solution was placed on a hot plate at 400°F for 90 min. The digestion solution was evaporated and 25 mL of water added and analyzed for N on a TRAACS 800 Auto Analyzer using the cadmium reduction method. Plant digestion for P was conducted by weighing 0.5 g of dried bulrush into a 50-mL boiling flask and adding 5 mL of nitric perchloric solution (87.5% HNO3, 12.5% perchloric acid). The flask was placed on a hot plate at 375°F for 80 min to evaporate the nitric perchloric solution. Twenty-five mL of water was added and P was analyzed using the ascorbic acid colorimetric method (Murphy-Riley technique SM 4500-P) [24]. |
| Flow determination |
| The valve controlling water into the wetlands was set at 75, 60 or 50% of full flow for an estimated nominal HRT of 0.7 d, 1.2 d and 1.9 d, respectively. The nursery runoff was channeled to a concrete box where the flow was split. An overflow standpipe transported the bulk of the flow beneath the wetland to the holding pond while a submerged orifice, located approximately 2.5 cm (1 in) from the bottom of the box, discharged runoff to the wetland. The water depth, or head, in the flow splitter box was measured with a Stevens Chart Recorder. Maximum head was 15.2 cm (6 in). Hydrographs obtained during runoff events were used to determine the head in the box as a function of time during the event. The following submerged orifice equation was used to estimate the flow to the wetland: |
| Where |
| Q = the discharge flow through the orifice (cfs) |
| Cd = discharge coefficient (dimensionalless) |
| Ao = orifice cross-sectional area (ft2) |
| g = acceleration of gravity (fps) |
| hi = water head (ft) at any specific time and |
| ho = water depth to the orifice centerline (ft). |
| The discharge coefficient (Cd) was determined experimentally by measuring the discharge flow at various control valve settings (Table 1). At each valve setting, the flow was measured by recording time required to fill a fixed volume container. Replication was conducted at each valve setting. |
| Irrigation began at 1230 h every day. The water level was daily recorded in the flow distribution box using a Stevens Chart Recorder. Water influent (L) was computed using the hydrograph from the Stevens Chart Recorder and the hydraulic head orifice equation. |
| Statistical analysis |
| Analysis of variance (ANOVA) was conducted to determine differences at 0.7, 1.2 or 1.9 d HRTs. Tukey’s mean separation tests were conducted on the N, P and prodiamine analysis. Linear regression analysis was conducted on N data for each HRT. All statistical analysis was conducted using the SAS software system (SAS, Cary, NC). |
| Results |
| Flow rate estimation |
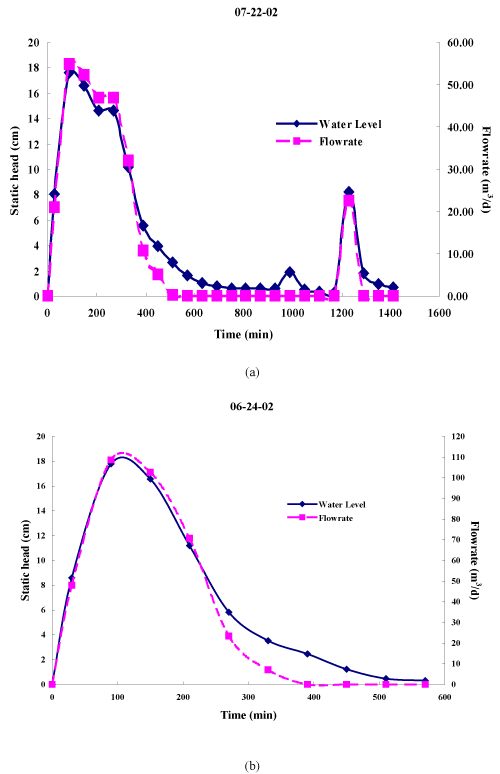
| The hydrograph of water entering the wetland was computed (Figure 4) using the water level measurements from the Stevens Chart Recorder and the discharge equation (Equation 1) for the appropriate valve opening. The hydrograph was numerically integrated to estimate the daily flow entering the wetland. Table 2 presents the average estimated daily flow rate for each valve setting during the monitoring period and corresponding estimated HRT. |
| N, P and Prodiamine removal in the constructed wetland |
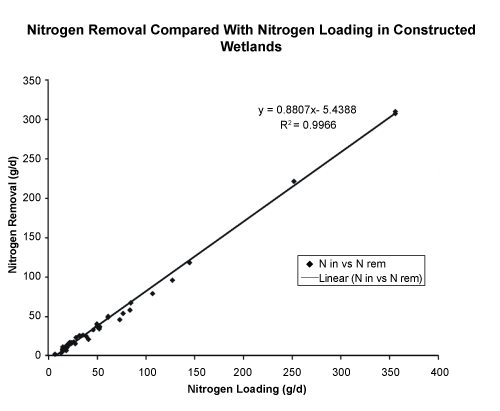
| Table 3 shows percent removal of N, P and prodiamine for 0.7, 1.2 and 1.9 d HRTs. Nitrogen concentrations entering the wetland were between 1.3 and 20 mg L-1 and declined over the duration of the study. Phosphorus concentrations entering the wetland ranged from 0.5 – 1.5 mg L-1. Prodiamine concentrations entering the wetland were 0.5 – 3.2 mg L-1. Included in Table 3 are the number of samples and the standard deviation. Nitrogen had 70 to 72% removal, and there was no statistically significant difference in N removal from 0.7, 1.2 or 1.9 d HRTs. Figure 5 shows that N removal was highly correlated with N loading rates. Mean phosphorus removal was less than or equal to 10% with a large standard deviation. The erratic nature of phosphorus removal via biological uptake and sorption was largely attributed to pH shifts in runoff water especially, due to acid rain (pH < 4.5). Normally, the pH of irrigation water runoff pH was 7.5, and the pH of the SF wetland outflow water was pH 8. During rain events, SF wetland water pH was lowered from pH 8 to between 6 and 7 and this was thought to cause phosphorus to dissolve, resulting in some negative P removal results. Chung et al. [14] showed negative values for P removal in an unplanted SF constructed wetland. Kovacic et al. [11] also reported P removal of only 2% with highly variable results in three surface constructed wetlands. Prodiamine removal varied between 48 and 65%, which was consistent with previous studies at Baxter, TN, which examined simazine and metolachlor removal using constructed wetland cells [20,21]. Results from the Baxter study showed at 2 and 3 d HRTs 60 to 65% of the pesticides simazine and metolachlor were removed. |
| The total number of bulrush plants in the wetland was computed by taking the mean of the five counts at the wetland. The mean number of bulrush plants in each 0.31 m2 removal was 142. The total number of plants in the wetland was 62,892. Dry weight per plant was 2.0 g. Percent N and P of the dry matter in the bulrush plants varied between 1.65 and 3.5% and 0.33 and 0.4%, respectively. A total of 3.25 kg N and 0.46 kg P was in the bulrush plants. Plants removed 9.0% and 12.8% of total N and P entering the wetland, respectively. It was estimated that 36 kg-N and 3.6 kg-P entered the wetland annually. |
| Discussion |
| Removal processes |
| Of the 70-72% N removed, 9% was removed by plants and the remaining primarily by nitrification/denitrification and sedimentation based on other SF gravel constructed wetlands [26,27]. Mayo and Bigambo [26] reported 48.9% N removal in a constructed wetland with 29.9% removed by denitrification, 10.2% by plant uptake and 8.2% by net sedimentation. Lee et al. [27] reported that the denitrification process may remove 60-70% of N and 20-30% may be removed by plant uptake in SF constructed wetlands. In our study the 1.9 d HRT may have limited the denitrification process. There is also the possibility that there was short-circuiting in the wetland, and some of the influent N was measured in the outlet. Other researchers have reported short-circuiting and ineffective spreading of the influent water as it passes through the wetland. In some instances, water will remain in backwater locations for more time than the theoretical detention time, and other times it will flow faster through the wetland than the HRT [28]. P was removed primarily by adsorption/precipitation reactions [29,30]. P effluent values varied widely due to pH shifts in the wetland, especially during and after rain events. Prodiamine was removed both by microbial degradation and sorption as reported by other researchers [22]. |
| Conclusion |
| SF constructed wetlands are a promising technology for removal of N and pesticides from container nursery runoff. Mean N removal was 70-72% with a standard deviation of plus or minus 10% at HRTs of 0.7, 1.2 and 1.9 d. P removal was more problematic due to finite wetland gravel sorption sites and variation in runoff pH water due to acid rain. Mean P removal in this study was -2 to 10% and was erratic due to pH shifts causing P to become water soluble. Prodiamine removal was 49-65%. More research is needed to examine and implement efficient P-removal technologies that could be used with constructed wetlands. |
| Acknowledgements |
| Support of this project was provided by the Tennessee Department of Agriculture 319 Program through EPA and by the University of Tennessee Water Resources Research Institute, Knoxville, TN, through the USGS. Support was also obtained from the Center for the Management, Utilization and Protection of Water Resources, Tennessee Technological University, Cookeville, TN. |
References
|
Tables and Figures at a glance
| Table 1 | Table 2 | Table 3 |
Figures at a glance
 |
 |
 |
 |
 |
| Figure 1 | Figure 2 | Figure 3 | Figure 4 | Figure 5 |
Relevant Topics
- Anaerobic Biodegradation
- Biodegradable Balloons
- Biodegradable Confetti
- Biodegradable Diapers
- Biodegradable Plastics
- Biodegradable Sunscreen
- Biodegradation
- Bioremediation Bacteria
- Bioremediation Oil Spills
- Bioremediation Plants
- Bioremediation Products
- Ex Situ Bioremediation
- Heavy Metal Bioremediation
- In Situ Bioremediation
- Mycoremediation
- Non Biodegradable
- Phytoremediation
- Sewage Water Treatment
- Soil Bioremediation
- Types of Upwelling
- Waste Degredation
- Xenobiotics
Recommended Journals
Article Tools
Article Usage
- Total views: 14494
- [From(publication date):
specialissue-2013 - Nov 29, 2025] - Breakdown by view type
- HTML page views : 9797
- PDF downloads : 4697
