Application of Isotopes and Recharge Analysis in Investigating Surface Water and Groundwater in Fractured Aquifer under Influence of Climate Variability
Received: 06-Jun-2013 / Accepted Date: 20-Jul-2013 / Published Date: 25-Jul-2013 DOI: 10.4172/2157-7617.1000148
Abstract
The impact of Climate variability on water resources (surface and ground) was conducted to assess the effect of meteorological forcing on isotopic and recharge characteristics of the granitic and fractured aquifer, located in Pallisa District (Kyoga basin), eastern Uganda. The paper investigated the application of environmental isotopes and using the EARTH Model in determining the groundwater levels response to rainfall of the fractured aquifer. The granitic fractured aquifer is characterized by shallow to deep water table conditions that vary between 5-50 meters below ground level and quick groundwater level response to rainfall events which justified the application of the EARTH model to demonstrate the groundwater level fluctuations of the single monitoring Well-002. Groundwater fluctuations from the observed hydrograph at the monitoring station vary between 8.8 and 13.48 mamsl with an average hydrostatic fluctuation of 11.42 mamsl. Oxygen-18 (δ18O) and deuterium (δ2H) compositions mostly plot below the Local Meteoric Water Line (LMWL) indicating that the surface water and groundwater in the aquifer was exposed to evaporation before or in the recharging process. In the study, groundwater levels response to rainfall events by the EARTH method is the quantitative estimation of groundwater recharge for Pallisa District watershed. Generally, the study findings suggest that applications of precipitation isotopic rainfall data for light and heavy mean monthly rainfall (mean rainfall of 138 mm) and the EARTH model to assess groundwater recharge can improve the understanding of the process under climate variability.
Keywords: Climate variability; Isotopes; Rainfall recharge; Earth model; Groundwater level fluctuation; Fractured aquifer; Pallisa district; Eastern Uganda
10262Introduction
Water resources the world over are subject to change due to meteorological and climatological impact all the year around. Impact of these factors on water resources has been widely studied [1-4]. Increased temperature, demand for human and animal drinking water, industrial activities, limited rainfall on one hand (drought), too much rainfall on the other (floods) and groundwater recharge requires more water resource development and planning activities. Dealing with variations of groundwater resources in relation to effect of rainfall and temperature on water table fluctuations is an important factor which plays a media role in sustainable groundwater development. Physical relationships between meteorological factors, unsaturated and saturated zones of phreatic ground water resources, as is the case in the region's conditions, is cited elsewhere [5]. The long term historical and meteorological data, among all, temperature and rainfall can be used to assess the future surface water, groundwater table and storage variations in order to have a better insight into the problem posed in the future. In general, if the statistical parameters such as mean and variance of a long term meteorological time series changes steadily, it can be said that the climate change is inevitable, so using these historical times series and their effects on water resources, mainly ground water, may have a similar future impact. Analysis of time series as related to groundwater table seeks two objectives; modeling of random variables to have an understanding of historical data and forecasting future data behavior based on the past data [6]. We should understand the significant statistical characteristics between meteorological data and those of say groundwater table variations separating
On the other hand, the presence of 18O and or 2H in tracing the origin of water in the hydrological cycle are important as they are constituents in the water molecules and so the introduction of isotopes artificially. The environmental isotope tracers and/or chemical substances (in combination with conventional hydrological methods) are intentionally released in order to obtain additional information about the investigated systems. An ideal tracer is defined as a substance that behaves in the studied system exactly as the material to be traced as far as the sought parameters are concerned, but at least has one property that distinguishes it from the traced material [7]. As an example they are used in determining the origin of water, storage properties, water dynamics or relation between surface and groundwater, migration of water travel times and groundwater pollution [8].Isotopic data can quantitatively be interpreted with mathematical models. The isotopic abundance is generally reported as the deviation of the isotopic ratio of the given sample relative to that of the standard, for example (O) defined as follows [9,10]: Most freshwaters have negative values permillage (‰) tracers. Moisture recycling by evaporation causes differential enrichment in 2H and 18O causing water to deviate from the GMWL equation.
Interaction between surface water and groundwater can be traced using the stable isotopes of water because water that remains at the surface for any length of time is usually subjected to evaporation and is consequently enriched in 2H and 18O relative to groundwater. The stable isotopes of the water molecule can be useful for distinguishing the sources of surface water following a storm. According to Aggarwal [8], the potential sources include groundwater, overland flow, through flow, groundwater recharge and may characterise isotopic signatures depending on the altitude where recharge occurred.
However, two studies employing stable isotope tracers within the monsoon belt of which Uganda falls [11] demonstrated that the enrichment in the heavy isotopes of water through evaporation exhibited by surface water could not be detected in the groundwater system. Recharge was, therefore, considered neither to have been derived from surface water bodies nor to have undergone significant evaporation prior to infiltration. The timing of recharge has been found to correspond with the heaviest rainfalls of the monsoons when the rates of incoming precipitation temporarily exceed the intense evapotranspirative flux found over much equatorial Uganda [12].
Study Area Setting
Pallisa District within the Kyoga Basin is the area under investigation and is located in the eastern part of Uganda. It has approximately 1 585 km2 in area, Figure 1. The topography slopes gently from east to west with land surface elevations from 1200 mamsl in the eastern part to near 1 000 mamsl in the south-western part. Most of the land is used in small scale agricultural farming while wetlands, woodland, bush land, grassland, deciduous plantations and urban areas represent about 30% of the land surface. The average temperatures range between 20 -30°C, with minor daily temperature variations. Mean annual minimum temperature is 18°C and the mean annual maximum temperature is 32°C. The weather conditions are characterised with bi -modal rainfall system controlled by the Inter -Tropical Convergence Zones (ITCZ) [13]. The mean annual precipitation is about 1 250 mm/year. The geology of the area consists of a gneissic complex formation. Gneiss and granitic formations of the Pre -Cambrian predominates, which are usually referred to as gneiss complex.
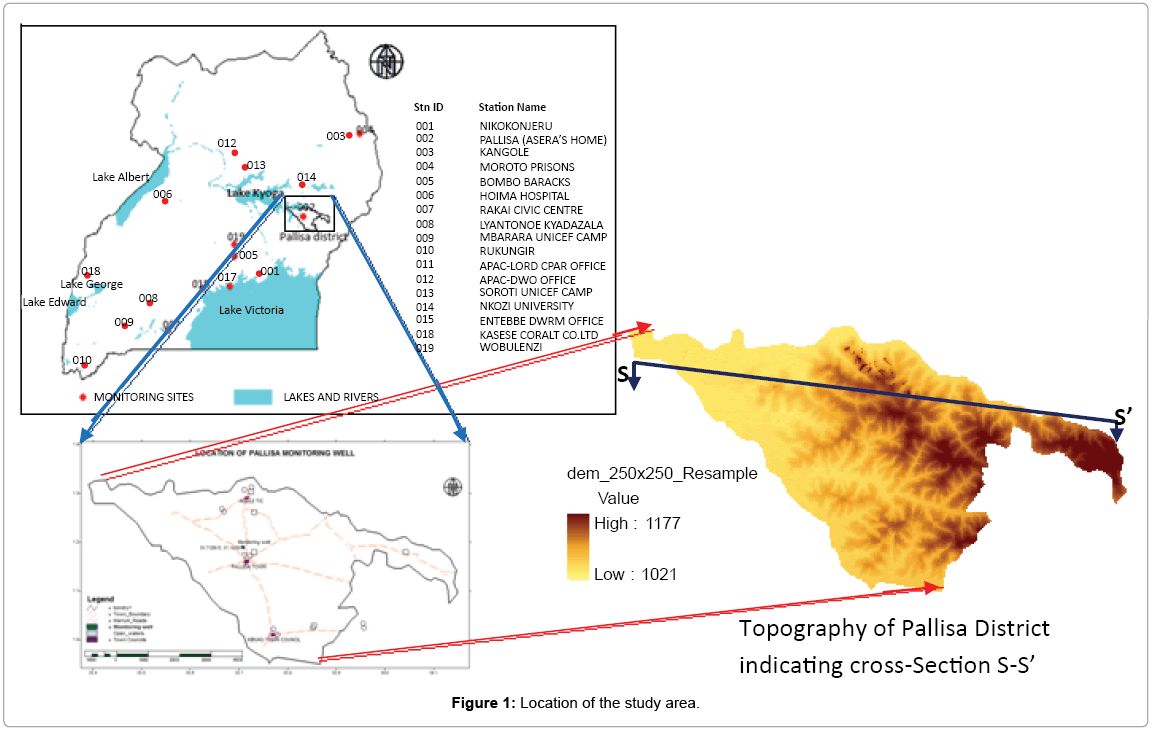
Figure 1: Location of the study area.
There are indications that some sediment, alluvium, black soils and moraines exist in the swampy valleys, with undifferentiated gneisses including elements of partly granitised and metamorphosed formations. At varying depths, however, the weathered unit is found on top of the fractured bedrock that acts as a fractured aquifer system with the dense granite as an impermeable flow (Figure 2). Figure 1 shows the location map of the groundwater monitoring well. The individual long -term monitoring Well-002 has provided valuable information about water -level trend within the location. Figure 3 shows the monthly rainfall data and monthly groundwater levels monitored between August 1998 and August 2010.
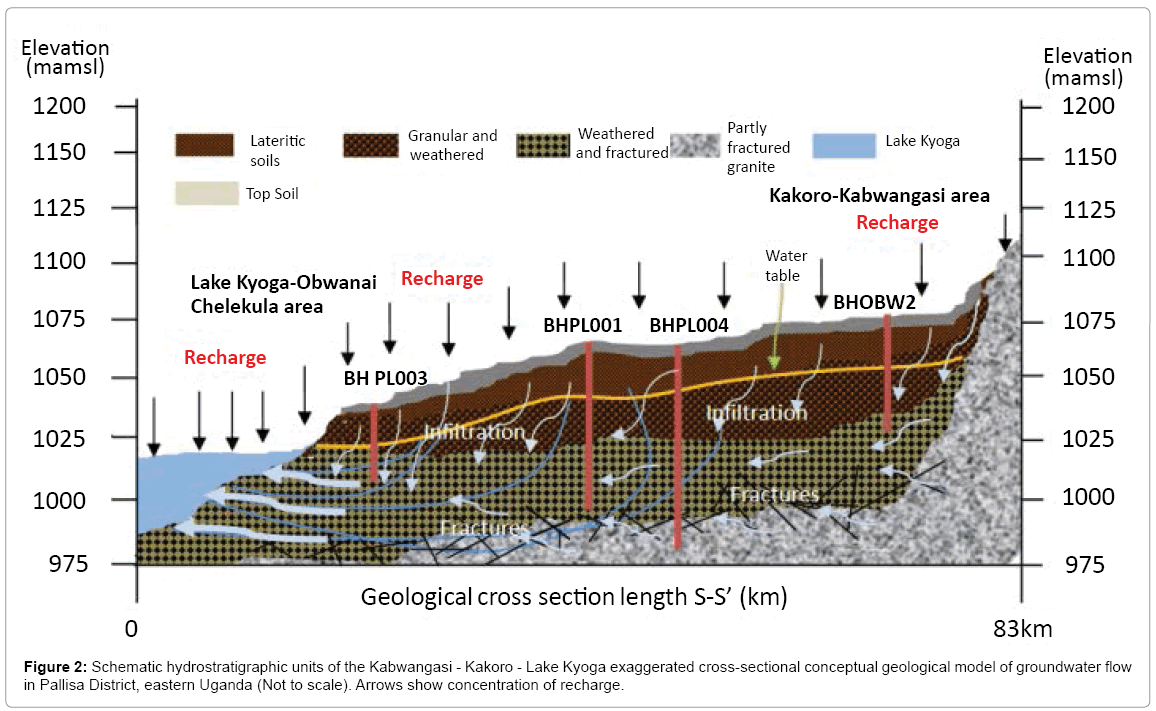
Figure 2: Schematic hydrostratigraphic units of the Kabwangasi - Kakoro - Lake Kyoga exaggerated cross-sectional conceptual geological model of groundwater flow in Pallisa District, eastern Uganda (Not to scale). Arrows show concentration of recharge.
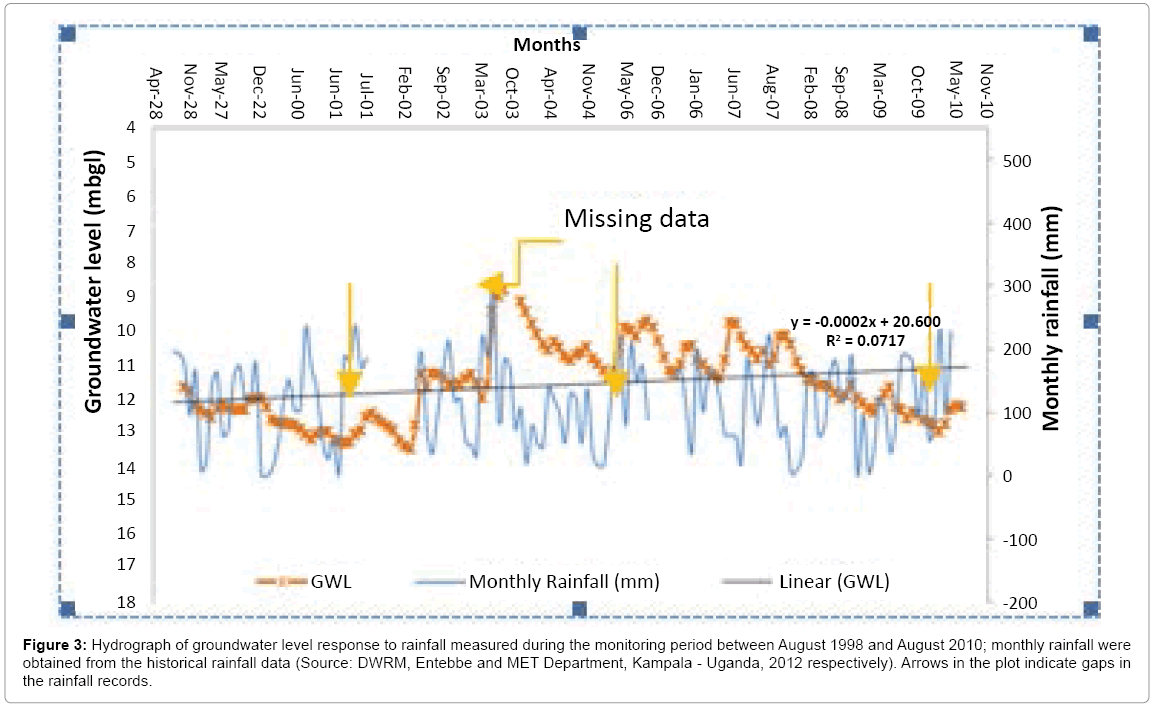
Figure 3: Hydrograph of groundwater level response to rainfall measured during the monitoring period between August 1998 and August 2010; monthly rainfall were obtained from the historical rainfall data (Source: DWRM, Entebbe and MET Department, Kampala - Uganda, 2012 respectively). Arrows in the plot indicate gaps in the rainfall records.
Groundwater level records are very important parameter since they could be used to calculate the change in groundwater storage. However, groundwater observation networks have not yet been established in the study area, except the long term measured data of groundwater levels that have been observed through a monitoring well located at the outskirts of Pallisa Town (at Mrs. Asiire’s home) (Figure 1). This monitoring well is located at grid 33.71236°E, 01.18260°N and at an altitude of UTM 0579080E, 0131067N and surface level of approximately 1045 mamsl. The area is located at the slope of the hill with a swampy valley below the outskirts of Pallisa town 17 km away north towards Agule Trading Centre (T/C).
The duration of the recharging process is shown by the abrupt rise of water levels whenever it rains. During the recharging process, there is great potential for infiltration fronts from different rainfall.
There is a noticeable reduction in recharge with reduced precipitation (Figure 3).
Methodology
Environmental isotopes
Samples of stable isotope determination were taken in 100 ml HDPE screw cap bottles and sealed tightly to prevent evaporation. Sample analyses were performed on rain water, groundwater and surface waters from Pallisa and compared to that of Entebbe. Groundwater samples were collected from 70 water points (boreholes, regolith piezometers) across the study area. Surface water was sampled at 11 sites and 45 samples of rainfall were collected during the 28 rainfall events. Rainfall determinations augmented the historical records of isotopic content in rainfall at IAEA (International Atomic Energy Agency) station in Entebbe. All the samples were analysed with respect to the Vienna – SMOW [14]. 2H was determined by the zinc reduction [15] whereas 18O was measured by CO2 equilibration [16] and measured using a gas source mass -spectrometer (Model: MAT 253). The analytical error in each determination is ± 2‰ for 2H and ± 0.2‰ for 18O. Details of the calculations are provided for in equation 1.
 (1)
(1)
where T(Sample) and T(Standard) stands for the isotopic ratio of heavy to light in 2T = (2H/1H) and 18T = (18O/16O) of the sample and the reference material (standard -SMOW), respectively.
The earth model
General outline and application of the EARTH model: The EARTH (Extended Model for Aquifer Recharge and Soil Moisture Transport Through the Unsaturated Hard-Rock) is a lumped parameter hydrologic model that utilises a numerical or analytical relationship for the simulation of recharge and groundwater fluctuations and so it identifies these parameter sets that give the best fit to the observed data. Van der Lee et al. [17] developed the model for use in the Groundwater Recharge Evaluation Study while Gieske [18] simulated water level in wells. The EARTH model was applied in Recharge of the aquifer and Fluctuations of the groundwater table scenarios to assess the model water balance in a semi-arid climate successfully for a single borehole.
Model parameterisation: The lumped parameter model is based on combinations of direct methods and indirect methods. The first three modules, MAXIL, SOMOS and LINRES, are the direct part of the model, calibrated with the measured time series of soil moisture. The SUST model calculates the surface runoff (Figure 4).
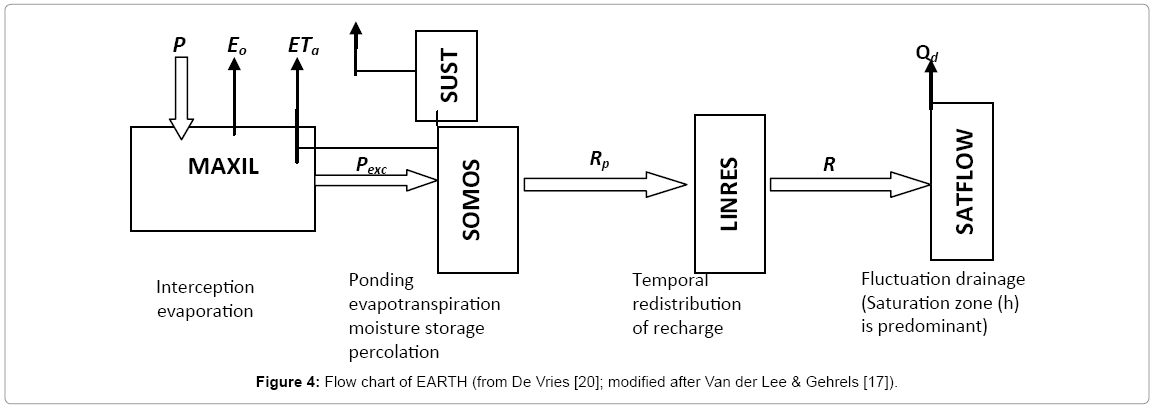
Where:
• P = Gross precipitation; Eo = interception loss; ETa = Actual Evapotranspiration; Pexc = Precipitation excess; Rp = Percolation; R = Groundwater recharge; Qd = Groundwater discharge; h = groundwater level; Qs = Soil moisture.
1. MAXIL (Maximum Interception Loss Module): Estimates surface retention (water remaining at the surface)
2. SOMOS (Soil Moisture Storage Module): Calculates the mass balance between actual evaporation, percolation, ponding and or runoff from the infiltrating water (Pe). The remaining part is the change in soil moisture
3. SUST (Surface Storage): Calculates the ponding and runoff. SUSTmax [L]is the maximum capacity or the amount of ponding that can be stored at the surface. If the amount of ponding in the reserviour is greater than SUSTmax, then runoff, Qs [LT-1] occurs
4. LINRES (Linear Reserviour Routing Module):Redistributes percolation in time for the unsaturated hard rock or soil beneath the root zone using the parametric transfer function
5. SATFLOW module can be used as a simple independent one dimensional parametric model using inputs from previous modules and forms the lower -boundary of the model and models groundwater table fluctuations. SATFLOW is the indirect part of the model and calculates the ground level with the estimated recharge of the direct part.
The general mathematical explanation of the EARTH model [19] for groundwater level fluctuations as proposed by De Vries [20] can be described as follows:
 (2)
(2)
Where:
• δh/dt is the change in water level head during one month (m/ month)
• h is groundwater level (m)
• DR is the drainage resistance (a lumped, site -specific parameter)
• R is the recharge (m3/month)
• S is the Specific yield.
Equation 2 is a linear transfer function that can be solved numerically. However, in applying equation 2 to saturated flow, results in equation 3 that is expressed as:
 (3)
(3)
Therefore, combining the different modules described above leads to a lumped, parametric, hydrological model where the parameters have a semi -physical meaning.
EARTH model calibration: The objective of model calibration was to minimize the deviation and obtain the best fit between measured and simulated variables. Calibration of a model helped to evaluate the performance of the model and established whether the model was acceptable as an image of reality or not. In the present study, Observed Groundwater Levels (OGWL) was used to calibrate EARTH models. EARTH models were calibrated by trial and error procedures of adjusting model parameters manually. Comparison of groundwater levels was made over the modeling time span for both models. The other parameters were not calibrated, but a priori set at fixed value. However, the values for the saturated recession coefficient and specific storage were only slightly adjusted to match the in situ measures of groundwater levels with the simulated values.
Calibration result evaluation: The model calibration resulted in minimizing the differences between the simulated and observed groundwater levels. The calibrated result was evaluated by qualitative and quantitative comparison of the simulated and observed groundwater levels. The qualitative comparisons are based on visual comparison of the simulated and observed groundwater level.
Results
Modelling of the pallisa monitoring borehole
The amount of rainfall (precipitation) and groundwater level in long-run are extremely unstable in the weathered fractured aquifer and are similar to other regions of eastern Uganda and the whole world over. Although the groundwater system is directly fed from precipitation, the relationship between total monthly or seasonal precipitation and the groundwater level fluctuation is not prominent. But quite reliable results are obtained from the analysis of precipitation and groundwater level hydrographs. In general, the period between December and May is wet and this time is the potential groundwater recharge period in the area (Figure 5). But groundwater level hydrograph of Well-002 (Figure 6) indicates that groundwater level generally rises after dry seasons. Monthly or seasonal precipitations in the recharge period and the changes of groundwater levels at the end of the recharge period have been used to find a best match correlation. But unfortunately, no satisfying correlation was achieved (Figure 6). One of the two potential reasons of this discrepancy may be the long distance between the meteorological gauging station and the aquifer.
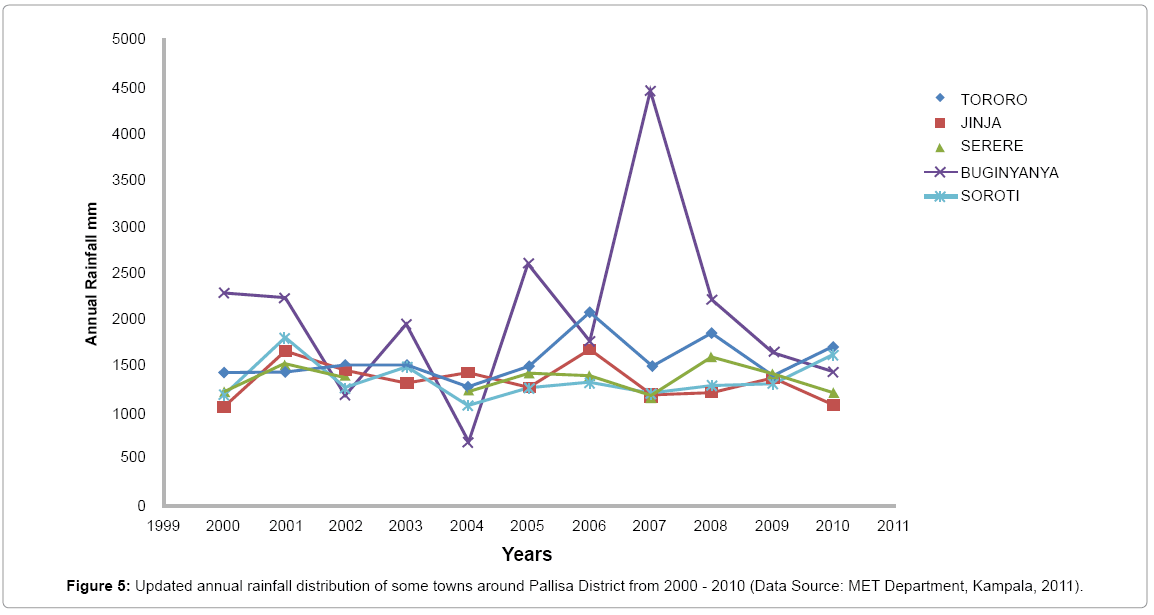
Figure 5: Updated annual rainfall distribution of some towns around Pallisa District from 2000 - 2010 ( Data Source: MET Department, Kampala, 2011).
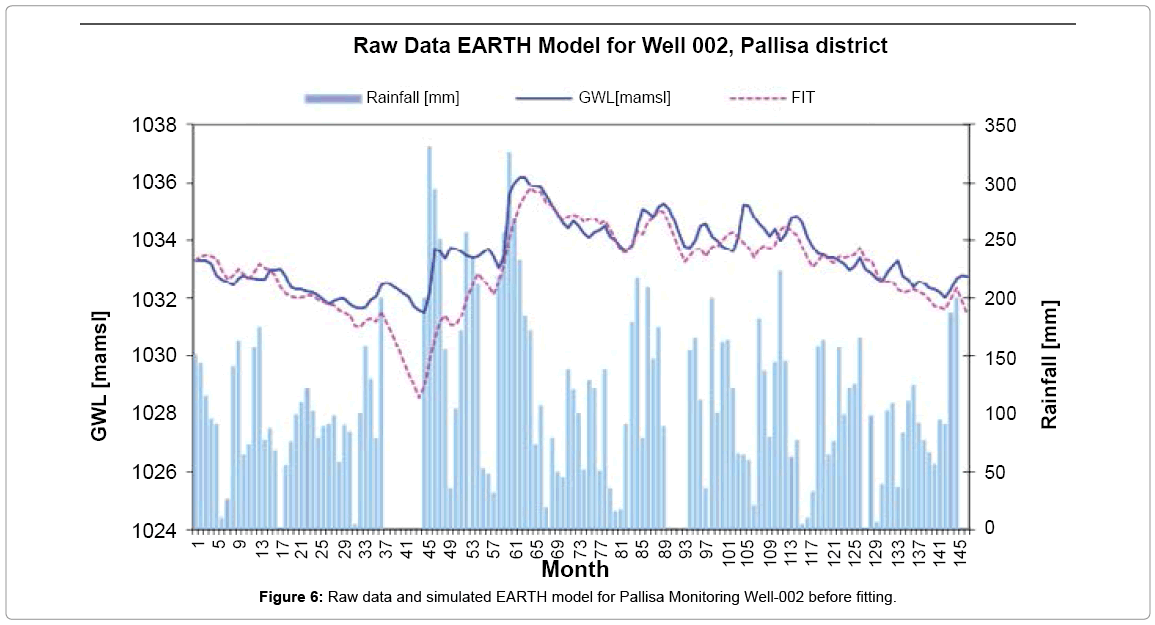
Figure 6: Raw data and simulated EARTH model for Pallisa Monitoring Well-002 before fitting.
Because Soroti meteorological gauging station is 31.5 km across Lake Kyoga or approximately 50 km by road via Kumi town from the watershed, perhaps it does not sufficiently represent the precipitation in the study area. However, the data of Soroti station show a similar trend to those of other meteorological stations (Figure 5). Soroti generally represents the climate conditions of the region. The other and stronger reason may be the well -known phenomenon: the discordance between the amount of precipitation and groundwater recharge in arid and semi -arid regions. The groundwater levels and rainfall time series were input into the model and the calculated groundwater level was figured along the measured one as seen in Figure 6.
Trend of Groundwater levels and rainfall in Pallisa district: According to Moon [21], groundwater levels generally fluctuate according to the characteristics of precipitation events (i.e. amount duration, intensity) and various hydrogeological variables (i.e. topography, thickness of the saturated zone and matrix composition of the saturated and unsaturated materials) Groundwater fluctuations from the observed hydrograph at the monitoring station vary between 8.8 and 13.48 mamsl with an average hydrostatic fluctuation of 11.42 mamsl. There is a hydrostatic fluctuations of 4.68 m which may relate to anthropogenic influences on groundwater levels, (i.e. Pallisa monitoring borehole is located near the up springing homesteads, a health centre, schools), cutting down trees for charcoal burning, overgrazing and droughts. An indication of hydrostatic response trends were based on the monthly water level measurements together with monthly rainfall data (Figure 7).
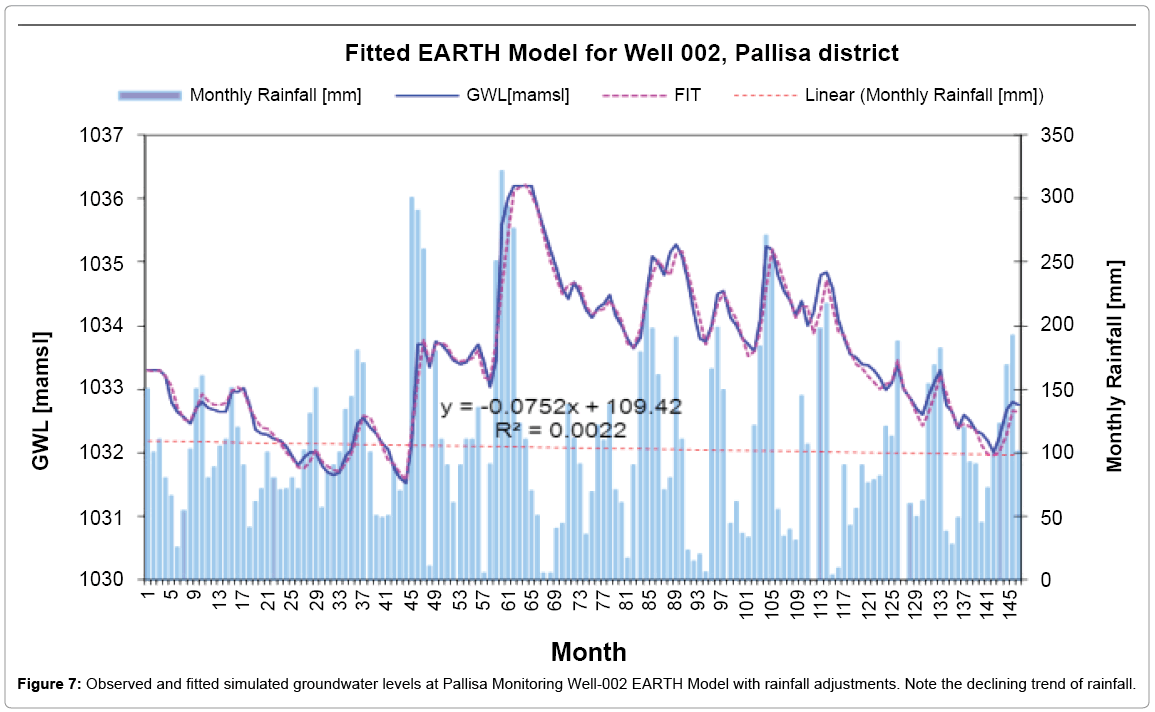
Figure 7: Observed and fitted simulated groundwater levels at Pallisa Monitoring Well-002 EARTH Model with rainfall adjustments. Note the declining trend of rainfall.
The response of the aquifer to recharge displays well identified seasonal water -level fluctuations. Looking at Figure 7, a number of observations are made:
• The rapid increase in water levels are associated with extreme single rainfall events, while progressive decrease in water level readings are as a result of decreasing low intensity rainfall or no rains at all.
• During the significant rainfall period (for example from April to June 2003 season) groundwater levels increase to 8.8m below ground level from the surface level of 1 045 m at the monitoring Well-002;
• Relative inclines and roughly exponential water level declines are observed after the rainy season or a decrease in rainfall events. Maximum groundwater levels for different years are mostly encountered during the months of March to April and October to November in every year’s two rainy seasons. The period of groundwater recharge depends on the duration of the rainfall season. No lag period(s) is/are observed between the onset of the rainy season and at the peak of water levels. In contrast during below average rainfall periods the succeeding recession period may continue throughout the season with little or no recharge at all; and where a strong relationship between rainfall and water level (aquifer) response exist active recharge occurs.
Although there is no evidence of aggravated abstraction by below average rainfall, the groundwater level declined by 2.05 and 2.84 mamsl from August 2003 to December 2004 and October 2007 to March 2010 respectively (Figures 8 and 9). Groundwater level declined steadily despite this being regarded as a wet season. Continued decline in groundwater level suggests a management intervention being necessary. The groundwater level declines are also enhanced by a number of consecutive below average rainfall years and are also evident in the monitoring borehole.
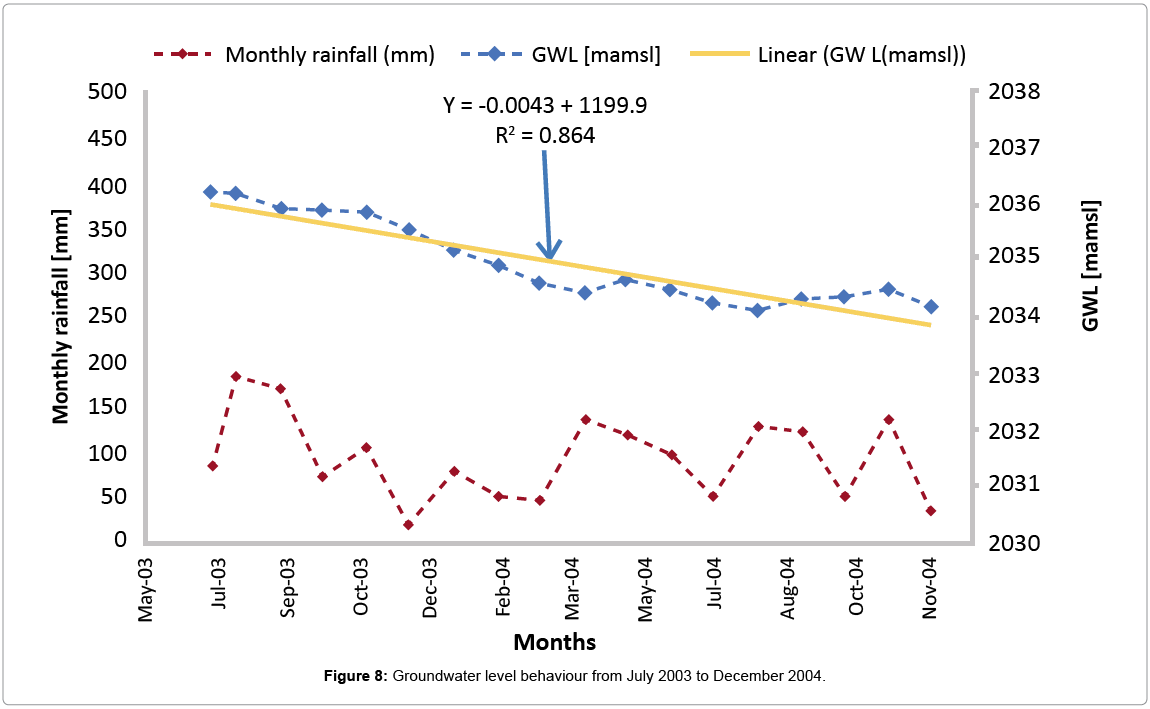
Figure 8: Groundwater level behaviour from July 2003 to December 2004.
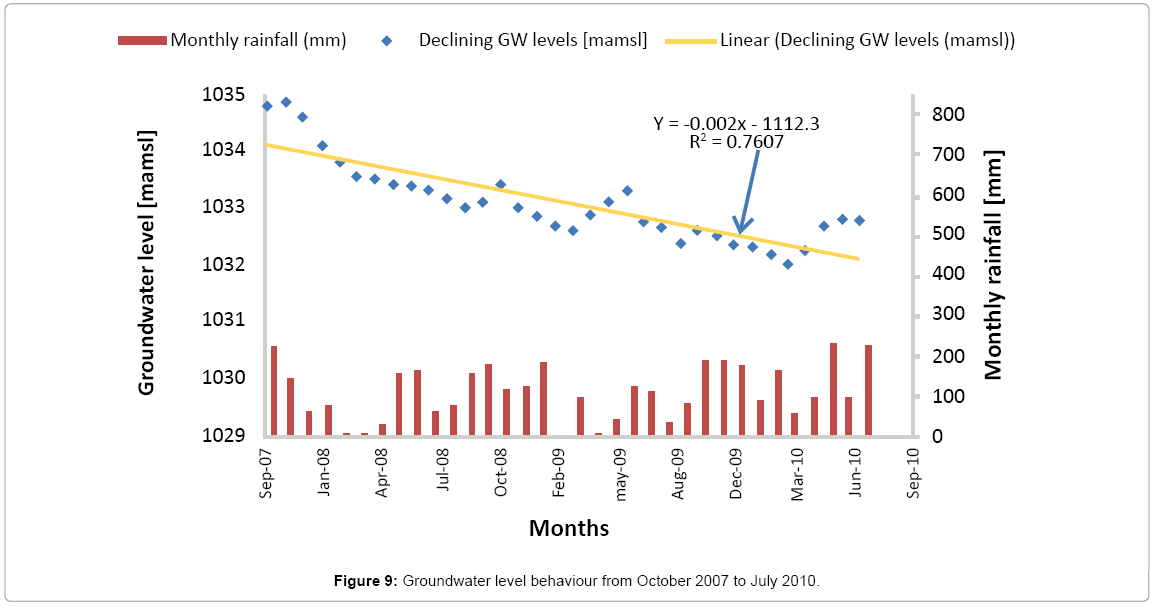
Figure 9: Groundwater level behaviour from October 2007 to July 2010.
The EARTH model calibration and evaluation: According to Anderson and Woessner [22], three calibrations procedures are carried out during the calibration processes: (1) change the parameter value that cause the largest deviation, (2) change just one parameter in each run; and (3) determine if the change of the parameter causes negative or positive effect on the other part.
The principal model parameters used for calibration are: The other parameter that is not calibrated but taken as a priori is the specific yield (S) and set at a fixed value. However, the values for the drainage resistance (DR = 2401) and recharge (%R = 11.4 (m3/month)) were only slightly adjusted to match in situ measurements of groundwater levels with the simulated groundwater levels (Figure 7). The calibrated result was quantitatively evaluated using the correlation coefficient (R2) in which the simulated groundwater levels are plotted versus the observed groundwater levels on a linear plot as in Figure 10.
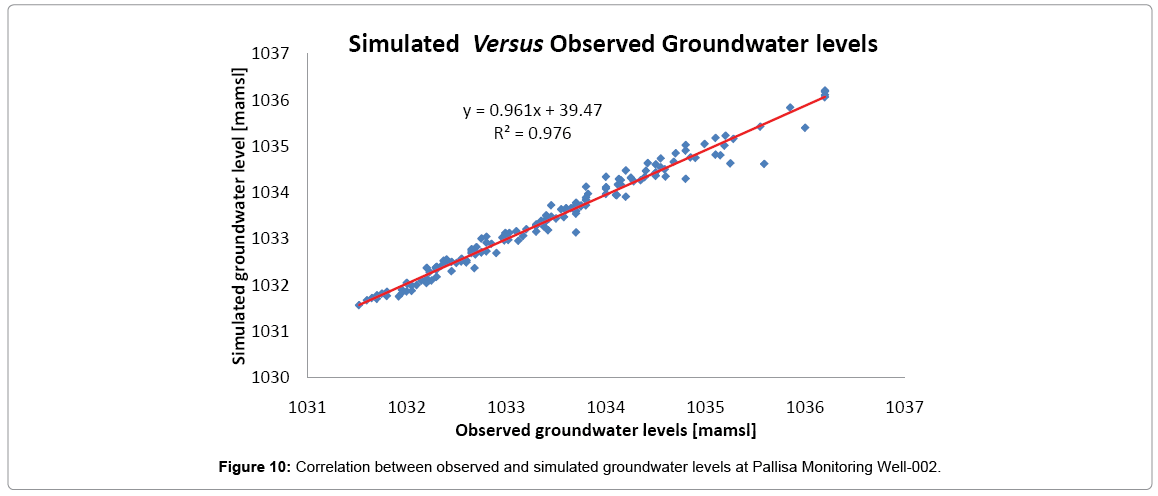
Figure 10: Correlation between observed and simulated groundwater levels at Pallisa Monitoring Well-002.
Another quantitative EARTH model calibration was performed using RMSE (Root Mean Square Error) by calculating the average measure of the residuals in the model. RMSE (calculated on the hydrograph extremes) is the standard deviation of the residual error over a selected calibration period and it is the average of squared differences between observed and calculated variables as indicated in equation 4.
 (4)
(4)
Where
• hobs is the observed groundwater level; hsim is the simulated groundwater level and Nobs is the number of available observations.
Quantitavely, RMSE reflect the discrepancy between the observed and calculated values. The lower the value of RMSE, the more accurate the prediction is.
Isotopic results
Main results obtained from the environmental isotopic analyses of groundwater and surface water samples in Pallisa District, Jinja and Entebbe along the Lake shores of Lake Kyoga and Lake Victoria are summarised and discussed in the following:
Recharge mechanisms of groundwater in eastern Uganda: Groundwater preserves an isotopic composition similar to that of precipitation. In the study area, estimation of groundwater recharge was found to be about 110 mm/year [23]. The study also concluded that most of the recharge was being transmitted by both the regolith and the fracture system within the underlying bedrock. These systems are considered the usual target of groundwater exploitation in most parts of eastern Uganda since they act as channels of preferential flow.
Variations of stable isotope ratios in the studied area: Stable isotope ratios in groundwater and lake water can be used to trace the source of water, as well as identify processes such as mixing and evaporation. Where direct recharge is significant, stable isotope ratios in the recharging waters (δ2H and δ18O) approximate mean stable isotope ratios in precipitation, weighted by volume [24]. Variations in the seasonal isotopic (δ2H and δ18O) composition of the rainfall in the Upper Nile Basin reflect the “amount effect” (Figures 11 and 12), which arises, in part, from monsoonal rains derived from the movement of the ITCZ (Inter-tropical Convergence Zone). The amount effect describes conditions where the volume of precipitation is positively correlated to depletion in the heavy (2H and 18O) isotope contents of precipitation. These bimodal peaks in rainfall coincide with the most depleted isotopic signatures [25]. Monsoonal rainfall in the Upper Nile Basin also originates from a more depleted source, the Indian Ocean (δ18O = 0 ± 1 ‰) than those derived from regional surface waters (δ18O = + 4 ± 2‰) [25]. The increased effect of evaporation on stable isotope signatures of lighter rainfall outside of the monsoons is observable at Entebbe in historical records from 1961 -1974 and 1998 -2003 were compared with the recent tests conducted in Pallisa District (Table 1) through a reduced slope of the Local Meteoric Water Line (LMWL) at Entebbe relative to the Global Meteoric Water Line GMWL (Figures 13 and 14), i.e. approximately δ2H = 7.3*δ18O + 11.4 (R2 = 0.99, n = 150).
| Water source | Units | No. of samples | Min. | Max. | Mean | Median | STD Error |
|---|---|---|---|---|---|---|---|
| Regional groundwater | δ18O | 599 | -4.6 | 0.1 | -2.28 | -2.25 | 0.02 |
| Bugondo and Pallisa groundwaters | δ18O | 19 | -2.8 | -2.1 | -2.47 | -2.43 | 0.2 |
| Jinja groundwater | δ18O | 12 | -0.1 | 2.8 | 1.44 | 1.38 | 0.3 |
| L. Kyoga wetlands | δ18O | 4 | -2.6 | 4.9 | 1.08 | 0.97 | 2.1 |
| L. Kyoga | δ18O | 5 | 4.4 | 5.7 | 4.83 | 4.54 | 0.2 |
| L. Victoria | δ18O | 45 | 2.8 | 4 | 3.46 | 3.46 | 0.03 |
| L. Victoria groundwater and springs | δ18O | 29 | -3.5 | -1.2 | -2.77 | -2.91 | 0.1 |
| L. Victoria Rivers | δ18O | 11 | -3.2 | 3.8 | -0.85 | -1.59 | 0.7 |
| Entebbe rainfall | δ18O | 150 | -11.6 | 2.9 | -2.2 | -2.1 | 0.2 |
| Regional groundwater | δ2H | 599 | -19 | 9 | -5.18 | -4.44 | 0.2 |
| L. Victoria groundwater and springs | δ2H | 29 | -16 | 1 | -8.88 | -9.4 | 0.7 |
| L. Victoria Rivers | δ2H | 11 | -13 | 26.5 | 1.74 | -1.1 | 3.8 |
| Entebbe rainfall | δ2H | 150 | -81.2 | 26.5 | -4.8 | -2.8 | 1.3 |
Table 1: δ18O and δ2H summary of stable isotope data (‰VSMOW) from upper Victoria Nile Basin waters (source: DWRM, Entebbe & Field fresh sample tests from Pallisa District, 2010).
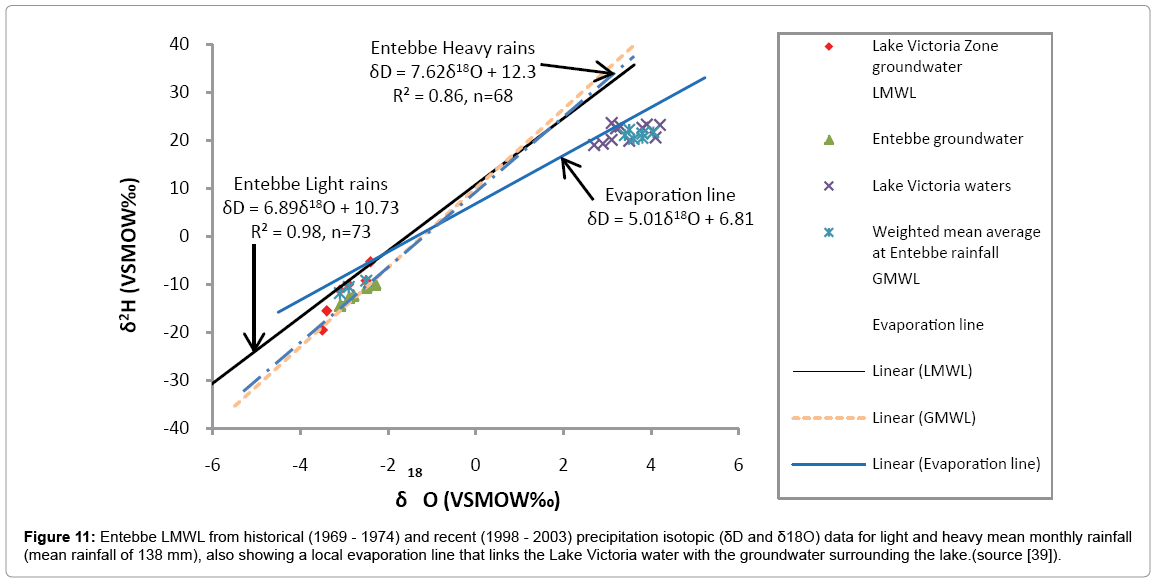
Figure 11: Entebbe LMWL from historical (1969 - 1974) and recent (1998 - 2003) precipitation isotopic (δD and δ18O) data for light and heavy mean monthly rainfall (mean rainfall of 138 mm), also showing a local evaporation line that links the Lake Victoria water with the groundwater surrounding the lake.(source [39]).
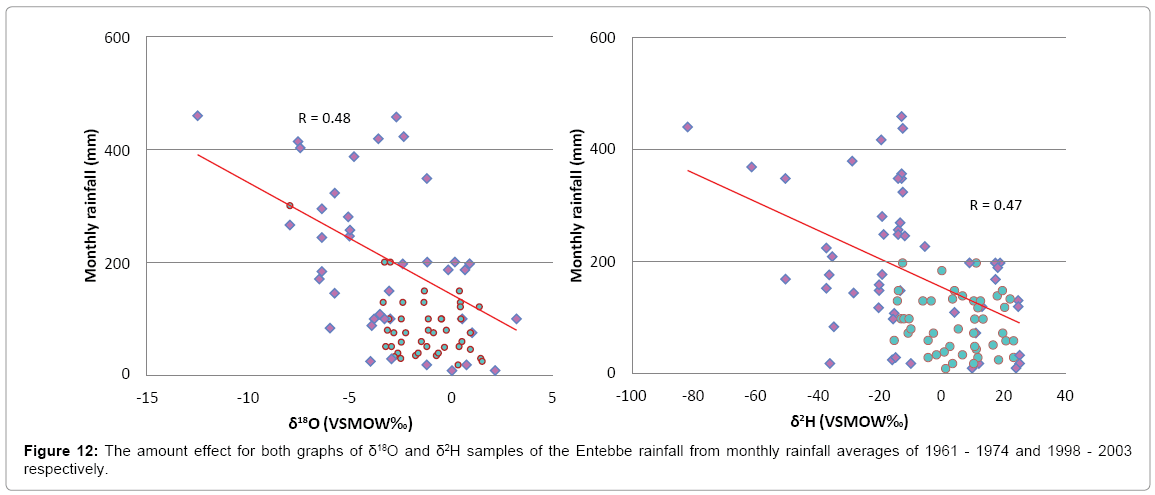
Figure 12: The amount effect for both graphs of δ18O and δ2H samples of the Entebbe rainfall from monthly rainfall averages of 1961 - 1974 and 1998 - 2003 respectively.
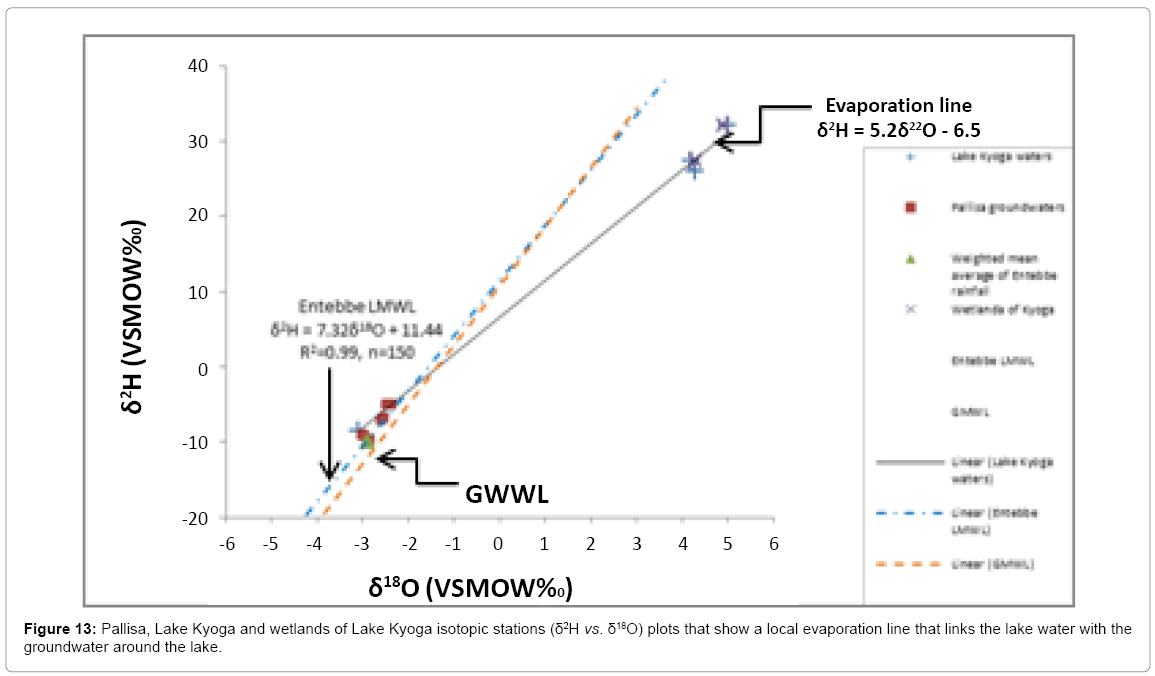
Figure 13: Pallisa, Lake Kyoga and wetlands of Lake Kyoga isotopic stations (δ2H vs. δ18O) plots that show a local evaporation line that links the lake water with the groundwater around the lake.
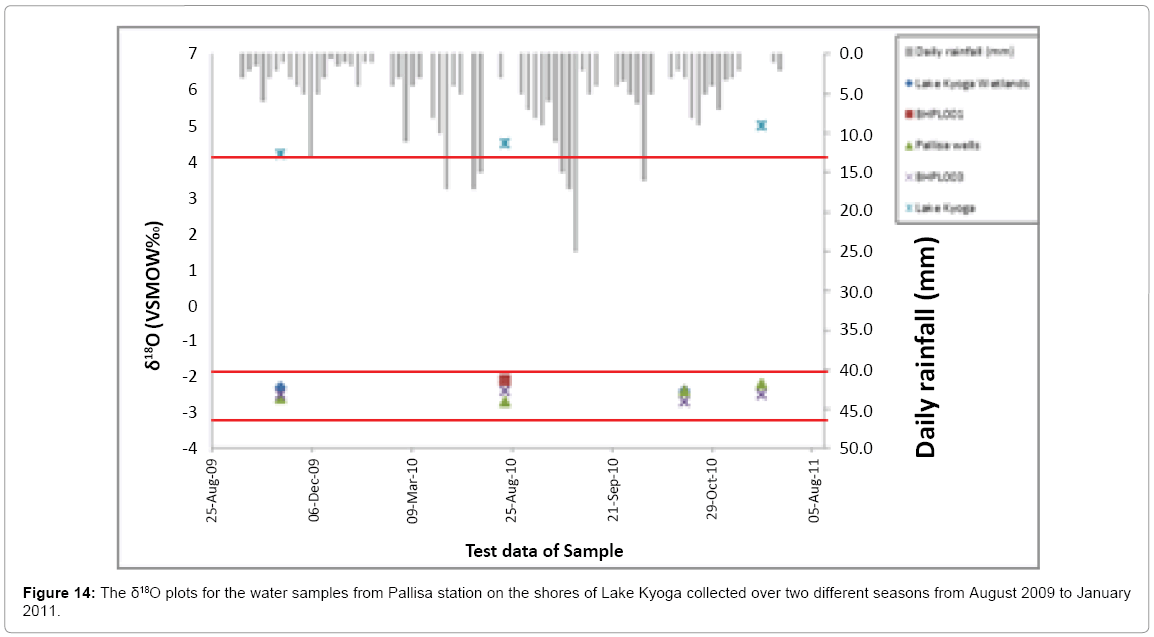
Figure 14: The δ18O plots for the water samples from Pallisa station on the shores of Lake Kyoga collected over two different seasons from August 2009 to January
Heavy monsoonal rains show a slope of 7.6 (δD = 7.62 * δ18O + 12.3; n = 68; R2 = 0.86) whereas lighter conventional rains (<138 mm mean monthly rainfall) regress along a slope of 6.9 (δD = 6.89*δ18O + 10.73; R2 = 0.98; n = 73) (Figure 11). Taylor and Howard [25] found that the heavy rains at Entebbe are parallel to the slope of GMWL (δD/ δ18O = 8.0 ± 0.3), whereas the lighter rains show a δD/δ18O slope of 6.8 ± 0.4, for a cut-off mean monthly rainfall of 150 mm (1961 -1974).
Stable isotope ratios in surface waters in East Africa are progressively enriched in the heavy isotopes through evaporation [26,27].
Isotopic relationship between precipitation and ground waters: Allison [28] developed a semi-empirical method of estimating recharge using the stable isotopes 2H and 18O. According to Amore [29], the method has never been shown to be applicable under field conditions, perhaps not surprising given that, while the relative abundance of both isotopes is influenced by evaporation, transpiration effects are not represented on infiltrating soil water [30]. It should also be realised that the second condition causing the isotopic composition of groundwater to match its recharging precipitation required that rainfall was to be the only source of recharge. In this study, the potential exists for the two other forms of recharge i.e. from surface water bodies in the form of vertical leakages from swamps or horizontal leakages from River Dodoi, River Mpologoma and Lake Kyoga, but could be affected by the temperature, altitude, latitude and amount effect [31,32]. In Pallisa District on the shore of Lake Kyoga, a comparison was made of the isotopic ratios in the local waters with both the GMWL and the Entebbe LMWL (Figure 13). In this study, rainfall samples were taken from four stations that were located in different parts in order to develop an enhanced LMWL for Pallisa. A cluster of groundwater and wetland samples have isotope ratios that show a regression along both the GMWL and LMWL. The slope of the LMWL is shown to be smaller than that of the Global Meteoric Water Line (GMWL) as hypothesised by Hou and supported by Yang [33,34].
Impact of climate variability on the isotopic composition of precipitation: The LMWL is controlled by the local climate factors and may differ from the GMWL, δD = 8δ18O + 10, according to Craig [26]. The GMWL is actually an average of many LMWLs controlled by local climatic parameters, including the origin of vapour mass, re -evaporation during rainfall and seasonality of precipitation [35]. In Figures 6-8 the isotopic composition of precipitation is in the range 5.5 to -4.5‰ δ18O and 30.5 to -13.5‰ δ2H.
The δ2H is linearly and positively correlated to δ18O. This cluster comprising groundwater and wetland samples with depleted isotope ratios together with a second cluster composed of lake and wetland samples having enriched isotope ratios, show a linear regression along an evaporation line with a slope of 5.2 as indicated in equation δ2H = 5.2 * δ18O + 6.5 (Figure 13). The stable isotope ratios in groundwater indicate active recharge by rainfall. It can be assumed that most of the wetlands around Lake Kyoga receive waters from various sources that include groundwater. The intercept of the evaporation line and the LMWL is the original isotopic composition of groundwater before evaporation. The slope of line 5.2 signifies that all the waters in the catchment have experienced a strong evaporative loss.
In Pallisa District, the δ2H -δ18O composition of groundwater shows a deviation of the evaporation line. This deviation can be used to understand the recharge mechanism in Pallisa i.e. the evaporated soil moisture mixes with the subsequent rain, which infiltrates the soil and displaces the residual soil water downwards. Eventually the mixed water will reach the water table. A similar process has been found by Allison [28]. The deviation of groundwater from the meteoric water line can be used to get a rough estimate of recharge, but it also indicates that the later has been affected by evaporation. Figure 14 shows the Lake and wetland samples enriched in δ18O values relative to groundwater and wetland samples in Pallisa on the shore of Lake Kyoga are characterised as (4 < δ18O < 6‰). The water samples were collected during the dry and wet seasons. The groundwater samples from boreholes PL001, PL003 and other wells in Pallisa indicate that they are always depleted in 18O. During this period, the δ18O values decreases from -2 to -3‰ and in addition, they are very close together meaning that they have remarkably similar sources and environments. Lake waters are always enriched (> 4‰) in δ18O during all the seasons. However, Lake Kyoga wetland waters are quite depleted (< -2‰) in δ18O with similar isotope ratios to groundwater during the wet season and conversely, enriched (> 4‰) with similar isotope ratios to lake waters during the dry season possibly due to evaporation.
Clark and Fritz [35] stated that secondary evaporation also decreases the deuterium excess (d). The value of d is defined in equation 5 as:
d = δD-8δ18O (5)
The average d for all rainfall is 6, smaller than the global average, 10‰. The d-excess is a measure of the deuterium enrichment that exceeds the δ18O value by more than 8 times. It is also a measure of evaporation effects both during primary evaporation, when water is evaporated to form a vapour mass, and during secondary evaporation. High d-values indicate low humidity and rapid or kinetic evaporation effects on the isotopes. Secondary evaporation of rain can only happen during rainfall in a hot, dry air. Though there are several effects that influence the distribution of stable isotope in rainfall such as temperature, latitude and altitude, the amount effect was utilized in this study.
Discussion
The clustering of groundwater samples observed suggests that both evaporation and isotopic exchange with the aquifer minerals may be occurring into the system. This is also supported by the fact that some groundwater samples below the LMWL appear depleted, which is probably due to either rainfall during the transit or isotopic exchange with the aquifer materials which are less in 18O [36]. However, some samples are found above LMWL, suggesting a recent recharge history but they may have suffered evaporative effects, resulting in some fractionation, thus, leading to enrichment of the surface water. Samples with similar isotope composition as the precipitation indicated by those plotted on the LMWL are regarded as recharging directly from local precipitation. This explains the higher isotopic enrichment observed. Recharging water with more depleted stable isotopes dilutes the already existing groundwater. Furthermore obstruction by the vegetation cover may prevent part of the rainfall reaching the land surface, and the lighter isotopes by then will have evaporated into the atmosphere. The heavier isotopes on the vegetation cover drops into the surface water, thus leading to the enrichment of the more covered wetland areas of the district. In the Isotopic evaluation, the LMWL of Entebbe is δ2H = 7.32*δ18O + 11.44 and the evaporation line δ2H = 5.2 * δ18O + 6.5 whose slopes are smaller than that of the GMWL indicating that evaporation occurs during rainfall events.
The effect of evaporation is greatest for light precipitation. With the increase of rainfall intensity, the slope of meteoric water lines tends to close to eight. Meanwhile, the measured groundwater δ18O and δD values scatter around LMWL, indicating that the groundwater is of meteoric origin. Water can be classified into two groups A and B. Where values of δ18O and δD are higher and have wider distribution, the higher scatter in δ18O and δD suggests that the isotopic composition of this group A and is strongly affected by local discharge. Group B is isotopically depleted relative to group A, reflecting the wetland waters.
It is important to note right from the beginning of this write-up that crystalline weathered and fractured aquifers are shallow aquifers and are more sensitive to stresses imposed at the ground surface compared to deeper aquifers. Therefore, these types of aquifers are affected by local climate changes, whereas deep aquifers are affected only by regional changes. Climate variation in this study area spans for a relatively short -term period of approximately 12 years that greater impact on this shallow aquifer system is observed. In other words, the Pallisa District weathered fractured aquifer is a typical shallow aquifer which is vulnerable to the climate variability. Groundwater levels in the monitored Well-002 responded to precipitation. Though other studies by Rivard [37,38], however, have shown that increased annual precipitation does not necessarily correspond to an increase in recharge as in many cases would be anticipated. Re -occurrences of droughts over the years have resulted in declining water levels not only because of reduction in precipitation but also due to increased evaporation and reduction in infiltration capacity of the dry bear topsoil. Extreme precipitation events (heavy rainfall and storms) led more recharge to groundwater in July and August 2003. Although no exploitation does occur at the monitoring site (Monitoring borehole), groundwater levels declined in the three instances: December 1999 to April 2001, August 2003 to December 2004 and October 2007 to March 2010 respectively. This may be attributed to partially by anthropogenic influences (pumping, climate variations and land-use). Though significant water strikes occur to the depth of more than 50 m, most flow in the study area occurs within the top 30 and 40 m deep towards the weathered fractured bedrock [39]. This is primarily due to the predominance of fracture flow within which becomes decreasingly important with depth. With low specific yield allied to relatively high transmissivity, this weathered and fractured bedrock aquifer show much pronounced water level fluctuations during recharge and low in the recession periods. The calibration of the model was achieved by the optimisation of parameters manually in a trial and error method procedure. The Model performance was evaluated on the basis of visual interpretation of the calibrated results and the criterion used. The correlation coefficient (R2) of 0.977 in the model (Figure 10) indicates a very good model performance. The RMSE value results provided by the EARTH model for Figure 6 is 0.0785024 m that approximates to 0.079 m while that of Figure 7 is 0.0149596 that approximates to 0.015 m. RMSE of 0.015 m is the lower of the two graphs and is considered the best fit to the groundwater level graph of Pallisa District monitoring borehole.
Conclusions
• It is very clear that replenishment of groundwater in the study area is entirely through precipitation;
• Shallow underground waters have undergone evaporation and the evaporation line above the GMWL;
• Wells with lower temperature values contain more depleted stable isotopes; this means that the water table is shallow and it is affected by ambient temperature and direct recharge from precipitation;
• More recharge is experienced in the southern part of the Pallisa catchment and high nitrate contents of groundwater samples from boreholes in these areas; and the isotopic compositions of groundwater samples from the fractured aquifer show isotopically depleted groundwater from the fractured aquifer may suggest the presence of freshening groundwater in the basin infiltrated during wet periods as supported by previous studies. However, due to limited transmissivity, recharge is slow enhancing evaporation & isotope fractionation.
Therefore, extensive exploitation of the groundwater within Pallisa District would require the application of a development strategy taking into consideration the capability of recharge of the granitised aquifer system.
In addition, the above EARTH model analysis in the study area indicates that groundwater fluctuations are affected by the natural climate variations and anthropogenic influences. Thus the analysis demonstrated the important factors for groundwater level fluctuations in the weathered fractured aquifers. A particularly important finding was that monthly groundwater levels can be simulated without detailed hydrogeological information, which is rarely available when precipitation and groundwater levels are known. The model can be extended to take into account the effect of abstractions on the groundwater level fluctuations that could neither be quantified nor used the modelling process.
Further Study Areas
(1) A distributed hydrological approach should be developed to estimate the impact of climate variability on groundwater storage and groundwater -surface water interaction and to predict the seasonal groundwater level variations;
(2) Changes in water quantity may affect water quality and so any linkage between water quantity and quality need to be explored;
(3) The question today remains as to whether or not we can find the isotopic “dactylogram” (characteristic 18O and 2H values) of the past climate and environmental changes in the groundwater of the study area. To answer this question, it appears useful to consider the age gradient of the groundwater in an unconfined aquifer with parameters typical for this area that has not been studied yet;
(4) To overcome the natural fluctuation problem of water level and well discharge, it may be necessary to analyse the response of the groundwater system to the climate variability and man -made effects at short time intervals to ascertain the future trend of the recharge system.
Acknowledgement
The authors are grateful to the material support and funding from Kyambogo University under the Staff Development Programme without which this research would not have been possible. The assistance from the Ministry of Water and Environment under the Directorate of Water Resources Management, Entebbe for the analysis of samples and provision of technical work, Pallisa District Water Office in drilling the boreholes at the test sites, MET Department Kampala for provision of rainfall and temperature data is greatly appreciated. Technical field assistance that was offered by Christine Makawia for stable isotope analysis is also appreciated. The authors give the sincere thanks to Rashid Kisomose for his earnest field work.
References
- Lewis JE (1989) Climate change and its effects on water resources for Canada: A review. Canadian Water Resources Journal 14: 35-55.
- Gleick PH (1989) Climate change, hydrology, and water resources. Rev. Geophys 27: 329-344.
- Maathuis H, Thorleeifson LH (2000) Potential impact of climate change on prairie ground water supplies: Review of Current Knowledge. Sackatchewan Research Council (SRC).
- Chen ZS, Osadetz GK (2002) Prediction of average annual groundwater levels from climate variables: An empirical model. Journal for Hydrology 260: 102-117.
- Aflatooni M (2011) Surface water–ground water flow interactions in relation to meteorological factors. Presented at the 2nd National Symposium on Agriculture and Sustainable Development, Oportunities and Challenges College of Agricultural Sciences Shiraz Azad University, Iran.
- Ahn H (2000) Modeling of groundwater heads based on second order difference time series modeling’s. Journal of Hydrology 234: 82-94.
- Zuber A (1986) Mathematical models for the interpretation of environment radioisotopes in groundwater systems. Handbook of environmental Isotope Geochemistry 2: 1-55.
- Aggarwal PK, Gat JR, Froehlich FO (2005) Isotopes in the water cycle, past, present and future of a developing science. Springer publishers, Netherland: 1-377.
- Alsaaran NA (2006) Using environmental isotopes for estimating the relative contribution of groundwater recharge mechanism in arid basin, central Arabia. The Arabian Journal for science and engineering 31: 3-13.
- Chen Z, Nie Z, Zhang G, Wan L (2006) Environmental isotopic study on recharge and residence time of groundwater in the Heihe River basin, north western China. Hydrology Journal 14: 1635-1651.
- Adanu EA (1991) Source and recharge of groundwater in the basement terrain in the Zaria-Kaduna area, Nigeria: applying stable isotopes. Journal of African Earth Sciences 13: 229-234.
- Howard K , Karundu J (1992) Constraints of the development of basement aquifers in East Africa - water balance implications and the role of the regolith. Journal of Hydrology 139: 183-196.
- Nyende J (2007) Groundwater quality and sustainability in granitised fractured aquifers, Pallisa district, eastern Uganda: WIT transaction on Ecology and the Environment 103: 264-265.
- Coplen TB (1994) Reporting of stable Hydrogen, Carbon and Oxygen Isotopic abundances, Pure and Applied Chemistry 66: 273-276.
- Coleman ML, Shepard TJ, Durham JJ, Rouse JE, Moore GR (1982) Reduction of water with zinc for hydrogen analysis. Analytical Chemistry 54: 993–995.
- Epstein S, Mayeda TK (1953) Variations of the 18O of water natural sources. Geochimica et Cosmochimica Acta 4: 213–224.
- Van der Lee J, Gehrels JC, Simmers I (1997) Modelling of groundwater recharge for a fractured dolomite aquifer under semi-arid conditions; In -Recharge of Phreatic Aquifers in (Semi-) Arid Areas. IAH 19: 129-144.
- Gieske ASM (1992) Dynamics of groundwater recharge: a case study in semi-arid eastern Botswana. PhD Thesis, Vrije Universiteit, Amsterdam: 289.
- Van Tonder GV, Xu Y (2000) A guide for the estimation of groundwater recharge in South Africa, Project conducted for DWAF under the supervision of Eddie van wyk, Water Resources Commission, South Africa.
- De Vries JJ (1974) Groundwater flow systems and flow nets in the Netherlands. PhD Thesis Vrije Universiteit Armsterdam.
- Moon SK, Woo NC, Lee KS (2004) Statistical analysis of hydrographs and water table fluctuation to estimate groundwater recharge. Journal of Hydrology 292: 198-209.
- Anderson MP, Woessner WW (1992) Applied groundwater modelling: Simulation of flow and advective transport, San Diego Academic Press
- Nyende J (2003) Evaluation of Groundwater Resource Potential of Pallisa District in eastern Uganda. Unpublished MSc. Thesis Institute for Groundwater Studies University of the Free State Republic of South Africa.
- Lloyd JW, Heathcote JA (1985) Natural inorganic hydrochemistry in relation to groundwater, Clarendon Press, Oxford Science Publications: 100-102.
- Taylor RG, Howard K (1999b) The influence of tectonic setting on the hydrological characteristics of deeply weathered terrains: evidence from Uganda. Journal of Hydrology 218: 44-71.
- Craig H (1961) Isotope variations in meteoric waters. Science 133: 1702-1703.
- Taylor RG, Howard K (1998) Post-Palaeozoic evolution of weathered land surfaces in Uganda by tectonically controlled deep weathering and stripping. Geomorphology 25: 178-193.
- Allison GB, Barnes CJ, Hughes MW, Leaney FJ (1983) Effect of climate and vegetation on oxygen-18 and deuterium profiles in soils. Isotope Hydrology IAEA Symposium Vienna.
- Amore FF, Darling G, Paces T, Pang Z, Silar J (2000) Environmental isotopes in the hydrological cycle: Principles and applications: Groundwater IAEA Vienna.
- Zimmerman U, Ehhalt D, Munnich KG (1967) Soil water movement and evpotranspiration: changes in the isotopic composition of the water. In: Isotope in Hydrology, IAEA, Vienna: 567-584.
- Ingraham NL, Kendall C, Mc Donnel JF (1998) Isotopic variation in precipitation. Isotope tracers in catchment hydrology Elsevier 87-118.
- Gat JR, Mook WG, Meijer AJ, Mook WG (2001) Atmospheric water. Environmental Isotopes in the hydrological cycle: principals and applications 2, IHP-V, Technical document no. 39, UNESCO, Paris.
- Hou GC, Su X, Lin X (2007) Environmental isotopic composition of natural water in Ordos Cretaceous Groundwater Basin and its significance for hydrological cycle. J Jilin University (Earth Science edition.) 37: 255-260.
- Yang YC, Shen ZL, Weng DG, Pang ZH, Hou GC, et al. (2009) Oxygen and Hydrogen isotopes of water samples in Ordos Basin, China: implications for recharge of groundwater in the north of Cretaceous Groundwater Basin. Acta Geol. Sin 83: 103-113.
- Clark ID, Fritz P (1997) Environmental isotopes in hydrogeology. Lewis Publishers, New York.
- Domenco PA, Schwartz FW (1990) Physical and chemical hydrogeology, John Wilcy and sons, New York.
- Rivard CJ, Marion Y, Michaud S, Benhammane A, Morin R et al., (2003) Study of the potential impact of Climate Change on the Water Resources. In From the underground is Canada. Ottawa, On: Geological Survey of Canada.
- Rivard C, Vigneault H, Piggott AR, Larocque M, Anctil F (2009) Groundwater recharge trends in Canada, Can. J. Earth Sci 46: 841–854.
- DWRM (2010) Directorate of Water Resources Management-GIS Department, Entebbe.
Citation: Nyende J, van Tonder G, Vermeulen D (2013) Application of Isotopes and Recharge Analysis in Investigating Surface Water and Groundwater in Fractured Aquifer under Influence of Climate Variability. J Earth Sci Clim Change 4: 148. DOI: 10.4172/2157-7617.1000148
Copyright: ©2013 Nyende J, et al. This is an open-access article distributed under the terms of the Creative Commons Attribution License, which permits unrestricted use, distribution, and reproduction in any medium, provided the original author and source are credited.
Select your language of interest to view the total content in your interested language
Share This Article
Recommended Journals
Open Access Journals
Article Tools
Article Usage
- Total views: 20532
- [From(publication date): 8-2013 - Dec 19, 2025]
- Breakdown by view type
- HTML page views: 14832
- PDF downloads: 5700