Spatial Variation of Nutrients in Sondu-Miriu and Simiyu-Duma Rivers: Implication on Sources and Factors Influencing their Transportation into the Lake Victoria
Received: 15-May-2012 / Accepted Date: 27-Sep-2012 / Published Date: 29-Sep-2012 DOI: 10.4172/2157-7617.1000119
Abstract
Lake Victoria basin has been under growing pressure from both natural and anthropogenic activities. These activities have created many nutrient pollution sources which affect the survival and sustainability of the Lake Ecosystem. This study was conducted to investigate the transportation of nutrients into the Lake Victoria through the Sondu-Miriu (SM) and the Simiyu-Duma (SD) rivers to represent the changes that have been occurring in many rivers draining the Lake basin. Water samples were collected along the SM and the SD river courses from upstream to the Lake shore. The results showed that the concentration of nitrate ranged between 770 μgL-1 and 970 μgL-1 for SM River and between 400 μgL-1 and 1250 μgL-1 for SD River while for phosphate it ranged from 120 μgL-1 to 270 μgL-1and from 457 μgL-1 to 1175 μgL-1 for SM and SD Rivers, respectively. The estimated nutrient loading through SM were 40ty-1 and 7.9ty-1 while for SD River were 25 ty-1 and 26ty-1 for dissolved inorganic nitrogen and phosphorous, respectively. The spatial variation of the concentrations nitrogen was not significant along the SM while in the SD Rivers the average concentration was lower in downstream than in the middle due to presence of swamp and dam that regulate the flow of water and retain nutrients. The results suggest that the catchment soil and rock are the major sources of the nutrients and their interaction with water dominate the transportation mechanism of the nutrients to the Lake Victoria through the Sondu-Miriu and Simiyu-Duma rivers.
Keywords: Lake victoria; Sondu-Miriu; Simiyu-Duma; Nutrients; Catchment; Land use
8687Introduction
Water is one of the most essential constituents of human environment. The resource generates development in socioeconomic issues crucial to the society in general and more specific for industries, agricultural activities and for the public uses. The growth of anthropogenic factors such as urbanization, industrial and agricultural activities has created many pollution sources to the water bodies [1]. According to Chokmani and Gallichand [2], water quality in a watershed dominated by animal production was related to land use practices, particularly the intensity of animals. Dissolved oxygen, N, P, and fecal coliforms were the parameters most affecting surface water quality.
Lake Victoria is an international freshwater source of great ecological and economic importance. Large changes that have occurred recently in the environment and the ecology of the lake are associated with natural processes as well as anthropogenic activities in the catchment area and the lake itself [3]. Odada et al. [4] urged that water in the Lake Victoria is under considerable pressure from a variety of interlinked human activities. The lake has undergone enormous environmental changes within the last 40 years which results into blooming of blue-green algae, decreasing of water transparence and increase in frequency of water born diseases. Water hyacinth and extinction of indigenous fish species as result of deoxygenating in the lower depth water and over fishing has also been reported [5].
Human development has partially contributed to water quality deterioration. Population growth of riparian communities estimated to be 6% is among the highest in the world. The rapid growth accompanied with expansion of agricultural activities, livestock keeping, deforestation, biomass burning and human settlement have exerted pressure within the Lake Victoria basin [6]. The Lake Victoria crescent receives unfavorable climatic fluctuation characterized by heavy storms generating considerable runoff, which could then be loaded with relatively rich soil nutrients [1]. Realizing that several projects were initiated to combat the lake pollution. For example, Lake Victoria environmental management program (LVEMP) phase I started 1997-2004 and followed by phase II, Lake Victoria Fisheries Research Project (LVFRP) also started in 1997 and Nile Basin Initiative (NBI).
We hypothesized that the transportation of nutrients in the river water may reflect the activities occurring in the catchment. The transportation can also be affected by catchment characteristics such as topography, rock, physical and chemical characteristics of soil. This may result into spatial and temporal variation in the nutrient loading to the Lake Victoria. In addition to that understanding of trend of nutrient loading is very crucial to gauge the efficacy of existing environmental law/policies and programs on reducing the nutrients input and sustainability of the Lake ecosystem. The purpose of this study was to investigate spatial variation of nutrients along Sondu-Miriu and Simiyu-Duma in order to understand the sources and factors influencing their transportation mechanism as well as trend of nutrient loading into Lake Victoria in Kenya and Tanzania sides, respectively.
Materials and Methods
Study area
The study was conducted in Kenya and Tanzania along the Sondu- Miriu and the Simiyu-Duma rivers draining into Lake Victoria (Figure 1). Lake Victoria is the largest lake in Africa and the second largest in the world with the surface area of about 68,000 km2 and catchment area of nearly 184,000 km2. The lake is a relatively shallow and has a gentle slope on the shores hence any slight change in lake level affects a considerably large land area. The water balance in the Lake Victoria is dominated by evaporation and rainfall with minor contribution from river inflow and outflow. The rain falling over the lake accounts for 82% of the inflow while basin discharge contributes 18%. The evaporation from the lake account for 76% of the water output while the Blue-Nile River, the only outflow from the lake account for 24%.
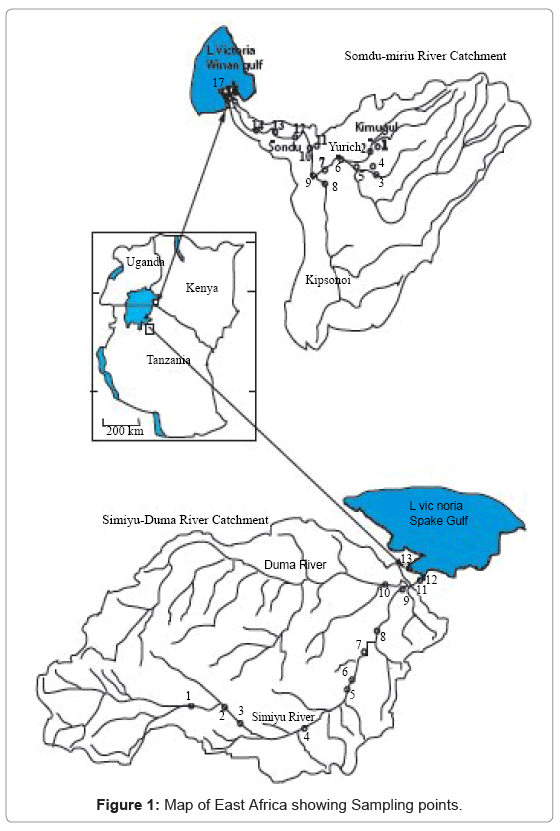
Figure 1: Map of East Africa showing Sampling points.
The lake is boarded by Tanzania, Kenya and Uganda. It stretches 412 m from North to South, between latitudes 0°30’N and 3°12’S, and 355 km from West to East between longitudes 31°37’ and 34°53’ E. It is situated at an altitude of 1,134 m above sea level and has a volume of 2,760 km3 with an average and maximum dept of 40 m and 80 m respectively. The Lake Victoria region has an equatorial climate (Walter et al. 1960) with small seasonal variation in solar radiation. The mean annual temperatures in areas close to the lake range between 22.8°C and 23.3°C, and mean daily temperature of the hottest month range between 29.3°C and 31.6°C.
There are about 10 major rivers flowing into the Lake Victoria from Kenya side. Sondu-Miriu River is the third largest river among the Kenya Rivers draining their water into the lake. It drains a total area of 3,508 km2 in the western part of Kenya. The river originates from the western slopes of the Mau Escarpment and inflows through a narrow Gorge, penetrating the Odino Falls before entering the flood plains of Nyakwere where it drains into the Winam Gulf of the Lake Victoria.
Population in the catchments area are engaged in agricultural production, mostly as small-scale farmers for crops such as sugar, tea, maize, cotton and livestock keeping. The river provides hydroelectric power, support irrigation, livestock and for domestic purposes. The Sondu catchment area is dominated by Nitisols at the upper area, Acrisols at the middle and by Regosols at the lower part of the river. Other soil types located in the catchment in the small proportions are Andosols, Cambisols, Greyzems, Lithosols, Phaeozems, Planosols, Rankers, Vertisols, and Xerosols.
Tanzania has more rivers draining into the Lake Victoria compared to Kenya and Uganda. There about 12 major rivers in which Simiyuduma is the second largest in terms of water discharge and the fourth in terms of catchment area. The Simiyu-Duma River is formed by two major rivers, the Simiyu River and the Duma River which merge at the downstream about 4 km from the lake. The Simiyu River flows from the Serengeti National Park plains to the Lake Victoria. The headwaters of the Simiyu catchment start at elevation of 1640 m and descend to 1140 m at the Speke gulf of the Lake Victoria. The Duma River formed as result of confluence of Ngasamo and Bariadi rivers at the upstream. The Simiyu-Duma River is categorized as ephemeral stream whereby the river goes dry and wet such that percentage of water yield from subcatchment disappears in the main channel as a result of transmission losses and in-stream evaporation. The catchment has a warm tropical savannah climate with an average temperature of about 23°C. Short rainfall appears mainly in November and December and long rains in March to May resulting in a total annual rainfall of 700 to 1000 mm. Sandy loam soil covers about 60% of the total catchment area (Rwetabula et al., 2004).The main land use/land cover of the Simiyu catchment consists of mixed bare land and short grasses (46.5%), dense and tall grassland (21.5%), bushland (19.7%), cultivated land (8.3 %) and medium size grassland (4%). A very small area (0.02%) is covered by surface water [7]. The most frequently grown crops are cotton and maize. Due to rainfall uncertainties most cropping systems practiced in this area are staggered planting (planting crops on different dates), intercropping and flat cropping system [8]. Communal grazing is the most practiced livestock management system in the Simiyu catchment.
Sampling
The water samples for the Sondu-Miriu River were collected once from seventeen different locations from upstream to the Lake shore (Figure 1). Six samples (no. 1-6) were collected from upper catchment, eight samples (no. 7-14) were collected from middle catchment and three samples from lower catchment. Thirteen different locations were sampled once for the Simiyu-Duma River. Three samples (no. 1-3) were collected from the upstream catchment, five (no. 4-8) from the middle catchment and five samples (no. 9- 13) from the lower catchment and lake shore. Samples were collected using plastic bottles and stored in cool container for transportation to the laboratory for analysis. All samples were collected in November 2007 during short rain which represents intermediate between base flow and high flow conditions.
Samples preparation and analysis
One liter of each water sample was filtered through pre-weighed 0.45 μm cellulose-acetate filter membrane to remove total suspended particles. The filtrate was preserved by freezing for later analysis of nutrients. The filter papers with residue were dried at 105°C followed by cooling in a desiccator to constant weight. The increase in weight of filter paper after filtration was calculated as total suspended solids (TSS). The temperature, electrical conductivity (EC), total dissolved solid (TDS) and pH of the samples were measured in situ using a portable pH/°C/°F Meter.
Ammonium concentration was determined by indophenol method involving oxidation with sodium hypochlorite and phenol solution. Nitrate nitrogen was analyzed by cadmium reduction and diozoic complex while phosphate phosphorous was analyzed by molybdate blue method with ascorbic acid. Nutrients analysis was done according to methods described by APHA [9]. Dissolved inorganic nitrogen (DIN) was calculated as the sum of dissolved nitrate-nitrogen and ammonium-nitrogen while dissolved inorganic phosphorous was estimated as equal to dissolved phosphate-phosphorous. Comparison between the nutrients concentrations in the upstream, middle stream and downstream with the river was done using one way ANOVA while between Simiyu-Duma and Sondu-Miriu River was done by using t-test.
Results and Discussion
Physico-chemical parameter
Temperature and pH: The variation of water temperature in the Sondu-Miriu River ranges from 18.4°C to 24.3°C and the mean temperature was 19.7°C (Table 1). Relatively higher temperature was recorded in the samples collected downstream, while the lowest temperatures were recorded at upstream at relatively high altitude. This variation of water temperature might be due to altitudinal changes or exposure to solar radiation. At higher altitude usually the temperature is low similar to the area where there is little exposure to solar radiation. In the Simiyu-Duma River, water was relatively warm with temperature range of 23.6-29.2°C (Table 2). The samples show no altitudinal variation along the river.
| SN | pH | EC (µScm-1) |
TDS (ppm) | TSS (ppm) | NO3-N (µgL-1) | NH4-N (µgL-1) | PO4-P (µgL-1) | DIN (µgL-1) | DIP (µgL-1) | DIN/DIP |
| Upstream Catchment | ||||||||||
| 1 | 5.4 | 36.7 | 18.2 | 40 | 940 | 360 | 120 | 1300 | 120 | 10.83 |
| 2 | 6.9 | 38.6 | 18.8 | 30 | 940 | 370 | 200 | 1310 | 200 | 6.55 |
| 3 | 7.6 | 30 | 15.1 | 30 | 970 | 260 | 160 | 1230 | 160 | 7.68 |
| 4 | 6.5 | 37.9 | 19 | 40 | 950 | 320 | 190 | 1270 | 190 | 6.68 |
| 5 | 8.3 | 39.8 | 19.9 | 20 | 950 | 170 | 140 | 1120 | 140 | 8.0 |
| 6 | 7.8 | 38.8 | 19.7 | 20 | 940 | 260 | 180 | 1200 | 180 | 6.67 |
| Average | 7.08 | 36.97 | 18.45 | 30.00 | 948.33 | 290.00 | 165.00 | 1238.33 | 165.00 | 7.74 |
| Std Dev. | 1.05 | 3.56 | 1.75 | 8.94 | 11.69 | 75.37 | 30.82 | 71.39 | 30.82 | 1.63 |
| Middle Stream Catchment | ||||||||||
| 7 | 8.2 | 70.5 | 35.3 | 70 | 770 | 240 | 230 | 1070 | 230 | 3.39 |
| 8 | 8.1 | 40.2 | 20.1 | 20 | 940 | 310 | 170 | 1250 | 170 | 7.35 |
| 9 | 8.2 | 41.3 | 20.8 | 20 | 880 | 260 | 140 | 1140 | 140 | 8.14 |
| 10 | 8.4 | 46.4 | 23.1 | 10 | 970 | 320 | 230 | 1290 | 230 | 5.61 |
| 11 | 8 | 133.2 | 67 | 60 | 950 | 280 | 230 | 1230 | 230 | 5.35 |
| 12 | 8.4 | 54.5 | 27.3 | 20 | 940 | 240 | 180 | 1180 | 180 | 6.56 |
| 13 | 8.1 | 37.7 | 23.8 | 30 | 940 | 220 | 180 | 1160 | 180 | 6.44 |
| 14 | 8.5 | 49.5 | 24.6 | 20 | 950 | 230 | 150 | 1180 | 150 | 7.87 |
| Average | 8.2 | 59.2 | 30.3 | 31.3 | 917.5 | 262.5 | 188.8 | 1187.5 | 188.8 | 6.3 |
| Std Dev. | 0.2 | 31.7 | 15.6 | 21.7 | 65.0 | 37.3 | 36.8 | 68.8 | 36.8 | 1.6 |
| Downstream Catchment | ||||||||||
| 15 | 8.1 | 52.7 | 26.4 | 20 | 970 | 350 | 230 | 1320 | 230 | 5.74 |
| 16 | 8 | 52.9 | 26.3 | 20 | 950 | 270 | 270 | 1220 | 270 | 4.52 |
| 17 | 8.1 | 52.3 | 26.2 | 30 | 940 | 320 | 250 | 1260 | 250 | 5.04 |
| Average | 8.1 | 52.6 | 26.3 | 20.0 | 953.3 | 313.3 | 250.0 | 1266.7 | 250.0 | 5.1 |
| Std Dev. | 0.1 | 0.2 | 0.1 | 0.0 | 12.5 | 33.0 | 16.3 | 41.1 | 16.3 | 0.5 |
Table 1: Physico-chemical content along the Sondu-miriu River.
| SN | pH | EC (µScm-1 ) | TDS (ppm) | TSS (ppm) | NO3-N (µgL-1) | NH4-N (µgL-1) | PO4-P (µgL-1) | DIN (µgL-1) | DIP (µgL-1) | DIN/DIP |
| Upstream Catchment | ||||||||||
| 1 | 7.7 | 414 | 208 | 547 | 500 | 180 | 848 | 680 | 848 | 0.8 |
| 2 | 7.9 | 312 | 156 | 820 | 400 | 240 | 783 | 640 | 783 | 0.82 |
| 3 | 7.8 | 389 | 194 | 373 | 400 | 160 | 1012 | 560 | 1012 | 0.55 |
| Average | 7.8 | 371.7 | 186.0 | 580.0 | 433.3 | 193.3 | 881.0 | 626.7 | 881.0 | 0.7 |
| Std Dev. | 0.1 | 43.4 | 22.0 | 184.0 | 47.1 | 34.0 | 96.4 | 49.9 | 96.4 | 0.1 |
| Middle Stream Catchment | ||||||||||
| 4 | 8.7 | 572 | 287 | 200 | 600 | 150 | 979 | 750 | 979 | 0.77 |
| 5 | 8.5 | 510 | 252 | 387 | 940 | 700 | 979 | 1640 | 979 | 1.68 |
| 6 | 8.1 | 432 | 216 | 193 | 700 | 210 | 1012 | 910 | 1012 | 0.9 |
| 7 | 8.0 | 330 | 163 | 287 | 1000 | 890 | 1175 | 1890 | 1175 | 1.61 |
| 8 | 7.9 | 318 | 159 | 253 | 1250 | 1010 | 914 | 2260 | 914 | 2.47 |
| Average | 8.2 | 432.4 | 215.4 | 264.0 | 898.0 | 592.0 | 1011.8 | 1490.0 | 1011.8 | 1.5 |
| Std Dev. | 0.3 | 110.8 | 55.7 | 78.9 | 256.9 | 392.6 | 97.9 | 644.1 | 97.9 | 0.7 |
| Downstream Catchment | ||||||||||
| 9 | 7.7 | 215 | 109 | 2700 | 400 | 130 | 1175 | 530 | 1175 | 0.45 |
| 10 | 7.9 | 196.4 | 97.6 | 1967 | 680 | 170 | 457 | 850 | 457 | 1.86 |
| 11 | 8.0 | 309 | 155 | 1740 | 900 | 170 | 1175 | 1070 | 1175 | 0.91 |
| 12 | 7.8 | 152.8 | 77.6 | 67 | 400 | 210 | 783 | 610 | 783 | 0.78 |
| 13 | 8.7 | 98.5 | 49.2 | 13 | 800 | 120 | 587 | 920 | 587 | 1.57 |
| Average | 8.0 | 194.3 | 97.7 | 1297.4 | 636.0 | 160.0 | 835.4 | 796.0 | 835.4 | 1.1 |
| Std Dev. | 0.4 | 78.2 | 39.3 | 1201.6 | 229.1 | 36.1 | 331.0 | 222.9 | 331.0 | 0.6 |
Table 2: Physico-chemical parameters along from Simiyu-Duma River.
The water samples from the Sondu-Miriu were slightly acidic to alkaline. The pH ranged from 5.4 to 8.47 with mean pH of 7.8. The smallest pH value of 5.4 was recorded in sample 1. The soil near to the area where sample was collected was acidic with pH less than 5. Interaction of this acid soil with runoff might be the reason for lowering of pH. The influence of soil on water pH has also been reported by Vuai et al. [10]. Sample 14 had the highest pH; this sample was collected at the point near Sondu Hydroelectric Power Station (HEP). It is likely that cement deposition be responsible for pH elevation. Samples collected from Simiyu-Duma River were neutral to alkaline with pH range 7.67-8.66. The higher pH with narrow range was probable due the relatively higher pH of the catchment soil.
Total Suspended Solids (TSS): The TSS values for the Sondu-Miriu River range from 10 to 60 mgL-1 with the mean value of 29.4 mgL-1. The highest value of TSS was recorded in sample 7 which show that the sample contained the highest amount of total solid that could not pass through 0.45 μm filter. The smallest value was recorded in sample 10. Many of the samples along the river contained 20 and 30 mgL-1 of TSS. The WHO [11], guidelines recommend a limit at 1000 mgL-1 for drinking water. Generally, the water was clean and meets the WHO criteria for drinking water. On the other hand, the Simiyu-Duma River water was turbid. The TSS value was 13.3 mgL-1 in the Lake and raise to the maximum 2700 mgL-1 at the downstream. Three samples collected at lower catchment (sample no 11, 10 and 9) out of 13 did not meet WHO standard of drinking water.
Electrical Conductivity (EC) and Total Dissolved Solid (TDS): The conductivity of the samples ranged from 30 to 133 μScm-1 and the mean conductivity of the river was 50.18 μScm-1 for Sondu-Miriu river water. TDS ranged from 15.1 to 67 ppm with the mean value of 25.39 ppm. The highest values of conductivity and TDS were recorded in sample 11. The sampling point was from small stream feeding Sondu- Miriu Main River. The catchment of this stream indicates the presence of more weatherable minerals such as carbonate and Na-feldspar (Albite). The smallest values of conductivity, 30.18 μScm-1 and TDS 15.1 ppm, were recorded in sample 3 which was found at the upstream indicating the presence of less weather able mineral such as silicate.
In addition to that TDS increased progressively from up to downstream. These results suggest that intensive chemical weathering and probable physical weathering have been taking place at the upstream leaving only less weatherable minerals dominated by acidic components (H3O+, Al3+) in the soil exchangeable sites. Simiyu-Duma river catchment contains more weatherable minerals. The TDS value was 49 ppm in the Lake and increased to the maximum of 287 ppm along the river. The EC ranges from 98.5 μScm-1 to 573 μScm-1. The high EC and TDS values are characteristics of water draining carbonate terrain.
Nutrient characteristics of water samples
Trends of nutrient concentrations are shown in Table 1 and Table 2. Concentration of nitrate-nitrogen was the highest among the nutrients in all samples collected from all sampling sites in both rivers. The concentration was generally higher in the Sondu-Miriu River showing narrow range (770 μgL-1–970 μgL-1) compared to the Simiyu-Duma River (400 μgL-1-1250 μgL-1) with exception of two samples. Similar to the nitrate, ammonium-nitrogen concentration was relatively higher in the Sondu-Miriu River than in the Simiyu-Duma River with exception of two samples (Tables 1 and 2). The range was also narrow for the Sondu-Miriu (170 μgL-1-360 μgL-1) compared to the Simiyu-Duma River (120 μgL-1-1010 μgL-1). The higher content of nitrogen containing species may reflect the effect of agricultural activities including animal keeping since the samples were collected closer to the villages. The concentration of dissolved phosphate (PO4-P) in the Sondu-Miriu River ranged from 120 μgL-1 to 270 μgL-1 which was lower than that in the Simiyu-Duma (457 μgL-1-1175 μgL-1). Generally the nutrients showed narrow variations for the Sondu-Miriu River compared to the Simiu-Duma.
Spatial variation of nutrient: The water samples were collected at the upper, middle and lower catchment along the rivers to reflect the activities and land use/cover of the catchments. The results showed that there was no significant variation in the nitrate concentrations in the upper catchment, middle and lower catchment for the Sondu-Miriu River while phosphate-phosphorous concentrations showed statistical significant different at 90% confidence limit (P=0.09) between upper, middle and down catchments with progressive increase toward downstream (Figure 2). The population distribution shows increasing trend toward the river mouth. In addition to that, lower catchment sampling points were close to the villages where residents ferry animal to the other side of the river, in addition to other domestic activities such as washing. The observation emphasizes the importance of human activities on spatial distribution of these pollutants in the Sondumiriu river catchment. The nutrient analysis along the Simiyu-Duma river revealed that the concentrations were statistical different at 90% confidence limit for NO3-N (P=0.044) and NH4-N (P=0.041) between upper, middle and down catchment. The phosphate-phosphorous was almost the same between upper and middle catchments. In addition to that the results showed decrease in concentrations of all nutrients from middle to down catchment (Figure 3).
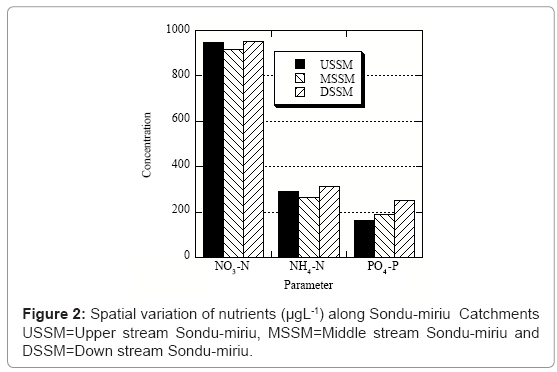
Figure 2: Spatial variation of nutrients (μgL-1) along Sondu-miriu Catchments USSM=Upper stream Sondu-miriu, MSSM=Middle stream Sondu-miriu and DSSM=Down stream Sondu-miriu.
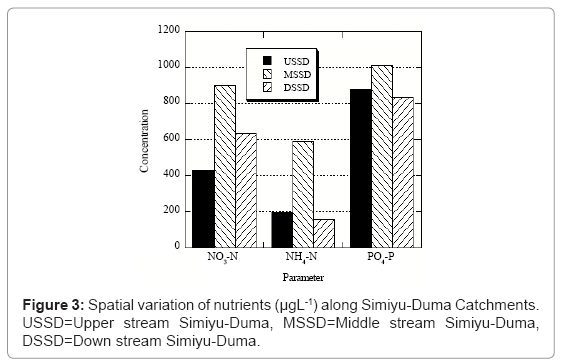
Figure 3: Spatial variation of nutrients (μgL-1) along Simiyu-Duma Catchments. USSD=Upper stream Simiyu-Duma, MSSD=Middle stream Simiyu-Duma, DSSD=Down stream Simiyu-Duma.
Land cover/use along the Simiyu-Duma River showed that there is dam and dense swamp between the middle and lower catchments. The reduction of concentration at the lower catchment is therefore attributed to the presence of swamps and dam which regulate the flow of water and probable remove some of the nutrients loading through retention in sediments, incorporation in the plant tissue and loose in the atmosphere through denitrification in the root zones in the aquatic plants. Kansiime et al. [12] reported decrease in nutrients level as the sewage outflow passed through vegetative wetland. The findings demonstrate the good value of vegetation for purification of receiving water along the river. It was also reported that the ability of wetland to retain the nutrient (P and N) depend on both dominant vegetation structure and the dispersion of the runoff water [13].
Sources of nutrient pollution
The dissolved inorganic nitrogen (DIN) concentration ranged between 1070 μgL-1 and 1320 μgL-1 while dissolved inorganic phosphorous (DIP) concentration ranged from120 μgL-1 to 270 μgL-1 for the Sondu-Miriu River. In the Simiyu-Duma River, concentration of dissolved inorganic nitrogen (DIN) ranged between 530 μgL-1 and 2260 μgL-1 while dissolved inorganic phosphorous (DIP) concentration ranged from 457 μgL-1 to 1175 μgL-1. The ratios of DIN species over DIP were significantly higher for the Sondu-Miriu River (3.4-10.8) than in Simiyu Duma (0.5-2.5) indicating either different sources or scavenging mechanisms among the two catchments. The sources of dissolved nitrogen containing species may be from domestic sewage, or via runoff from fertilized agricultural land Brodie and Mitchell [14], rainfall, remineralization process and in situ N-fixation by Cyanobacteria [15]. The possible sources of phosphorous include atmospheric deposition, from biomass burning and organic matter mineralization [6,16], detergent from laundering and runoff from soil surface. These sources alone cannot explain the large difference in concentrations as well as ratios. The soil analysis showed that extractable phosphorous from Simiyu-Duma river catchment was higher (average 14.7 mg kg-1; range 1.6-103 mg kg-1) compared to samples (average 5.7 mg kg-1; range 0.1- 21.8 mg kg-1) collected from Sondu-Miriu. The average total nitrogen was 0.23% ranging from 0.05 -0.53% and average 0.07 % ranging from 0.01-0.16 % for Sondu-Miriu and Simiyu-Duma catchments, respectively [17]. It can be suggested that the deference in nutrient contents of these rivers can mostly be explained by soil inheritance in which the soil water-interaction dominates their chemodynamic.
In both rivers, the lower catchments showed the lowest DIN/ DIP ratios compared to middle and upper catchments. This spatial variation cannot be explained by soil samples analyzed from those catchments alone. The lower catchment areas have high density of human settlements and people are using the water for domestic purposes including laundry and animal feeding which may contribute significant amount of phosphorous in the river water. The findings also emphasize the importance of population activities as a source of phosphorous. The results are consistent with that reported by Machiwa [6]. It was reported that DIN and DIP loadings from catchments and atmosphere have increased in both near shore and off shore areas and the primary cause of the nutrients enrichment was suggested to be the high population density in the catchments and all the associated human activities.
Nutrient loading and flux
Annual loads of nitrogen and phosphorous to Lake Victoria from river basins was calculated using equation 1.
Nutrient-load discharge (ty-1)=C (mgL-1)xV (m3y-1)x10-6………… …………………….(1)
Where:
C=the average concentration in the river water which was calculated as the mean of samples that were collected from down catchment near to the river mouth which were sample no. 9-13 for the Simiyu-Duma and sample no. 15-17 for the Sondu-Miriu.
V=average annual water discharge into the Lake Victoria that was estimated to be 40.3 and 34.1 m-3s-1 for the Sondu-Miriu and Simiyu- Duma, respectively ( COWI, 2002).
The results show that Sondu-Miriu river discharges 40 ty-1 and 7.9 ty-1 of dissolved inorganic nitrogen and phosphorous, respectively while the Simiyu-Duma River discharges 25 ty-1 and 26 ty-1, respectively. Although the water discharge is higher for Sondu-Miriu River, P loading is more than 3 times higher in the Simiyu-Duma than in the Sondu- Miriu. This indicates difference in sources or scavenging mechanism during transportation of these nutrients from the catchment to the rivers for these catchments. Among the factor contributing to the observed variation can be soil characteristics and nature of bed rock. Sondu Miriu catchment is overlain by quartz feldspars and granitic rock containing abundant ferric oxide (Katsurada, 2007). High iron content may hinder phosphorous mobility through binding with the metal.
Nutrient loading is also attributed with environmental degradation in the catchment area which leads to increase in soil erosion due to cultivation and over grazing in the catchment. It has been reported that cultivated land is increasing annual by 2.2% and overgrazing is currently exceed the sustainable grazing rate by factor of 5 (Kayombo and Jorgensen undated; Lake Victoria: Experience and Lesson Learned Brief World Bank Report). Increase in nutrients in the Lake water is associated to Lake Eutrophication and massive killing of fish as a result of anoxic condition. Water hyacinth which is common feature of the Lake Victoria is also associated with increase in nutrient loading.
The fluxes of nutrients discharged into Lake Victoria through different rivers were calculated using equation 2.
Flux discharge Rate=Nutrient discharge load (kmoly-1)/Area (km-2)……………... (2)
Nutrient discharge flux in Sondu-Miriu catchment as calculated in this study was 813 mol y-1km-2 and 72.5 mol y-1km-2 for dissolved nitrogen and phosphorous, respectively while for Simiyu Duma were 155 mol y-1km-2 and 73.4 mol y-1km-2.
Comparison of the pollution intensity in the two catchments showed that Sondu-Miriu is more than 5 times polluted with respect to nitrogen (Figures 2 and 3). Among the reasons attributed to this enrichment are high population density in Kenya side and their associated activities such as agriculture, animal keeping and industries. Kenya comprises only 16% of the Lake catchment, however it accommodate a total of 51 cities out of 87 cities located in the Lake basin. In addition to that population density is four times higher in the Sondu-Miriu catchment than in Simiyu-Duma [18]. Other factors which may also contribute to the higher nutrient flux in Sondu-Miriu are high rainfall, sediment transportation index and steep slope (Table 3) which may increase the nutrients transportation in dissolved form and undissolved form attached to particulate matters and soil sediments. The sediment can be long term point source of nutrient through dissolution under appropriate condition. Scheren et al. [19] also observed that BOD5 pollution was higher in the Lake Victoria catchment area in the Kenya side compare to Tanzania.
| Parameter | Sondu-miriu | Simiyu-Duma |
|---|---|---|
| Population density (personkm-2) | 220 ± 148 | 50 ± 26 |
| Rain (mm y-1) | 1415 | 804 |
| Sediment transport capacity index | 0.14 | 0.06 |
| Slope | 2.3 | 0.5 |
Table 3: Catchment Characteristics of Sondu-miriu and Simiyu-Duma rivers.
Conclusions
River waters were collected from Simiyu-Duma and Sondu-Miriu Rivers draining the Lake Victoria from Tanzania and Kenya sides, respectively. The results revealed higher concentrations of nutrients that may cause eutrophication. Consequently the problem of water hyacinth, deterioration of water quality and massive fish killing may continue to be threat to the health of the Lake ecosystem. Swamp and dam present at the middle catchment of the Simiyu-Duma River filtrate significant amounts of nutrients flowing to the downstream of the river. This land cover/use together with population distribution was found to explain the spatial variation of nutrients along the rivers. The results revealed that the catchment soil and rock are the major sources of the nutrients and their interaction with water dominate the transportation mechanism of the nutrients to the Lake Victoria through the Sondu- Miriu and Simiyu-Duma rivers. Generally the Sondu-Miriu showed higher nitrogen removal per unit area compared to the Simiyu-Duma catchment. The reasons were suggested to be inherent from the soil, less vegetation cover, higher population density, heavy rain and erodable soil.
Acknowledgements
This research work was financial supported by the Inter-University Council of East Africa through Lake Victoria Research Initiative (Vicres). We are grateful to Ms. Miza Ali Kombo, Mr. Ramadha, Mr. Azaria Maketu and Mr. Allean Stanford Rwakatare for their assistance during sample collection and analysis.
References
- Magunda MK, Majaliwa JGM, Kenywa MM, Misitwa F (2001) Runoff, soil and nutrient losses from Major Agricultural Land-use Practices in the Lake Victoria Basin, Uganda. Makerere University, Dept of soil science.
- Chokmani K, Gallichand J (1997) Use of indices to evaluate pollution potential at two Agricultural catchment basins. Canadian Agricultural Engineering 39: 113-122.
- Lung’ayia H, Sitoki L, Kenyanya M (2001) The nutrient enrichment of Lake Victoria (Kenyan waters). Hydrobiologia 458: 75-82.
- Odada EO, Olango DO, Kulindwa K, Ntiba M, Wandinga S (2004) Mitigation of Environmental Problems in Lake Victoria, East Africa: Causal chain and Policy Options Analyses. Ambio 33: 13-23.
- Soussa HK (2005) GIS-Based watershed modeling in the Nile basin countries. Nile Basin Capacity Building Network. World Bank report, Egypt.
- Machiwa P (2001) Assessment of pollution loading into Lake Victoria from terrestrial sources: the case of phosphorous. In: A paper presented at the National TechnicalWorkshop in Mwanza on 6-10 August, 2001.
- Rwetabula J, De Smedt F (2005) Landuse and Land Cover Mapping of the Simiyu Catchment (Tanzania) Using Remote Sensing Techniques. FIG Working Week 2005 and GSDI-8 Cairo, Egypt April 16-21.
- Meertens HCC, Lupeja PM (1996) A collection of agricultural background information for Mwanza Region. Kilimo/FAO plant nutrition programme in Tanzania. Field document No. GCPF/URT/106/NET, Mwanza Tanzania: 74’
- American Public Health Association (APHA) (1992) Standard methods for examination of water and wastewater. In: Greenberg AE, Clesceri LS, Eaton AD (eds). Washington, DC, USA.
- Vuai SA, Ishiki M, Tokuyama A (2003) Acidification of freshwaters by red soil in a subtropical silicate rock area, Okinawa, Japan. Limnology 4: 63-71.
- WHO (1984) Guidelines for drinking water quality Volume I and II Recommendation, health criteria and other supporting information. World Health Organization.
- Kansiime F, Kateyo E, Oryem-Origa H, Mucunguzi P (2007) Nutrient status and retention in pristine and disturbed wetlands in Uganda: management implications. Wetlands Ecology and Management 15: 453-467.
- Kansiime F, Nalubega M, van Bruggen JJ, Denny P (2003) The effect of wastewater discharge on biomass production and nutrient content of Cyperus papyrus and Miscanthidium violaceum in the Nakivubo Wetland, Kampala, Uganda. Water Science and Technology 48: 233-240.
- Brodie JE, Mitchell AW (2004) Nutrients in Australian tropical rivers: changes with agricultural development and implications for receiving environments. Marine and Freshwater Research 56: 279-302.
- Hecky R (1993) The eutrophication of Lake Victoria. Proceedig International Association of Theoretical and Applied Limnology 25: 39-48.
- Tamatamah RA (2002) Non-point sources loading for phosphorous to Lake Victoria from the atmosphere and rural catchment in Tanzania, East Africa. PhD Thesis University of Waterloo, Canada.
- Mungai NW, Njue AM, Abaya SG, Vuai SAH, Ibembe JD (2011) Periodic flooding and Land Use effects on soil properties in Lake Victoria Basin. African Journal of Agriculture 6: 4613-4623.
- Shepherd K, Walsh M, Mugo F, Ong C, Hansen TS, et al. (2002) Improved land management in the Lake Victoria basin: Linking land and Lake, research and extension, catchment and Lake basin, Technical report, International Center for Research in Agroforesty, ICRAF, Nairobi, Kenya.
- Scheren PAGM, Zanting HA, Lemmens AMC (2000) Estimation of water pollution sources in Lake Victoria, East Africa: Application and elaboration of the rapid assessment methodology. Journal of Environmental Management 58: 235-248.
Citation: Vuai SAH, Ibembe JD, Mungai N (2012) Spatial Variation 0f Nutrients in Sondu-Miriu and Simiyu-Duma Rivers: Implication on Sources and Factors Influencing their Transportation into the Lake Victoria. J Earth Sci Climate Change 3: 119. DOI: 10.4172/2157-7617.1000119
Copyright: ©2012 Vuai SAH, et al. This is an open-access article distributed under the terms of the Creative Commons Attribution License, which permits unrestricted use, distribution, and reproduction in any medium, provided the original author and source are credited.
Select your language of interest to view the total content in your interested language
Share This Article
Recommended Journals
Open Access Journals
Article Tools
Article Usage
- Total views: 16127
- [From(publication date): 7-2012 - Dec 23, 2025]
- Breakdown by view type
- HTML page views: 11268
- PDF downloads: 4859