Under-Five Mortality, Health and Selected Macroeconomic Variables: The Children behind the Digits
Received: 10-Feb-2012 / Accepted Date: 01-Mar-2012 / Published Date: 07-Mar-2012 DOI: 10.4172/2161-1165.1000115
Abstract
Background: Mortality is filled with studies that evaluated infant mortality, child mortality, and income distribution and mortality, but no single research in the English-speaking Caribbean has wholly examined child mortality, inflation, infant mortality, poverty and economic crisis as well as modeling those phenomena.
Objectives: This work bridges the gap in the literature by assessing by modeling child mortality, inflation, infant mortality, poverty, and economic crisis as well as the appropriateness of linear modeling in addition to an assessment of under-five age-specific mortality.
Methods: This work uses data collected from various Jamaican government departments’ publications. Data were entered and stored into Statistical Packages for the Social Sciences (SPSS) for Window version 17.0 (SPSS Inc; Chicago, IL, USA) as well as Microsoft Excel to analyze the data. Pearson’s product Moment Correlation was used to assess the bivariate correlation between particular macroeconomic and other variables, and Ordinary least square regression analyses were used to establish the model for 1) log Infant mortality rate and 2) log child mortality rate.
Results: Infant mortality rate (IMR) over the last 100 years is best fitted by an inverse exponential function (R2 = 0.97) as well as child mortality rate (CMR; R2 = 0.91). Infant mortality rate is influenced by health care utilization (b= -0.004, 95%CI: -0.01 – 0.01) and GDP (b = -1.960, 95% CI: -0.52 – 0.07), and the two factors account for 55% of the variance in IMR. The factors that are correlated with child mortality rate are log poverty ((b =0.22, 95% CI: 0.33 – 0.40) and GDP per capita (b = -2.66, 95% CI: -5.07 – -0.25). Those factors account for 90% of the explanation of changes in CMR. During economic recession IMR and CMR decline and opposite is true in periods of economic growth.
Conclusion: This work provides a basis public health actions and programmes.
Keywords: Child mortality rate, Infant mortality rate, Age-specificdeath rate, Macroeconomic indicators, Health seeking behaviour, Jamaica
159075Introduction
The study of mortality dates back to the seventeenth century [1-3]. Graunt’s [1] work on the ‘Bill of mortality’ sets a premise for the establishment of mathematical modeling in the area of mortality. In the nineteenth century, Gompertz [4] developed a mathematical formula that estimated mortality at different ages. Gompertz’s [4] theory established that mortality increases at geometric progression at a particular age and forwarded that this can be represented by a mortality risk function μ(x) = α. eβx. It follows that log of the death rate ln[μ(x)] is a linear function of age - ln[μ(x)] = ln (α) + βx. Gompertz’s [4] theory underlines purging mortality of accidental or infectious causes [5]. He believed that those causes act independently of age, which explained Makeham’s [6] suggestion of including a constant to address the limitation of Gompertz’s [4] law- μ(x) = α. eβ + γ. Although later studies have rebuffed Gompertz [4] or Makeham’s [6] function that it does not hold true at older ages and that it overly estimated mortality at older ages (80+ years) [7,8], the work has laid the foundation upon which many studies have been framed [9]. The life tables is one of the creations that emerged from mortality statistics [10,11], which was used to indicate life expectancy or health of a population.
The literature speaks to decreasing mortality at younger ages, Bourgeois-Pichat [12,13] proposed disaggregating infant mortality in endogenous and exogenous (accidents or infections) components and fitted this by the formula: q(n) = a + b[ln(n+1)]3, where a is a constant denoting the endogenous process, cumulative death in the cohort by age n (in days). Modifications are well documented in the literature to Bourgeois-Pichat’s [13] work, which guide contemporary studies in the area. Examining child health, using infant and child mortality rates in Peru, Paxson and Schady [14] found that infant mortality increased during economic crisis and that infant and child mortality followed a collinear pattern over the studied period (1978-to-1999). Paxson and Schady [14] like early scholar fitted infant mortality rates with linear models for each year of birth: Mit = α + Xitβit + εit , where Mit is child born in year t to mother I died in the first year of life, Xit is maternal characteristics (level of schooling, age, area of residence) and the error term, εit.
The earlier pioneers are still guiding the directions of contemporary scholarships. In 1992, Waldmann [15] assessing infant mortality and income, used log (infant mortality) = β log (Nonrich Income) + γRich Share. He modified the early model as follows: log (infant mortality) = β0 + β1 log (Poor Income) + β2log(Middle Income) + γRich Share + δYear 1970. Using the aforementioned model, Waldmann [15] found a positive correlation between log(Poor income) and log infant mortality and a negative one for log middle income and log infant mortality.
There is documentary evidence on infant mortality, income, economic crisis and other socioeconomic conditions (maternal selection, age, education of mothers, area of residence, health care utilization, household consumption, crime) [14,15], and Paxson and Shady [14] spoke about the quality of data on infant mortality in Peru. The quality of data on infant mortality affect not only the analysis, it creates a distorted outcome of reality from faulty data. The WHO’s ICD classification on data indicated that a completeness of 70-90% denotes medium quality data [16], which is the case for Jamaica [17,18]. In 2010, the Statistical Institute of Jamaica [19] opined that 4 out of every 5 infant deaths were estimated in the year the child was born and that the remaining was born in the previous year. The quality of infant mortality data in Jamaica is relatively reliable unlike what obtains in Peru [14].
The literature has provided empirical evidence that infant mortality data for Jamaica can be used to compare with those of other nations, by extension birth and death statistics [19]. It is documented that infant mortality is inversely related to economic recession in the United States, with the explanations being changes in maternal behaviour, composition of women giving birth and decline in air pollution [20-22]. The studies on infant mortality in Jamaica have not been on different explanatory variables as recession, maternal selection, age, education of mothers, area of residence, health care utilization, household consumption, and crime [17,18,23-25], which gives nothing for comparison with the literature. In 1992, the United Nations conducted a study on child mortality in the developing nations, including Jamaica [26], which provided a comprehensive assessment among many nations. Like other studies on Jamaica, many of the identified variables were not examined in the United Nations’ work. However, using illness rate, child diarrhoea and body mass index, Kim and Serra-Garcia [27] found that in Jamaica illness and child diarrhoea rates increase in economic downturns.
The data is available on infant mortality in Jamaica, yet no study is forthcoming on infant mortality, inflation, poverty, health care use, child mortality, gross domestic product (GDP) per capita growth, and the economic crisis. There is no empirical work that has examined in a single study the aforementioned variables as well as evaluates linearity or collinearity of 1) infant mortality, 2) child mortality, 3) inflation and infant mortality or child mortality rates, 4) health care utilization and infant mortality or child mortality rates, 5) poverty and infant mortality or child mortality rates, 6) age-specific mortality rates of children < 5 years old, 7) illness rate and infant or child mortality rates, 8) infant and child mortality rates, and 9) shifts in trends of infant and child morality. The present paper bridges the gap in the literature by examining all the previous mentioned issues, using data from 1988-to- 2009 and from 1900-to-2000.
Methods
Empirical model
The model that is used to determine factors which account for infant mortality rates and child mortality rates is embodied in Waldman’s [15] theory. Waldman’s [15] theorized that log (infant mortality) = β0 + β1 log (Poor Income) + β2log(Middle Income) + γRich Share + δYear 1970.
For this research, log infant mortality (IMR) was expressed in eqn. (1), log child under 5 mortality rate (CMR) was modeled in eqn. (2), and logillness rate in eqn. (3):
LogIMR = β0 + β1GDP per capita growth + β2HSB + Ui (1)
Log CMR = β0+β1ln(poverty)+β2ln(Unemployment rate)+β3GDP per capita growth+β4(Illness rate) + Ui (2)
lnIllness rate = β0 + β1ln(poverty) + β2ln(Unemployment rate) + β3GDP per capita growth + Ui (3)
Where health seeking behavior (or health care utilization, HSB), β0 is the constant and β1-2 are coefficients of factor, and Ui represents the error term.
Using 20-year data from 1900-2010, equations (4) and (5) model different under-five mortalities.
IMR = αxβ (4.1)
It can be deduced from equation (4.1), that by natural logging both sides of the eqn. would give:
lnIMR = ln(α) + βlnx (4.2)
CMR= αxβ (5.1)
It can be deduced from equation (5.1) that by natural logging both sides of the eqn. would give:
lnCMR = ln(α) + βlnx (5.2)
where β is negative value
Using 5-year data from 1960-2005, IMR was modelled within the context of the data – Eqn. (6):
CMR= ax2 +bx +c (6)
Where is c is a constant, ‘a’ and ‘b’ represent coefficients of x, and x being time interval.
Using annual data from 1989-2009, IMR and CMR were modelled which are expressed in Eqns (7) and (8):
IMR= ax + c (7)
CMR= ax + c (8)
Where c is a constant, ‘a’ represents coefficients of x, and x being time interval.
Data source and management
The current work is a secondary data analysis, which collated data from various Jamaican Government Publications. Data sources were from Jamaica Survey of Living Conditions (JSLC) [28] on health care utilization (or health care seeking behaviour), illness rate and poverty; Economic and Social Survey of Jamaica on poverty [29]; and Statistical Digest on inflation [30]. The period for this work is from 1989-to-2009 and 1900-to-2000.
The JSLC is a jointly conducted by the Planning Institute of Jamaica (PIOJ) and the Statistical Institute of Jamaica (STATIN) [28]. The JSLC is a nationally representative cross-sectional descriptive surveys drawn using stratified random sampling and comprised data on households’ characteristics, health, education, expenditure, social programmes, and other information. An administered questionnaire is to collect the data, and it is modelled from the World Bank’s Living Standards Measurement Study (LSMS) household survey [31]. There are some modifications to the LSMS, as JSLC is more focused on policy impacts.
The Economic and Social Survey of Jamaica (ESSJ) is publication which collates information on social and economic indicators of Jamaica. It is a publication by the Planning Institute of Jamaica. We collected data mainly on unemployment rate in Jamaica from 1989 to 2009 [29].
Annual inflation rates for Jamaica were collected from Bank of Jamaica’s (BoJ’s) publication [30] and the Gross Domestic Product (GDP) information was had from the International Monetary Fund’s World Economic Outlook [32].
A data appendix accompanies this work that provides the conceptual definition of the main terms used in this paper.
Some abbreviations will be used throughout this work. They are CDR (crude death rate); IMR (infant mortality rate); CMR (child mortality rate); GDP per capita growth (gross domestic product).
The macroeconomic variables (inflation, poverty, unemployment and GDP) as well as infant and child mortalities were for a 12-month period, ending December of each calendar year.
According to the Statistical Institute of Jamaica, “Under 5 Mortality Rate, according to the Statistical Institute of Jamaica is “The probability that a child born in a specific year or time period will die before reaching the age of five, if subject to current age-specific mortality rates. Expressed as a rate per 1,000 live births [19], which is the used in this paper.
Child mortality rate is the probability of dying between the exact ages of one and five, if subject to current age-specific mortality rates. The probability is expressed as a rate per 1,000.
Infant mortality rate is the number of deaths of infants (less than 12 months) per 1000 of live births during a given period of time.
Illness rate is the percentage of Jamaicans who indicated having an illness in the survey year of the cross-sectional survey [28].
Under-five age-specific mortality rate (ASDR) is the total number of deaths of children under 5 years with respect to total mortality per 1000 (or measures the occurrences of deaths at ages less than 5 years).
Statistical analyses
Data were entered and stored into SPSS for Window version 17.0 (SPSS Inc; Chicago, IL, USA) as well as Microsoft Excel to analyze the data. Pearson’s product Moment Correlation was used to assess the bivariate correlation between particular macroeconomic and other variables such as health care utilization and self-reported illness. Scatter diagrams and best fit models were used on the data. Ordinary least square regression analyses were used to establish the model for 1) log Infant mortality rate and 2) log child mortality rate. Ordinary least square regressions were utilized to analyze the possible explanatory variables. A p-value ≤ 5% was chosen to indicate statistical significance. The final model was based on those variables that were statistically significant (p ≤ 0.05). In any instance where collinearity existed (r > 0.7); the variables were entered independently into the model (Forward Stepwise method) to determine as to which of those should be retained during the final model construction. The final decision on whether or not to retain the variables was based on the variables’ contribution to the predictive power of the model and its goodness of fit. Each scatter plot was modeled by a linear, power, exponential or polynomial best fit function based on the data, with the aid of Excel. And SPSS was used to validate the results of Microsoft Excel.
Results
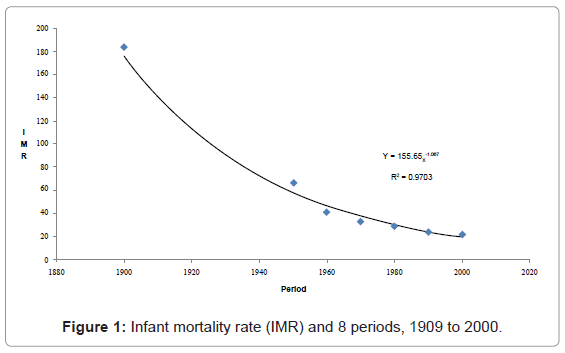
Figure 1 depicts the infant mortality rate for the past 120 years in Jamaica. The diagram shows that IMR is best fitted by a non-linear curve. Since the 1960, IMR has been declining at a decreasing rate. IMR has exponentially declined between the early 1900s and late 1960s and beyond.
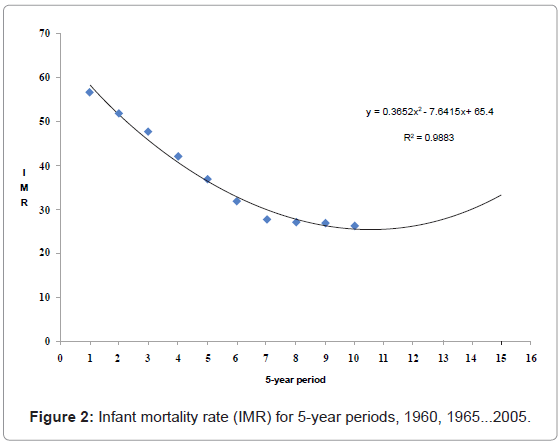
Figure 2 illustrates infant mortality rate from 1960 in a 5-year period. The data is best fitted by a 2-degree polynomial function indicating that the rate of change in IMR is non-linear – decreasing slope (or decreasing rate of change as the years increase).
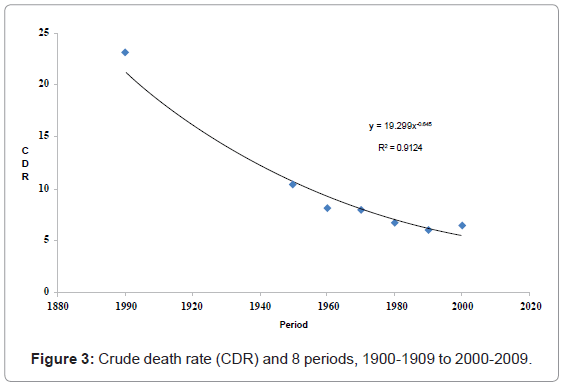
During the early twentieth century, crude death rate in Jamaica has been declining at an increasing rate, and then after 1950s, the rate has reducing at a decreasing rate (Figure 3).
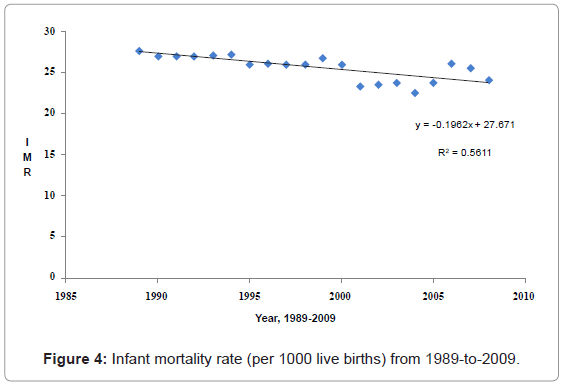
The rate of change for IMR for 1989-to-2009 on average has been declining at an arithmetic progression (Figure 4).
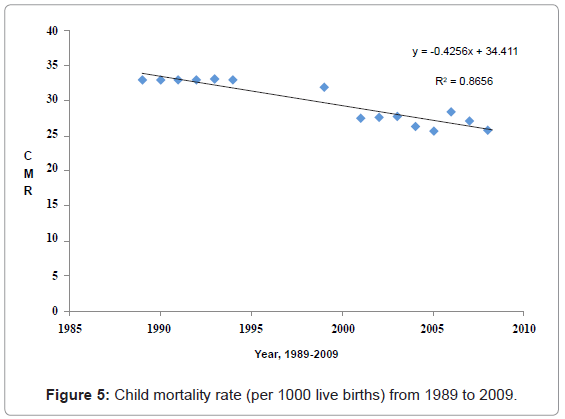
Since 1989, CMR in Jamaica has been decreasing on average by an arithmetic rate (Figure 5).
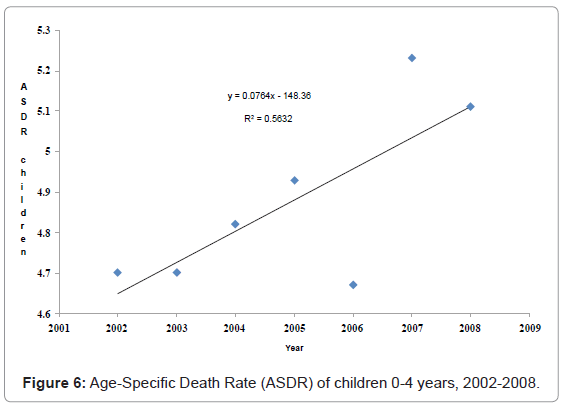
Figure 6 depicts age-specific death rate (ASDR) of children under 5 years old from 2002 to 2009. There was an unusual decline in ASDR in 2006 compared to previous years as well as an increase the following years.
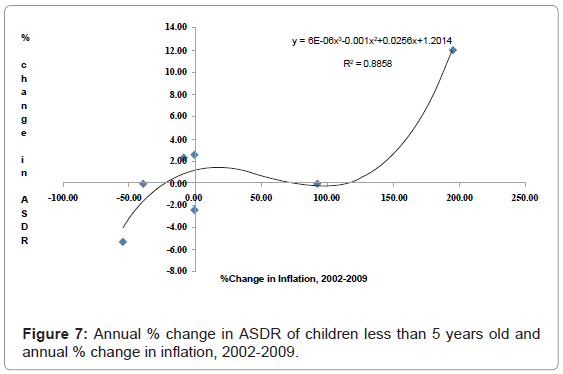
Figure 7 depicts that during decline in inflation rate ASDR increases, reaches a peak then begins to fall. However, a drastic increase in inflation by over 100% sees an exponential rise in ASDR.
Table 1 displays the correlation of many variables. Strong associations existed between log CMR and log Poverty (rx = 0.767, P = 0.0001), log IMR and log CMR (rx = 0.896, P < 0.0001), and health care utilization and log CMR (rx = -0.793, P < 0.0001).
| HSB | lnInflation | lnPoverty | lnIMR | lnCMR | lnUnemployment | Illness rate | ||
|---|---|---|---|---|---|---|---|---|
| HSB | Pearson Correlation | 1 | -0.673** | -0.753** | -0.534* | -0.793** | -0.412 | -0.494* |
| Sig. (2-tailed) | 0.001 | 0.000 | 0.015 | 0.000 | 0.063 | 0.023 | ||
| N | 21 | 21 | 21 | 20 | 15 | 21 | 21 | |
| lnInflation | Pearson Correlation | -0.673** | 1 | 0.677** | 0.508* | 0.696** | 0.350 | 0.220 |
| Sig. (2-tailed) | 0.001 | 0.001 | 0.022 | 0.004 | 0.120 | 0.338 | ||
| N | 21 | 21 | 21 | 20 | 15 | 21 | 21 | |
| lnPoverty | Pearson Correlation | -0.753** | 0.677** | 1 | 0.506* | 0.767** | 0.473* | 0.215 |
| Sig. (2-tailed) | 0.000 | 0.001 | 0.023 | 0.001 | 0.030 | 0.350 | ||
| N | 21 | 21 | 21 | 20 | 15 | 21 | 21 | |
| lnIMR | Pearson Correlation | -0.534* | 0.508* | 0.506* | 1 | 0.896** | 0.111 | 0.163 |
| Sig. (2-tailed) | 0.015 | 0.022 | 0.023 | <0.0001 | 0.640 | 0.493 | ||
| N | 20 | 20 | 20 | 20 | 15 | 20 | 20 | |
| lnCMR | Pearson Correlation | -0.793** | 0.696** | 0.767** | 0.896** | 1 | 0.156 | 0.277 |
| Sig. (2-tailed) | <0.0001 | 0.004 | 0.001 | <0.0001 | 0.578 | 0.318 | ||
| N | 15 | 15 | 15 | 15 | 15 | 15 | 15 | |
| lnUnemployment | Pearson Correlation | -0.412 | 0.350 | 0.473* | 0.111 | 0.156 | 1 | 0.621** |
| Sig. (2-tailed) | 0.063 | 0.120 | 0.030 | 0.640 | 0.578 | 0.003 | ||
| N | 21 | 21 | 21 | 20 | 15 | 21 | 21 | |
| Illness rate | Pearson Correlation | -0.494* | 0.220 | 0.215 | 0.163 | 0.277 | 0.621** | 1 |
| Sig. (2-tailed) | 0.023 | 0.338 | 0.350 | 0.493 | 0.318 | 0.003 | ||
| N | 21 | 21 | 21 | 20 | 15 | 21 | 21 |
*Correlation is significant at the 0.05 level (2-tailed)
HSB denotes health care seeking behaviour (or health care utilization)
Table 1: Correlation of log CMR, log Poverty, log IMR, log Inflation, health seeking behavior, GDP per capita growth and log unemployment.
Of the variables used, two factor emerged as explaining log infant mortality rate (GDP per capita growth), which account for 55% of the variability in log IMR (Table 2).
| Characteristic | B coefficient | Std. Error | beta | P value | CI (95%) |
|---|---|---|---|---|---|
| Constant | 3.231 | 0.491 | 0.000 | 2.15 - 4.31 | |
| HSB | -0.004 | 0.002 | -0.532 | 0.023 | -0.01 - 0.01 |
| Log Inflation | 0.018 | 0.030 | 0.211 | 0.562 | -0.05 - 0.09 |
| Log Poverty | 0.105 | 0.076 | 0.583 | 0.192 | -0.06 - 0.27 |
| GDP per capita | -1.960 | 0.980 | -0.508 | 0.05 | -4.12 - 0.20 |
| Log unemployment | -0.224 | 0.135 | -0.499 | 0.125 | -0.52 - 0.07 |
| Illness rate | 0.017 | 0.010 | 0.609 | 0.126 | -0.01 - 0.04 |
Adjusted R2 = 0.30
F statistics = 9.396, P = 0.008
Dependent variable: log IMR
The statistical significant variables (P ≤ 0.05) are highlighted in purple
Table 2: OLS regression on variable that explain (or not) log IMR.
Log child under 5 mortality rates is accounted for by log unemployment (p< 0.05), log poverty (P< 0.05), log GDP per capita (P < 0.05) and illness (P = 0.05) (Table 3).
| Characteristic | B coefficient | Std. Error | beta | P value | CI (95%) |
|---|---|---|---|---|---|
| Constant | 3.28 | 0.492 | 0.001 | 2.08 - 4.49 | |
| HSB | 0.00 | 0.004 | -0.71 | 0.836 | -0.01 - 0.01 |
| Log Inflation | 0.03 | 0.029 | 0.26 | 0.289 | -0.04 - 0.10 |
| Log Poverty | 0.22 | 0.075 | 0.86 | 0.028 | 0.33 - 0.40 |
| Log Unemployment | -0.39 | 0.126 | -0.63 | 0.022 | -0.70 - -0.08 |
| GDP per capita growth | -2.66 | 0.984 | -0.35 | 0.035 | -5.07 - -0.25 |
| Illness rate | 0.03 | 0.012 | 0.61 | 0.05 | 0.00 – 0.06 |
Adjusted R2 = 0.81
F statistics = 9.396, P = 0.008
Dependent variable: log CMR
The statistical significant variables (P ≤ 0.05) are highlighted in purple
Table 3: OLS of variable that explain (or not) log CMR.
Table 4 presents information on selected macroeconomic variables as well as health care utilization and their influence (or otherwise) on log self-reported illness rate (or lnillnessrate). Of the five (5) variables used in the model, three (3) emerged as statistical significant factors – lnpoverty (P = 0.028); lnunemployment (P = 0.021), and GDP per capita (P = 0.028). Unemployment and GDP are directly correlated to illness rate, with poverty being inverse associated with illness rate. The three (3) factors account for 60 percentage points of the variance in log illness rate.
| Characteristic | Unstandardized Coefficients | Std. Error | beta | P | 95% CI |
|---|---|---|---|---|---|
| lnPoverty | -0.337 | 0.136 | -0.624 | 0.028 | -0.632 - -0.042 |
| lnUnemployment | 0.541 | 0.205 | 0.514 | 0.021 | 0.097 - 0.984 |
| GDPpercapita | 4.424 | 1.785 | 0.412 | 0.028 | 0.569 - 8.280 |
| HSB | -0.012 | 0.007 | -0.487 | 0.105 | -0.027 - 0.003 |
| lnInflation | 0.011 | 0.069 | 0.040 | 0.879 | -0.139 - 0.160 |
Table 4: Ordinary least square (OLS) regression of selected macroeconomic variables and logillness rate.
Discussion
Kim and Serra-Garcia [27] found that “illness rates and child diarrhea rates increase during economic downturns”. Like Kim and Serra-Garcia [27], this work highlighted that the association between child’s health and GDP per capita growth is a mixed one. In the present study, during an economic downturn child morality as well as infant mortality rates declines and these increases in periods of economic growth. This is contrary to the findings in Paxson and Schady [14] that found that infant mortality increased during the crisis of the 1980s in Peru. However, this study’s result support those found in the United States [20-22]. Chay and Greenstone [20] and other studies [22,23] opined that the reasons for the decline in infant mortality were owing to maternal behaviour, changes in the composition of women giving birth, air pollution and this paper is adding reduction in poverty and illness rate.
Macroeconomic variables like poverty, unemployment and GDP per capita growth were found to be correlated with child mortality rates in this study, but only GDP per capita emerged as a factor of infant mortality rates. The illness rate in the Jamaican population is positively correlated with child mortality rate, which does not influence infant mortality rate. Clearly, when Smith and Kington [33] postulated that money can buy good health could seem like a logical explanation at the time for greater life expectancy in developed nations, particularly the United States, cannot be wholesalely used to interpret better health status of those with more income. When Marmot [34] examined income and health in developed nations, using the United States, refuted the arguments of Smith and Kington when as said that “Richard Wilkinson drew attention to the apparent contradiction, set out above, that when comparing rich countries, there is little relationship between average income and life expectancy, yet within these countries there is a close relationship between individuals’ incomes and their life expectancy and mortality” and that “…, the lack of relationship between mean income and a country’s life expectancy was because a country’s mean income did not convey the same meaning as the relative income level of people within a country”.
This research concurs with Marmot as during economic growth, under-5 mortality and infant mortality rates increase and vice versa in periods of economic downturn. It can be concluded herein that this refutes Smith and Kington’s [33] argument that money is good for health. Although it provides access to better resources, this does not translate to better health among children in Jamaica. However, there are some merits to Smith and Kington’s [33] postulations as in this work there is a strong negative association between poverty and health seeking behaviour, a direct relationship between poverty and unemployment, and unemployment and illness rate. Unemployment which is greater among the poor than the non-poor in many societies is equally influencing the illness rate of the population, and higher rate of illness is impacted by money, suggesting that the lack of money (or access to it) is detrimental to child’s health as was found between inflation and age-specific mortality in this work. With the positive correlation between inflation and poverty in this study, the latter should offer some explanation to the poverty-illness discourse.
The association between poverty and illness is well documented in the literature. The WHO indicated that 4 out of every 5 people with chronic illnesses were in developing countries and that 3 of every 5 global mortalities are caused by chronic illness [35]. This implies that there is an association between poverty and chronic illness, social deprivation and mortality and money and good or bad health [36]. The current work found that the most influential factor influencing illness rate in Jamaica is poverty followed by unemployment and GDP per capita growth. This should not be surprising as lack of money retards choices, opportunities, health care utilization and nutritional intakes [37-39]. Poverty which mars opportunities and health care use of women will influence child’s birth, infant and child mortality. The survivability of infant or children under 5 years is dependent on the nutritional intake of the women during child birth, air pollution (physical environment), health care utilization, finances, educational level, age and poverty of the mother. Such issues provide justifications for worsen health during economic crises [40-43] and that Dollar and Kraay’s [44] postulation that growth is good for the health of the poor has some merit. Unlike the literature, the present work found that poverty is inversely related to illness as well as negatively correlated with child mortality rate and not statistical associated with infant mortality rate, suggesting poverty argument is complex and cannot be used to explain infant mortality rate in Jamaica.
The value of Dollar and Kraay’s [44] statement is based on 1) the increased employment, 2) greater income and money, 3) more choices, 4) increased health care utilization, 5) reduced poverty, and 6) greater nutritional intake and quality foods, which all have a role in raising health outcome. A paradox emerges in this work as there is an upward movement in under-five mortality and infant mortality rates during economic expansion, which is not in keeping with Dollar and Kraay’s [44] perspective. With particularly results arising from economic expansion, it appears ironic that in prosperous times that health of children will be lowered than in economic recession. The positive correlation between increased child or infant mortality and economic growth is not limited to Jamaica, as there is evidence to support this in other jurisdictions [20-22]. Paxson and Schady [14] found a high elasticity of infant mortality and income (0.64), suggesting that economic expansions supports greater infant mortality rates. The empirical evidence from the literature concurs with the present findings that growth is ‘bad’ for children’s health as well as the general populace.
Under-five mortality and infant mortality rates have been declining at an increasing proportion for 1900-to-1950 (geometric progression) and since the 1960s, the rates have been decreasing at an arithmetic progression. It can be extrapolated from the findings that the introduction and utilization of penicillin – discovery attributable to Scottish scientist and Nobel laureate Alexander Fleming in 1928- has made significant changes to the number of deaths of children in the world as well as owing to the industrial and technology revolution. Since the early 1900s at period of high prevalence and incidence of infectious diseases, the use of penicillin and advancement in public health measures such as sanitation, food and water quality, there is a transition from infectious to degenerate diseases, which account for the change in under-5 mortality in Jamaica. There is relative consistency in the decline in infant mortality and child mortality rates in Jamaica which is not the same in Peru [14]. Peru has experienced more volatility in its infant and child mortality from 1978 to1998 compared to Jamaica that has seen a constant decline for the same period. Like in many developing nations (Puerto Rico, Philippine, Rwanda, Senegal) [26], infant mortality rate in Jamaica has changed its rate of deceleration from the pre-1970s value to the post-1970s, which was also observed for the United States [45]. In Jamaica, the new path suggests that there is a likely increase in infant mortality in the future. On examining underfive age-specific mortality, statistics revealed this has shown volatility over the past 8 years (2002-2009), indicating the health of children.
Conclusion
The continuous decline in infant and under-five mortality rates in Jamaica speaks to the improvement in overall life expectancy and health of the populace. Despites the improvements in infant and child mortality that have been noted in this research, some of the positives can be eroded with increased poverty and economic expansion, and lowered health care utilization. These findings provide a barometer of children’s well-being in Jamaica, the role of particular macroeconomic parameters on their health, and the challenges that must be addressed in economic expansion.
In summary, macroeconomic variables influence (or not) under-5 mortality in different ways and attention must be placed on poverty, inflation, GDP and unemployment as these provide public health specialists and policy makers with a comprehensive understanding of the working of those measures, and how to structure programmes in keeping with their changes.
Limitation
The author did not validate the accuracy of the data source. However, other scholars have examined death data from which modifications have been done. No validations have been carried out on inflation, poverty and unemployment. Over the years poverty calculations have been assessed, reassessed and modified in keeping with new revelations. While the macroeconomic variables (inflation, poverty, unemployment and GDP) and mortality reflect figures for a 12-month period –ending December of each calendar year - selfreported illness and health care utilization are for a 4-week period in the survey year.
References
- Graunt J (1939) Natural and political observations mad upon the Bills of Mortality. Johns Hopkins University Press, Baltimore, USA.
- Halley E (1693) An Estimate of the Degrees of the Mortality of Mankind, Drawn from Curious Tables of the Births and Funerals at the City of Breslaw; With an Attempt to Ascertain the Price of Annuities upon Lives. By Mr. E. Halley, R.S.S. Phil Trans 17: 596-610.
- Deparcieux A (2011) Essai Sur Les Probabilités De La Durée De La Vie Humaine. Nabu Press, France.
- Gompertz B (1825) On the Nature of the Function Expressive of the Law of Human Mortality, and on a New Mode of Determining the Value of Life Contingencies. Phil Trans R Soc Lond 115: 513-583.
- Preston SH, Heuveline P, Guillot M (2001) Demography: Measuring and modelling population processes. Blackwell Publishers, Massachusetts, USA.
- Makeham WM (1860) On the Law of Mortality and the Construction of Annuity Tables. The Assurance Magazine and Journal of the Institute of Actuaries 8: 301-310.
- Vaupel JW (1997) The remarkable improvements in survival at older ages. Philos Trans R Soc Lond B Biol Sci 352: 1799-1804.
- Horiuchi S, Coale AJ (1982) A simple equation for estimating the expectation of life at old ages. Popul Stud (Camb) 36: 317-326.
- Perks W (1932) On Some Experiments in the Graduation of Mortality Statistics. Journal of the Institute of Actuaries 63: 12-57.
- Keyfitz N (1966) A Life Table that Agrees with the Data. J Am Stat Assoc 61: 305-312.
- Keyfitz N (1968) A Life Table that Agrees with the Data: II. J Am Stat Assoc 63: 1253-1268.
- Bourgeois-Pichat J (1946) De la mesure de la mortalité infantile. Population 1: 53-68.
- Bourgeois-Pichat J (1951) De la Mesure de la mortalitè infantile II, Les Causes de Dècès. Population 6: 459-480.
- Paxson C, Schady N (2005) Child health and economic crisis in Peru. The World Bank Economic Review 19: 203-223.
- Waldmann RJ (1992) Income Distribution and Infant Mortality. Q J Econ 107: 1283-1302.
- Mathers CD, Fat DM, Inoue M, Rao C, Lopez AD (2005) Counting the dead and what they died from: an assessment of the global status of cause of death data. Bull World Health Organ 83: 171-177.
- McCaw-Binns AM, Fox K, Foster-Williams KE, Ashley DE, Irons B (1996) Registration of births, stillbirths and infant deaths in Jamaica. Int J Epidemiol 25: 807-813.
- McCaw-Binns A, Holder Y, Spence K, Gordon-Strachan G, Nam V, et al. (2002) Multi-source method for determining mortality in Jamaica: 1996 and 1998. Pan American Health Organization.
- Chay KY, Greenstone M (2003) The Impact of Air Pollution on Infant Mortality: Evidence from Geographic Variation in Pollution Shocks Induced by a Recession. Q J Econ 118: 1121-1167.
- Dehejia R, Lleras-Muney A (2004) Booms, Busts, and Babies' Health. Q J Econ 119: 1091-1130.
- Ruhm CJ (2009) Economic conditions and health behaviors: are recessions good for your health? N C Med J 70: 328-329.
- Desai P, Hanna BF, Melville BF, Wint BA (1983) Infant mortality rate in three parishes of Western Jamaica, 1980. West Indian Med J 32: 83-87.
- Lindo J (2006) Jamaican perinatal mortality survey, 2003. Kingston, Canada.
- McKenzie HI, Lovell HG, Standard KL, Miall WE (1967) Child mortality in Jamaica. Milbank Mem Fund Q 45: 303-320.
- United Nations (1992) Child mortality since the 1960s: A database for developing countries.
- Kim N, Serra-Garcia M (2010) Economic crises, health and education in Jamaica. Estudios Económicos 25: 105-134.
- PIOJ, STATIN (1989-2011) Jamaica survey of living conditions, 1989-2010. PIOJ, STATIN, Kingston, Jamaica.
- PIOJ (1989-2010) Economic and Social Survey of Jamaica, 1988-2009. Kingston, Jamaica.
- International Monetary Fund (2009) World Economic Outlook April 2009. Washington, DC, USA.
- Smith JP, Kington R (1997) Demographic and economic correlates of health in old age. Demography 34: 159-170.
- Marmot M (2002) The influence of income on health: views of an epidemiologist. Health Aff (Millwood) 21: 31-46.
- WHO (2005) Preventing Chronic Diseases a vital investment. Geneva, USA.
- Van Agt HME, Stronks K, Mackenbach JP (2000) Chronic illness and poverty in The Netherlands. Eur J Public Health 10: 197-200.
- Sen A (1976) Poverty: An Ordinal Approach to Measurement. Econometrica 44: 219-231.
- https://www.unicef.org/spanish/about/execboard/files/Recovering_from_Economic_and_Finincial_crisis.pdf
- Bourne PA (2009) Impact of poverty, not seeking medical care, unemployment, inflation, self-reported illness, health insurance on mortality in Jamaica. North Am J Med Sci 1: 99-109.
- USAIDS (2010) Impact of global economic crisis on health in Africa. Africa’s health in 2010, Washington DC, USA.
- Horton R (2009) The global financial crisis: an acute threat to health. Lancet 373: 355-356.
- (2010) Impact of the Crisis on Health. 13th Meeting of the Africa Partnership Forum, Addis Ababa, Ethiopia.
- WHO (2008) Impact of the global financial and economic crisis on health.
- Dollar D, Kraay A (2001) Growth is Good for the Poor. The World Bank, Washington, DC, USA.
- Rowland DT (2003) Demographic methods and concepts. Oxford Press, New York, USA.
- Lantoine C, Pressat R (1984) Nouveaux aspects de la mortalité infantile. Population 39: 253-264.
Citation: Bourne PA (2012) Under-Five Mortality, Health and Selected Macroeconomic Variables: The Children behind the Digits. Epidemiol 2:115. DOI: 10.4172/2161-1165.1000115
Copyright: © 2012 Bourne PA. This is an open-access article distributed under the terms of the Creative Commons Attribution License, which permits unrestricted use, distribution, and reproduction in any medium, provided the original author and source are credited.
Select your language of interest to view the total content in your interested language
Share This Article
Recommended Journals
Open Access Journals
Article Tools
Article Usage
- Total views: 16803
- [From(publication date): 10-2012 - Dec 18, 2025]
- Breakdown by view type
- HTML page views: 11901
- PDF downloads: 4902

