Research Article Open Access
Cloning and Characterization of Physarum Endo-Beta-1,3-1,4-Glucanase-1 Expression in E. coli and Trichoderma reesei
Jian-Hua Zhang1,2#, Xiao-qing Li1#, Yong-Xia Zhang1, Miao Xing1,2, Sheng-Li Tian1* and Shi-De Liu1*1Shenzhen Key Laboratories of Microbial Genetic Engineering and Marine Sciences, College of Life Sciences Shenzhen University, Shenzhen 518060, China
2College of Life Sciences South China Agricultural University, Guangzhou 510642, China
#The authors made equal contribution to this work
- Corresponding Author:
- Sheng-Li Tian
Shenzhen Key Laboratories of Microbial
Genetic Engineering and Marine Sciences
College of Life Sciences Shenzhen
University, Shenzhen 518060, China
Tel: +86-755-26557245
Fax: +86-755- 26534274
E-mail: sltian@szu.edu.cn - Shi-De Liu
Shenzhen Key Laboratories of Microbial
Genetic Engineering and Marine Sciences
College of Life Sciences Shenzhen University
Shenzhen 518060, China
Tel: +86-755-26557245
Fax: +86-755-26534274
E-mail: liusd@szu.edu.cn
Received date: November 28, 2014; Accepted date: March 26, 2015; Published date: April 03, 2015
Citation: Zhang JH, Li XQ, Zhang YX, Xing M, Tian SL et al. (2015) Cloning and Characterization of Physarum Endo-Beta-1,3-1,4-Glucanase-1 Expression in E. coli and Trichoderma reesei. J Biotechnol Biomater 5:173. doi:10.4172/2155-952X.1000173
Copyright: ©2015 Zhang JH, et al. This is an open-access article distributed under the terms of the Creative Commons Attribution License, which permits unrestricted use, distribution, and reproduction in any medium, provided the original author and source are credited.
Visit for more related articles at Journal of Biotechnology & Biomaterials
Abstract
The endo-β-1,3-1,4-glucanases have been found widely in bacteria, fungi, algae and plants, and have been applied to the hydrolysis of barley β-1,3-1,4-glucans in the beer brewing industry. Here, we report a novel endo-β-1,3- 1,4-glucanase gene (PEGase1) isolated from Physarum polycephalum and expressed in E. coli, and Trichoderma reesei. The molecular weights of the proteins are 34 and 66 kDa respectively by SDS-PAGE analysis. Enzymatic assays show that recombinant PEGase1 expressed by T. reesei was more efficient when hydrolyzing barley β-1,3- 1,4-glucans specifically, suggesting that modifications have a dramatic effect on the activity of PEGase1. We found that recombinant PEGase1 can be enriched by 40-70% ammonium sulfate precipitation and purified by HiTrapTM CaptoTM Q ion-exchange chromatography. Measurements of the enzymatic activity of purified PEGase1 under a range of conditions show that its optimal pH is around 5.5, and its optimal temperature is 55°C, with Km = 0.882 mg/ ml. PEGase1 activity is more stable in acidic solution and at low temperatures than it is in alkaline solution and at high temperatures. Metal ions and their concentration are able to affect the enzymatic activity, some metal ions, for example, Cu2+, Ni2+, Zn2+, Fe2+, Ba2+, Mg2+ and Ca2+ can enhance the enzymatic activity at 1 mmol/L concentration and inhabit the activity at 5 mmol/L concentration, but metal ion Mo2+and Co2+show inhabit the enzymatic activity at both concentration.
Keywords
Physarum polycephalum; Endo-β-1,3-1,4-glucanase; Enzymatic properties; Metal ions
Introduction
Linear β-1,3-1,4-glucans are the polysaccharide components of Poaceae, lower plants, and fungi cell walls, and are abundant in the endosperm cell walls of cereals (especially in barley, rye, oats, and wheat) [1]. They can be hydrolyzed by endo-β-1,3-1,4-glucanases (lichenases, EC 3.2.1.73) with specificity for the β-1,4-glycosidic bonds on 3-O-substituted glycosyl residues, resulting in the release of trisaccharide (3-O-L-cellobiosyl-D-glucopyranose), tetra-saccharide (3-O-L- cellotriosyl-D-glucopyranose), and about 10% of the higher oligosaccharides of up to 10 or more contiguous β-1,4-D-glucosyl residues with a single reducing terminal β-1,3-glucosyl residue [2]. These products are believed to have the potential to counteract hypercholesterolemia, hypertriglyceridemia and hyperglycemia, and may be useful agents for the treatment of these conditions [3].
The endo-β-1,3-1,4-glucanases (EGases) have been found in bacteria [4-9], fungi [10-16], algae [17] and plants [1,18,19]. Although they share the same substrate specificity for barley β-1,3-1,4-glucans, plant and microorganism EGases are quite unrelated to each other from the points of view of amino acid sequence and three-dimensional structure. Most of the microorganism EGases belongs to the family of 16 glycoside hydrolases (GH16); they share the β-jelly-roll fold, in which two β-sheets align in a sandwich-like manner, with the β-strands bent around a perpendicularly-oriented substrate-binding cleft [20- 22], and have been applied mainly to beer brewing and feeds for broiler chickens and piglets. Most plant EGases belong to the family of 17 glycoside hydrolases (GH17), and generally adopt a (β/α)8 barrel threedimensional structure [2,23].
Plant EGases play key roles in the degradation of 1,3-1,4-β-glucans during endosperm mobilization and in cell elongation. Takeda et al. found that the transcription level of Gramineae coleoptile endo-beta- 1,3-1,4-glucanase EI increased in response to IAA treatment [18], which suggests that EGases may play a potential role in responding to IAA or other stress. The EGase of winter Rye (Secale cereale) is a cold-induced protein, its recombinant protein exhibits weak antifreeze activity through its ability to modify the growth of ice crystals in vitro [19]. The encoding protein of the Ssglc gene from Synecho cystis can hydrolyze barley beta-glucan and lichenan (beta-1,3-1,4-glucan). Tamoi et al. found that the growth of Ssglc mutant cells was severely inhibited compared with wild-type cells under salt stress, and the levels of some soluble sugars, which may function as osmo protectant factors, were markedly reduced in the Ssglc mutant cells [17], suggesting that EGase may play an important role in response to salt stress.
The results mentioned above suggest that EGases from different species may play different roles in metabolism and stress response. Although they have the same substrate specificity for barley β-1,3-1,4-glucans, their various biological functions remain to be elucidated in detail.
Physarum polycephalum, a plasmodium-forming slime mold of the class Myxomyceteae and a member of the monophylum Mycetozoa, has been found to contain only two kinds of organelle: nuclei and mitochondria. Here, we report an endo-beta-1,3-1,4-glucanase-like protein gene cloned from P. polycephalum, and the characterization of recombinant proteins from the gene expressed in E. coli Origami and Trichoderma reesei QM941.
Materials and Methods
Cell strain
Microplasmodia of P. polycephalum strainM3CVII (ATCC 204388, a gift from Eggehard Holler, Institute of Biophysics and Physical Biochemistry, University of Regensburg) were cultured according to the method of Daniel [24] for 72 h at 24°C.
Gene cloning
A 588-bp 3’-end cDNA fragment of an endo-beta-1,3-1,4-glucanase- like protein (named PEGase-1, Physarum EGase) was baited out from the G2 phase cDNA library of P. polycephalum when screening the relative-protein of PSRPK (Physarum SR protein kinase) using a yeast-two hybrid. To isolate the full-length PEGase-1cDNA, the total RNA was isolated from amoebae and microplasmodia of P. polycephalum using the RNeasy Plant Mini Kit (Qiagen, Valencia, CA, USA). The first-strand cDNA was prepared by OligodT priming from 5 μg of total RNA using a GeneRacerTM Kit (Invitrogen, Carlsbad, CA, USA) following the manufacturer’s instructions. To isolate the 5’ end of the cDNA fragment of PEGase-1, 5’-RLM-rapid amplification of cDNA ends (5’-RLM-RACE) was performed according to the manufacturer’s instructions. After the reverse transcripts were mixed with the GeneRacerTM 5’ Primer and the reverse primer 5’-GGTGTTGTCGATGATGATTCCGTGGTTGTAG- 3’, the touchdown polymerase chain reaction was performed under the following conditions: denaturing at 94°C for 120 s, followed by 5 cycles of 94°C for 30 s and 72°C for 150 s, 5 cycles of 94°C for 30 s and 70°C for 150 s, and 25 cycles of 94°C for 30 s, 65°C for 30 s, and 72°C for 150 s. Nested PCR was performed under the following conditions: 94°C for 180 s followed by 30 cycles of 94°C for 30 s, 65°C for 30 s, and 68°C for 150 s, after the touchdown PCR products were mixed with the Gene RacerTM 5’-Nested Primer and reverse primer 5’-CCCTTAGCCCAGAGCCAGATGTAAATGC-3’. The coding fragment of PEGase-1 was cloned using forward primer 5’-CGCGGATCCATGAACCCTAAAGTGTTCATTTTTG-3’ (with Bam H I site) and reverse primer 5’-GGGAAGCTTTTACTGTTGGTACACTTTGATGG- 3’ (with Hind III site). Both the 5’-end cDNA and the full-length clone were confirmed by complete sequencing.
Plasmid construction
The DNA fragment of PEGase-1 was inserted between the Bam H I and Hind III sites of the vector pET32a (+) (Novagen, Darmstadt, Germany) and transformed into the E. coli strain Origami (Novagen) to produce plasmid pET32-pegase1 and express Trx fusion PEGase-1. Using primers 5’-CGCAGCTAGTGTGCCTCTAGAGGAGCGGATGAACCCTAAAGTGTTCATTT- 3’ (forward), 5’-TTACTGTTGGTACACTTTGATGGAGTTGACC- 3’ (reverse) and template pET32- pegase1 the PEGase-1 DNA fragment was cloned, then inserted at the Eam1105 I site of vector pPIC-PST (containing the promoter of Trichoderma reesei glyceraldehyde-3-phosphate dehydrogenase (Pgpd), followed by the signal sequences of T. reesei cellobiohydrolase II (SS2) and the terminator of T. reesei cellobiohydrolase I (Tcbh1) based on vector pPICZαA) and transformed into E. coli Top10 to produce plasmid pPIC-PST-pegase1.
Gene expression
The pET32-pegase1-containing E. coli transformant was cultivated in LB-medium containing 50 μg/mL Ampicillin and 30 μg/mL Kanamycin. Thioredoxin (Trx) fusion PEGase-1 expression was induced by a final concentration of 1 mmol/L IPTG until the OD600 of the culture reached 0.5.
The PEGase1 expression cassette Pgpd-pegase1-Tcbh1 was amplified using primers 5’-GCTAA GCTTGACGCAGAAGAAGGAAATCGCC (forward),5’-GACACTAGTTGGTACTGGGATACACGAAG (reverse), and plasmid pPIC-PST-pegase1 as a template. The protoplasts of T. reesei strain QM9414 (ATCC 26921) were prepared according to the method described by Li et al.[25]. The Pgpd-pegase1-Tcbh1 fragments mixed with equal amounts of plasmid pAN7-1 (containing promoter gpd-An derived from Aspergillus nidulans and selectable marker gene hph conferring resistance to hygromycin B [26,27]) were co-transformed into the protoplasts of T. Reesei QM9414. The transformants were screened on a Potato Dextrose Agar (PDA) plate containing 100 μg/ mL hygromycin as the selection marker. After 2 days of incubation at 28°C, the mono-cloned mycelia were transplanted to a new selectingplate and incubated for a further 7 days to form conidia, which were then suspended in sterile saline solution (0.9% w/v, NaCl). About 1.0 × 10⁷ conidia were then transferred into 30 mL of Mandels-medium (containing 100 μg/mL hygromycin (w/v) and 6.7 mg/mL glucose (w/v)). After incubating for 2 days at 28°C with 250 rpm agitation, the mycelia were transferred into nutritional medium (Mandels-medium containing 60 mg/mL soybean powder) and incubated for 6 days. The culture supernatant was collected periodically to measure the expression level and enzymatic activity of the PEGase1. The integration of pegase1 in the genome of T. reesei QM9414 transformants (isolated from mycelia using the CTAB method) was confirmed by PCR using specific primers. Candidate transformants were streaked twice on PDA plates that contained 100 μg/ml of hygromycin B, and then transferred to PDA plates to form conidia.
Enzyme assays
The enzymatic activity of PEGase1 was measured using barley β-1,3-1,4-glucans (β-glucan,Megazyme International Ireland, Wicklow, Ireland), laminarin (Sigma, St Louis, MO, USA), and Carboxymethyl Cellulose Sodium (CMC) as the substrates, and the reducing sugar was measured using 3,5-dinitrosalicylic acid (DNS) according to the method described by Miller [28]. The reaction mixture consisted of 20 μL of 1% (w/v) substrate solution dissolved in 20 μL of sodium acetate buffer (50 mmol/L, pH 5.0), and 20 μL enzyme sample. The reaction was performed at 55°C for 10 min, and was then stopped by the addition of 240 μL dinitrosalicylate reagent [28], and 10 min of boiling. After the reaction mixture was diluted with distilled water to a final volume of 2 mL, absorbance was determined at 540 nm using a Spectramax 190 (Molecular Devices, California, USA) spectrophotometer. The amount (μg) of reducing sugar was determined using a curve constructed with glucose as the standard. The enzymatic activity was defined as specific activity using international units per mg protein in the solution (one unit corresponds to the amount of enzyme required to liberate 1 μmol of reducing sugars per minute under the standard assay conditions). The protein concentration was measured using the bicinchoninic acid (BCA) protein assay kit (CWBIO, Beijing, China) following the manufacturer’s instructions, and bovine serum albumin (BSA) was set as the standard (BBI, Markham, Canada).
The optimal pH of the PEGase1 reaction was measured using β-glucan as the substrate at pH ranging from 3.0 to 9.0 under standard assay conditions at 55°C for 10 min. The buffers used in the experiment were 50 mmol/L sodium citrate (pH 3.0), 50 mmol/L sodium acetate (pH 3.5-5.8), 50 mmol/L sodium phosphate (pH 6.5-7.0), and 50 mmol/L Tris (pH 8.0-9.0). Before analysis, the enzyme solution was dialyzed against different pH buffers at 4°C for 24 h and then condensed; the β-glucan solutions were prepared using different pH buffers. The enzymatic stability at different pH was analyzed after the PEGase1 solutions were incubated at 4°C and 55°C for 24 h, respectively.
The optimal temperature of PEGase1 activity was determined by incubating the enzyme at different temperatures ranging from 30 to 80°C in 50 mmol/L sodium acetate buffer (pH 5.5) for 10 min. The thermostability of the enzyme was analyzed by measuring the residual activity under optimal conditions (55°C and 50 mmol/L sodium acetate buffer, pH 5.5, for 10 min) after the enzyme solution was incubated at 30-80°C for 60-120 min. The preservation stability of the enzyme was analyzed by measuring the residual activity under optimal conditions after the purified PEGase1 was stored at 4°C for one year. Relative activity was calculated as enzymatic activity at the indicated temperature divided by the maximal activity at the optimal temperature.
Effects of metallic ions on PEGase1 activity
The effects of metallic ions (Ca2+, Mg2+, Fe2+, Zn2+, Cu2+, Ba2+, Ni2+, Mn2+ and Co2+) on the activity of PEGase1 were measured using β-glucan as the substrate at 55°C in 50 mmol/L sodium acetate buffer (pH 5.5) for 10 min, with 1 and 5 mmol/L of the ions present in the reaction mixture.
Kinetic parameters
To determine the kinetic parameters, the enzyme activity assays were performed at 55°C, using 0.687 mg/mL of PEGase1 and 0.5, 2.5, 5.0, 10, 20 and 40 mg/mL of β-glucan dissolved in 50 mmol/L sodium acetate buffer (pH 5.5). The Km, Kcat and Vmax values of PEGase1 were obtained using a Michaelis-Menten plot with a non-linear regression data analysis program [29].
Purifications of recombinant enzyme
The proteins from the supernatant of T. reesei QM9414 transformant grown in Mandels-medium containing 6.7 mg/mL glucose were precipitated by 40% to 70% saturation of ammonium sulfate for 2 h at 4°C. After dialysis against 50 mmol/L sodium acetate buffers (pH 5.5) overnight at 4°C, the crude enzyme solution was condensed by ultrafiltration using a 3,000 Da cut-off membrane. PEGase1 was purified from the concentrate using a pre-load HiTrapTMCaptoTMQ ionexchange column (1×5 cm,GE Healthcare Life Sciences, Piscataway, NJ, USA), equilibrated with 50 mmol/L sodium acetate buffer (pH 4.5), and eluted with the same buffer containing a NaCl linear gradient from 0 to 1.0 mol/L at a flow rate of 0.2 mL/min on an AKTA PPLC liquid chromatography system (GE Healthcare Life Sciences). The fractions from elution peaks were collected and then dialyzed against 50 mmol/L sodium acetate buffer (pH 5.5). The activities of PEGase1 in the pooled fractions were then checked according to the method described above. To confirm their purity, active fractions were subsequently analyzed by sodium dodecyl sulfate-polyacrylamide gel electrophoresis (SDSPAGE), and then stored at -20°C until use.
Results
Cloning and sequence analysis of PEGase1
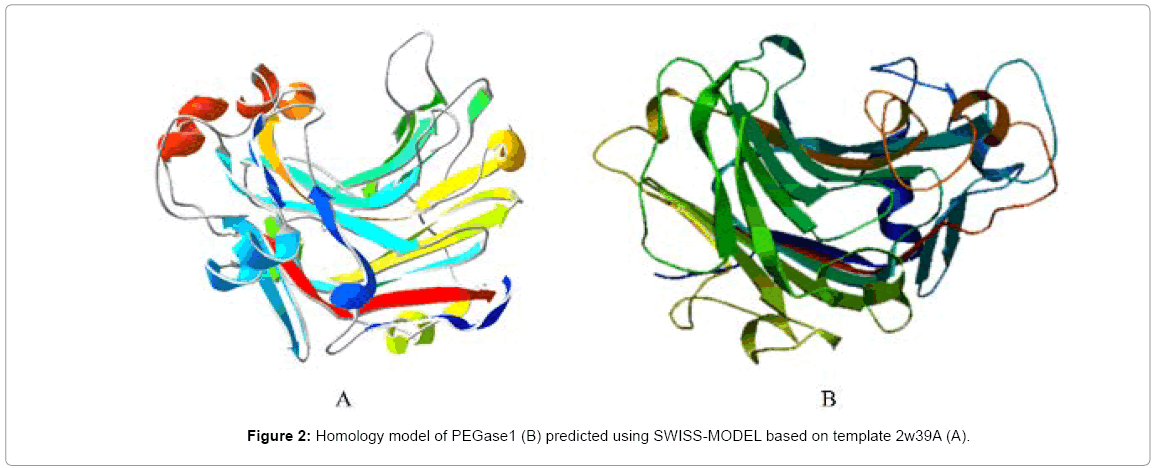
A partial cDNA encoding an endo-β-1,3-1,4-glucanase (EGase) homologue was screened out by PSRPK [31] from the P. polycephalum cDNA library through a yeast two-hybrid, and the full-length cDNA was obtained using the 5’-RLM-RACE method, which encodes a 309-aa peptide (MW≈34 kDa and pI=5.0). The protein BLAST result (Figure 1) indicates that this protein has 44% identity with the Paecilomycesendo-β-1,3-1,4-glucanase (accession no. ADK55597), and the structural model (Figure 2) predicted using SWISS-MODEL based on the template protein (PDB ID: 2w39A) demonstrates that the protein belongs to the jellyroll β-sandwich structure of the GH family 16, and was designated as PEGase1 (Physarum EGase 1, GenBank accession No. KF442978 here.
Expressions of recombinant enzyme
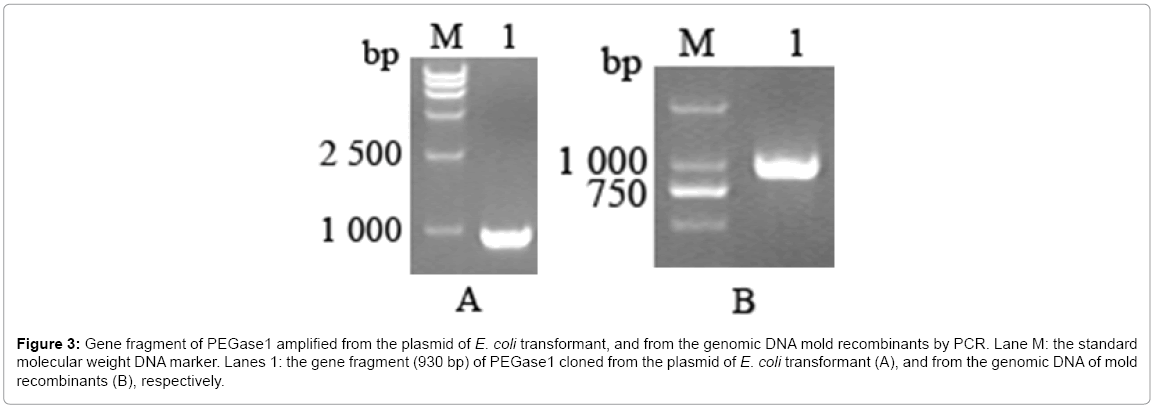
The gene of PEGase1 presented in the transformant of E. coli, and in the recombinants of mold, were confirmed using PEGase1-specific primers. Figure 3a,b demonstrates that the 930 bp length fragment of the PEGase1 gene are amplified by PCR from the E. coli transformant and the genomic DNAs from the recombinants of mold respectively.
Figure 3: Gene fragment of PEGase1 amplified from the plasmid of E. coli transformant, and from the genomic DNA mold recombinants by PCR. Lane M: the standard molecular weight DNA marker. Lanes 1: the gene fragment (930 bp) of PEGase1 cloned from the plasmid of E. coli transformant (A), and from the genomic DNA of mold recombinants (B), respectively.
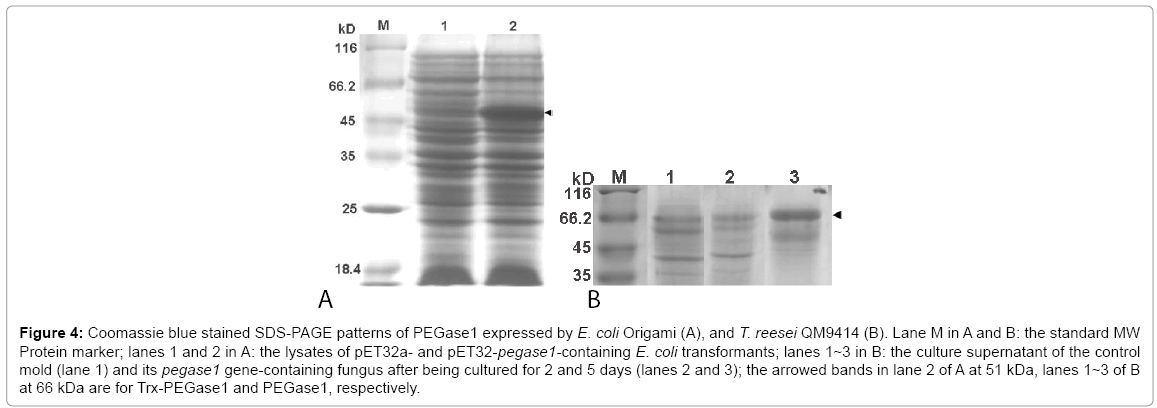
The deduced molecular weights of Trx, PEGase1 and Trx-fused PEGase1 are 17, 34 and 51 kDa respectively. Lane 1 of Figure 4A demonstrates that the MW of Trx-PEGase1 expressed in E. coli was 51 kDa, which suggests that PEGase1 had no obvious modifications in E. coli. The PEGase1-like proteins expressed in T. reesei QM9414 was 66 kDa (lanes 2 and 3 of Figure 4B), suggesting that modifications occurred during PEGase1 expression in fungus. The results of enzyme assays using 10 mg/mL barley β-glucans as the substrates demonstrated that the glycoside hydrolase activity of the final fermentation broth of fungus recombinants was 0.094 U/mg. In contrast, the PEGase1 expression from E. coli showed no glycoside hydrolase activity. The results described above suggest that the enzyme activity of PEGase1 is probably dependent on its protein modifications.
Figure 4: Coomassie blue stained SDS-PAGE patterns of PEGase1 expressed by E. coli Origami (A), and T. reesei QM9414 (B). Lane M in A and B: the standard MW Protein marker; lanes 1 and 2 in A: the lysates of pET32a- and pET32-pegase1-containing E. coli transformants; lanes 1~3 in B: the culture supernatant of the control mold (lane 1) and its pegase1 gene-containing fungus after being cultured for 2 and 5 days (lanes 2 and 3); the arrowed bands in lane 2 of A at 51 kDa, lanes 1~3 of B at 66 kDa are for Trx-PEGase1 and PEGase1, respectively.
Purified recombinant PEGase1
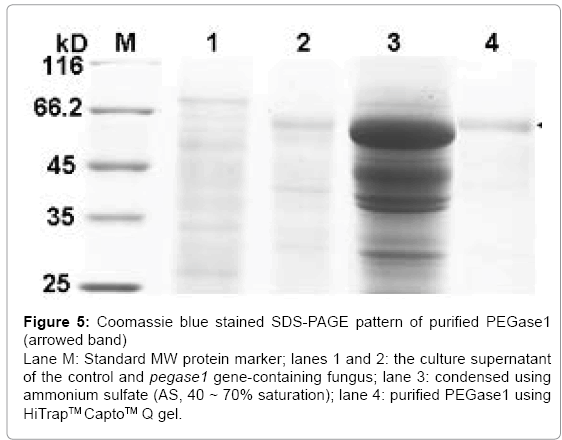
After separation from the culture supernatant of pegase1- containing fungus using 40–70% saturation of ammonium sulfate (AS), the proteins in the PEGase1-containing portion were enriched by 19 times, after which the specific activity of PEGase1 was enhanced from 0.080 to 1.524 U/mg, and the total activity recovered was 62% of the original level. After purification using HiTrapTMCaptoTM Q gel, the proteins in the PEGase1-containing portion were enriched by 27 times; the specific activity of PEGase1 was enhanced to 2.170 U/mg, and the enzyme activity recovered was 48% of the original level. The Coomassie blue stained SDS-PAGE results (Figure 5) demonstrate that PEGase1 can be enriched by two steps of AS precipitation (lane 3 of Figure 5) and purified by one step of HiTrapTMCaptoTM Q gel (lane 4 of Figure 5).
Figure 5: Coomassie blue stained SDS-PAGE pattern of purified PEGase1 (arrowed band) Lane M: Standard MW protein marker; lanes 1 and 2: the culture supernatant of the control and pegase1 gene-containing fungus; lane 3: condensed using ammonium sulfate (AS, 40 ~ 70% saturation); lane 4: purified PEGase1 using HiTrapTM CaptoTM Q gel.
The optimal testing time for PEGase1 activity
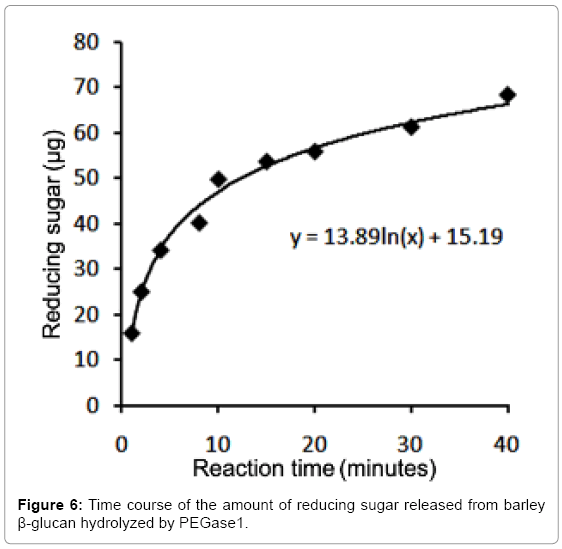
After dialysis against 50 mmol/L sodium acetate buffer (pH 5.5) and concentration, the purified PEGase1 was adjusted to 0.687 mg/ mL. The reducing sugar produced from barley β-glucan catalyzed by PEGase1 was detected at 1, 2, 4, 8, 10, 15, 20, 30 and 40 min after the reaction was started. Figure 6 shows that the reducing sugar increased monotonically during the first 40 minutes of the reaction; the data points can be fit with the logarithmic formula y=13.89ln(x)+15.19, where y is the mass of the sugar in μg and x is reaction time in minutes. We selected 15 minutes as the optimal time for testing PEGase1 activity in this study.
Substrate specificity and kinetic parameters
To understand the substrate specificity of PEGase1, the activity of PEGase1 hydrolyzing different substrates was determined. The results demonstrate that recombinant PEGase1 has 2.335, 0.441 and 0.234 U/ mg hydrolyzing activity for barley β-glucan, laminarin, and Carboxyl Methyl Cellulose (CMC), respectively, which suggests that barley β-glucan is the specific substrate of PEGase1. Measurements of the kinetic parameters for the reaction showed that the apparent Km and Vmax values of PEGase1 against barley β-glucan are 0.882 mg/mL and 0.691 mg/min, respectively.
The optimal pH and temperature for PEGase1 hydrolysis of barley β-glucan
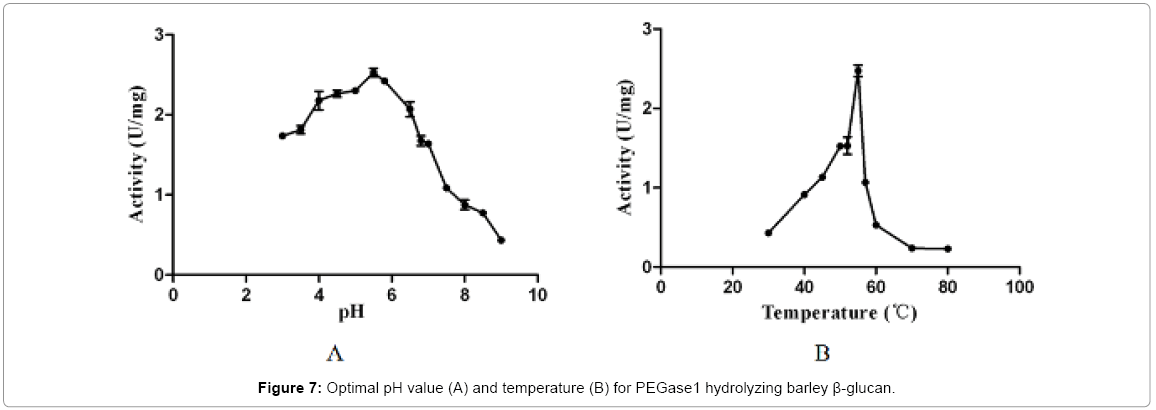
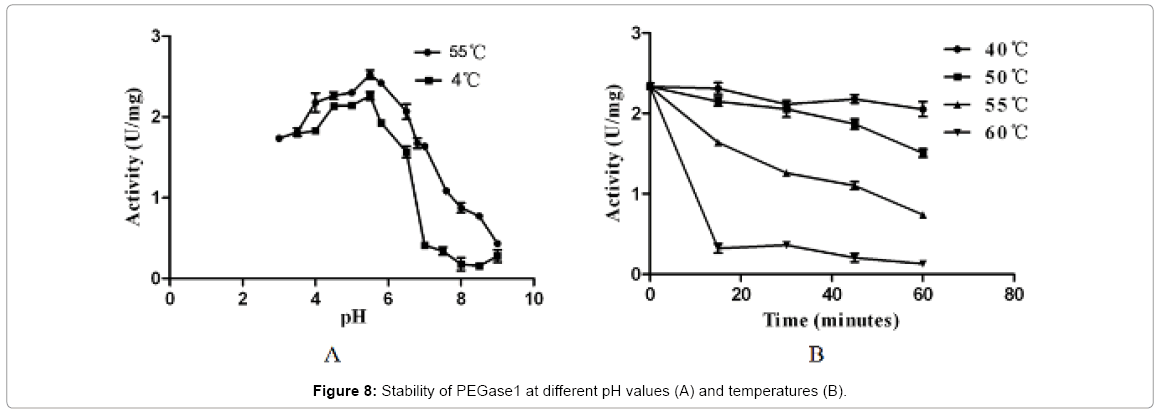
Figure 7 shows that the recombinant PEGase1 exhibited maximal activity at pH 5.5 (Figure 7A) and 5°C (Figure 7B); and its activity in the range pH 3.0-7.0 and 50-55°C was greater than half of the maximum. To investigate the stability of PEGase1, its activities at different pH values and temperatures were determined. Figure 8A demonstrates that the activity variation with pH of PEGase1 at 4°C follows a similar profile to that at 55°C, with the activity decreasing more acutely with lowered temperature at high pH than at low pH; this suggests that temperature does not affect the optimal pH of PEGase1, but PEGase1 performs more stably at low pH than it does at high pH. In order to detect the PEGase1 thermostability, PEGase1 was stored at 40, 50, 55, 60 and 70°C for one hour and the enzymatic activities were detected by producing reducing sugar from barley β-glucan catalyzed by the PEGase1 at 15 min interval after one hour treatment. The change in PEGase1 activity over time was measured at different temperatures (Figure 8B), and activity was found to decrease much faster at high temperatures than at low temperatures, suggesting that PEGase1 is more stable at low temperatures than at high temperatures.
Effects of metal ions on the activity of PEGase1
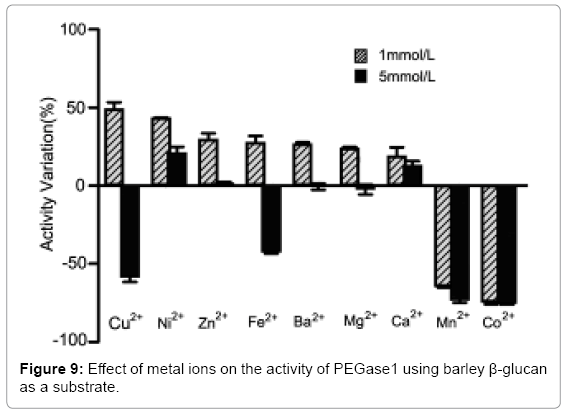
Figure 9 shows that the activity of PEGase1 was enhanced 49.1%, 43.3%, 29.6%, 27.7%, 26.8%, 23.8% and 19.0% in reaction buffers containing 1 mmol/L of Cu2+, Ni2+, Zn2+, Fe2+, Ba2+, Mg2+ and Ca2+, respectively, and decreased 64.6% and 74.5% in reaction buffers containing 1 mmol/Lof Mn2+ and Co2+, respectively; while the activity was enhanced 20.9%, 1.4% and 12.9% in reaction buffers containing 5 mmol/L of Ni2+, Zn2+ and Ca2+, respectively, and decreased 58.4%, 42.6%, 0.6% and 2.4% in reaction buffers containing 5 mmol/L of Cu2+, Fe2+, Ba2+ and Mg2+, respectively. This demonstrates that metal ions can affect the activity of PEGase1 dramatically, depending on the type and the concentration of metal ion.
Storage stability of PEGase1 in the fermentation solution
After the fermentation solution was stored at 4°C for one year, PEGase1 retained 66.5% of its initial activity, suggesting that its activity can largely be preserved by storing PEGase1 at low temperature.
Discussion
The genes of endo-β-1,3-1,4-glucanase (EGase) have been found in a variety of bacteria [4-9], fungi [10-16], algae [17] and plants [1,18,19]. Here, we report a novel EGase(PEGase1) isolated from the lower eukaryote P. polycephalum. Most of the microorganism EGase members belong to the GH16 family, which share a β-jelly-roll fold structure [20-22], while most of the plant EGase members belong to the GH17 family, which have a (β/α)8 barrel structure [2,23]. Using the structural modeling software SWISS-MODEL, a homology model with a β-jellyroll fold structure was obtained (Figure 1B), which suggests that PEGase1 belongs to the GH16 family. The active center of bacterium EGases contains the conserved motif DEIDIE [4], while the active center of fungus EGases contains a different conserved motif GEIDIIE [30]. Both conserved peptides contain two Glu residues, which play a catalytic nucleophile role and an acid/base catalyst role, respectively. Comparison with other EGases of the GH16 family using Clustal X (1.83), we see that PEGase1 contains a sequence corresponding to the motif GEIDIIE of the fungus EGases, suggesting that PEGase1 may have a similar function to that of fungus EGases. Our results demonstrate that the recombinant PEGase1 expressed by T. reesei QM9414 showed an effective enzymatic activity, but the recombinant protein expressed by E. coli was not able to hydrolyze barley β-glucan. The molecular weights of the recombinant PEGase1 expressed by T. reesei QM9414 and E. coli Origami were 66 kDa and 34 kDa respectively, suggesting that the modifications of the recombinant proteins expressed by mold and bacterium are dramatically different, and that the activity of PEGase1 depends on its modification level. Our results also demonstrate that after seven generations, the genetic offspring of recombinant T. reesei still retain the gene for PEGase1 and reliably express PEGase1 proteins.
Hua et al. found that the EGase of Paceilomyces thermophila expressed by P. pastoris GS115 could be purified using Q-Sepharose (anion) ion-exchange and a Sephacryl S-100HR molecular sieve [30]. Celetino et al. found that the EGase of Rhizopus microsporus var. microsporus could be purified using SP-Sepharose (cation)ionexchange and an S-100HR molecular sieve [31]. Hong et al. found that the EGase of Laetiporus sulphureus var. miniatus could be isolated by ammonium sulfate (AS) precipitation, and purified by HiTrap Q HP and UNO Q (anion) ion-exchange chromatography [32]. Here, we isolated the recombinant PEGase1 using two cycles of ammonium sulfate precipitation (40% ~ 70%) and HiTrapTMCaptoTM Q (anion) ionexchange chromatography, and found that PEGase1 was enriched 19 and 27 times, and proteins were recovered at levels of 62% and 48%, after the first and second cycles, respectively. These results suggest that our isolating protocol is practical for PEGase1.
Previous reports found that the Km values of Paceilomyces thermophila, Rhizopus microsporus and Laetiporus sulphureus EGases for hydrolyzing β-glucan were 2.46 mg/mL [30], 22.39 mg/mL [31] and 0.67 mg/mL [32], respectively. Our results demonstrate that the Kmvalue of PEGase1 is 0.882 mg/mL, which ranks the catalyzing efficiency of PEGase1 above the EGases of P. thermophila [30] and R. microspores [31], but below the EGase of L. sulphureus [32].
Previous reports found that the optimal pH of bacterium EGases lies in the range 6.0–7.5, but the optimal pH of fungus EGases varies dramatically [4]. The optimal pH of P. thermophila, L. sulphureus and P. thermophila EGases are 7.0, 5.0 and 4.0, respectively [30-32]. Our results demonstrate that the optimal pH of PEGase1 is 5.5. PEGase1 activity was not found to change significantly at 4°C for 24 hours in the pH 3.5 to pH 5.5 buffer, while activity decreased markedly at 4°C for 24 hours above pH 7.0. The results suggest that PEGase1 activity is more stable in acidic solution than it is in alkaline solution.
Previous reports demonstrated that the optimal temperatures of most bacterium EGases range from 45-50°C [4], while the optimal temperatures of most fungus EGases vary from 37-50°C [32], exceptions being P. thermophila and L. sulphureus EGases, whose optimal temperatures have been measured to be 70°C and 75°C, respectively [30,32]. Our results demonstrate that the optimal temperature of PEGase1 is 55°C, which is compatible with the requirements of beer brewing. Hua et al. found that the activity of P. thermophila EGase could be decreased 10% and 35% at 50°C and 65°C for 30 min, respectively [30]. Our results demonstrate that the activity of PEGase1 decreased 46% at 55°C for 30 min, suggesting that PEGase1 is less stable than P. thermophila EGase.
Celetino et al. found that the activity of R. microsporus EGase could be decreased 99.7%, 37.7% and 35.0% by 12 mmol/L of Cu2+, Mn2+and Zn2+, respectively, but was enhanced 5% by 12 mmol/L of Ca2+ [31]. Hong et al. found that the activity of L. sulphureus EGase was decreased 67% by 1 mmol/L of Mn2+, but was enhanced 19.0% by 1 mmol/L of Ni2+ [32]. Xie et al. found that the activity of Bacillus EGases was decreased 78.3% and 25.8% by 10 mmol/L Cu2+ and Mn2+, respectively, but enhanced 3.5% by 10 mmol/L Ca2+ [33]. Our results demonstrated that the activity of PEGase1 could be enhanced 49.1%, 43.3%, 29.6%, 27.7%, 26.8%, 23.8% and 19.0% by 1 mmol/L of Cu2+, Ni2+, Zn2+, Fe2+, Ba2+, Mg2+ and Ca2+ respectively, and enhanced 20.9% and 12.9% by 5 mmol/L of Ni2+and Ca2+, respectively, but decreased 64.6% and 74.5% by 1 mmol/L of Mn2+ and Co2+, respectively, and decreased 58.4%, 42.6%, 73.4% and 75.4% by 5 mmol/L of Cu2+, Fe2+, Mn2+ and Co2+ respectively. Enzymatic activities were not significantly affected by adding 5 mmol/L of Ba2+, 5 mmol/L of Zn2+ and 5 mmol/L of Mg2+ respectively. These results suggest that suitable concentrations of the metal ions Cu2+, Ni2+, Zn2+, Fe2+, Ba2+, Mg2+and Ca2+can enhance the activity of PEGase1, but both 1 and 5 mmol/L of Co2+ and Mn2+ inhibit the activity of PEGase1.
Funding
This work was supported by the grants from the National Natural Science Foundation of China (31070043), and the Shenzhen Science & Technology Foundation (JC201005280549A).
References
- Burton RA, Fincher GB (2009) (1,3;1,4)-beta-D-glucans in cell walls of the poaceae, lower plants, and fungi: a tale of two linkages. Mol Plant 2: 873-882.
- Hrmova M, Fincher GB (2001) Structure-function relationships of beta-D-glucanendo- and exohydrolases from higher plants. Plant MolBiol 47: 73-91.
- Kim KH, Kim YO, Ko BS, Youn HJ, Lee DS (2004) Over-expression of the gene (bglBC1) from Bacillus circulans encoding an endo-beta-(1-->3),(1-->4)-glucanase useful for the preparation of oligosaccharides from barley beta-glucan. Biotechnol Lett 26: 1749-1755.
- Planas A (2000) Bacterial 1,3-1,4-beta-glucanases: structure, function and protein engineering. BiochimBiophysActa 1543: 361-382.
- Kim JY (2003) Overproduction and secretion of Bacillus circulans endo-beta-1,3-1,4-glucanase gene (bglBC1) in B. subtilis and B. megaterium. Biotechnol Lett 25: 1445-1449.
- Yao WL, Wang YS, Han JG, Li LB, Song W (2004) [Purification and cloning of an antifungal protein from the rice diseases controlling bacterial strain Paenibacillus polymyxa WY110]. Yi Chuan Xue Bao 31: 878-887.
- Akita M, Kayatama K, Hatada Y, Ito S, Horikoshi K (2005) A novel beta-glucanase gene from Bacillus halodurans C-125. FEMS MicrobiolLett 248: 9-15.
- Dvortsov IA, Lunina NA, Zverlov VV, Velikodvorskaia GA (2010) [Substrate-binding properties of family 54 module of laminarinase Lic16A of Clostridium thermocelwnum]. MolBiol (Mosk) 44: 671-676.
- Shao X, Ni H, Lu T, Jiang M, Li H, et al. (2012) An improved system for the surface immol/Lobilisation of proteins on Bacillus thuringiensis vegetative cells and spores through a new spore cortex-lytic enzyme anchor. NBiotechnol 29: 302-310.
- Spilliaert R, Hreggvidsson GO, Kristjansson JK, Eggertsson G, Palsdottir A (1994) Cloning and sequencing of a Rhodothermus marinus gene, bglA, coding for a thermostable beta-glucanase and its expression in Escherichia coli. Eur J Biochem 224: 923-930.
- VukicVranjes M, Wenk C (1996) Influence of Trichodermaviride enzyme complex on nutrient utilization and performance of laying hens in diets with and without antibiotic supplementation. PoultSci 75: 551-555.
- Kanauchi M, Bamforth CW (2001) Growth of Trichodermaviride on crude cell wall preparations from barley. J Agric Food Chem 49: 883-887.
- Sinitsyna OA, Bukhtoyarov FE, Gusakov AV, Okunev ON, Bekkarevitch AO, et al. (2003) Isolation and properties of major components of Penicillium canescens extracellular enzyme complex. Biochemistry (Mosc) 68: 1200-1209.
- Luo H, Yang J, Yang P, Li J, Huang H, et al. (2010) Gene cloning and expression of a new acidic family 7 endo-beta-1,3-1,4-glucanase from the acidophilic fungus Bispora sp. MEY-1. Appl Microbiol Biotechnol 85: 1015-1023.
- Jia H, Li Y, Liu Y, Yan Q, Yang S, et al. (2012) Engineering a thermostable β-1,3-1,4-glucanase from Paecilomycesthermophila to improve catalytic efficiency at acidic pH. J Biotechnol 159: 50-55.
- Hung YL, Chen HJ, Liu JC, Chen YC (2012) Catalytic efficiency diversification of duplicate β-1,3-1,4-glucanases from Neocallimastixpatriciarum J11. Appl Environ Microbiol 78: 4294-4300.
- Tamoi M, Kurotaki H, Fukamizo T (2007) Beta-1,4-glucanase-like protein from the cyanobacterium Synechocystis PCC6803 is a beta-1,3-1,4-glucanase and functions in salt stress tolerance. Biochem J 405: 139-146.
- Takeda H, Sugahara T, Kotake T, Nakagawa N, Sakurai N (2010) Sugar treatment inhibits IAA-induced expression of endo-1,3:1,4-beta-glucanase EI transcripts in barley coleoptile segments. Physiol Plant 139: 413-420.
- Yaish MW, Doxey AC, McConkey BJ, Moffatt BA, Griffith M (2006) Cold-active winter rye glucanases with ice-binding capacity. Plant Physiol 141: 1459-1472.
- Keitel T, Simon O, Borriss R, Heinemann U (1993) Molecular and active-site structure of a Bacillus 1,3-1,4-beta-glucanase. Proc Natl Acad Sci U S A 90: 5287-5291.
- Johansson P, Brumer H 3rd, Baumann MJ, Kallas AM, Henriksson H, et al. (2004) Crystal structures of a poplar xyloglucanendotransglycosylase reveal details of transglycosylation acceptor binding. Plant Cell 16: 874-886.
- Ilari A, Fiorillo A, Angelaccio S, Florio R, Chiaraluce R, et al. (2009) Crystal structure of a family 16 endoglucanase from the hyperthermophile Pyrococcus furiosus--structural basis of substrate recognition. FEBS J 276: 1048-1058.
- Varghese JN, Garrett TP, Colman PM, Chen L, Høj PB, et al. (1994) Three-dimensional structures of two plant beta-glucanendohydrolases with distinct substrate specificities. ProcNatlAcadSci U S A 91: 2785-2789.
- Deniel JW, Baldwin HH (1964) Methods of culture of plasmodialmyxomycetes. In: Methods in cell physiology. Prescott DM (Edr.), Volume 1, Academic Press, New York.
- McCouch SR, Kochert G, Yu ZH, Wang ZY, Khush GS, et al. (1988) Molecular mapping of rice chromosomes. TheorAppl Genet 76: 815-829.
- Li J, Wang J, Wang S, Xing M, Yu S, et al. (2012) Achieving efficient protein expression in Trichodermareesei by using strong constitutive promoters. Microb Cell Fact 11: 84.
- Punt PJ, Oliver RP, Dingemanse MA, Pouwels PH, van den Hondel CA (1987) Transformation of Aspergillus based on the hygromycin B resistance marker from Escherichia coli. Gene 56: 117-124.
- Miller GL (1959) Use of dinitrosalicylic acid reagent for determination of reducing sugar. Anal Chem 31: 426-428.
- Brown AM (2001) A step-by-step guide to non-linear regression analysis of experimental data using a Microsoft Excel spreadsheet. Comput Methods Programs Biomed 65: 191-200.
- Hua C, Yan Q, Jiang Z, Li Y, Katrolia P (2010) High-level expression of a specific beta-1,3-1,4-glucanase from the thermophilic fungus Paecilo mycesthermophila in Pichiapastoris. Appl Microbiol Biotechnol 88: 509-518.
- Celestino KR, Cunha RB, Felix CR (2006) Characterization of a beta-glucanase produced by Rhizopusmicrosporus var. microsporus, and its potential for application in the brewing industry. BMC Biochem 7: 23.
- Hong MR, Kim YS, Joo AR, Lee JK, Kim YS, et al. (2009) Purification and characterization of a thermostable beta-1,3-1,4-glucanase from Laetiporus sulphureus var. miniatus. J Microbiol Biotechnol 19: 818-822.
- Xie Y, Gu GX, Li Q(2008) Study on the purification and some enzymological properties of recombinant ß-1,3-1,4- glucanase. J Anhui AgriSci 36: 8510-8512.
Relevant Topics
- Agricultural biotechnology
- Animal biotechnology
- Applied Biotechnology
- Biocatalysis
- Biofabrication
- Biomaterial implants
- Biomaterial-Based Drug Delivery Systems
- Bioprinting of Tissue Constructs
- Biotechnology applications
- Cardiovascular biomaterials
- CRISPR-Cas9 in Biotechnology
- Nano biotechnology
- Smart Biomaterials
- White/industrial biotechnology
Recommended Journals
Article Tools
Article Usage
- Total views: 14816
- [From(publication date):
April-2015 - Jul 04, 2025] - Breakdown by view type
- HTML page views : 10168
- PDF downloads : 4648
